Statistical measures of asset returns are essential tools in finance, providing insights into the performance, risk, and volatility of investments. Key measures include mean return, variance, standard deviation, covariance, and correlation, each helping to evaluate an asset’s behavior over time and relative to other assets. These measures allow investors to assess potential returns and risks, guiding decisions on portfolio construction and diversification. Mastery of these concepts is crucial for analyzing historical returns and predicting future outcomes, making them fundamental for the CFA Exam and financial analysis.
Learning Objectives
In studying ” Statistical Measures of Asset Returns ” for the CFA Exam, you should aim to understand key statistical tools used to evaluate and compare asset returns, including mean return, variance, standard deviation, covariance, and correlation. Analyze how these measures help assess the risk, volatility, and expected return of individual assets and portfolios. Evaluate additional concepts such as skewness and kurtosis to interpret the distribution characteristics of returns. Additionally, explore the applications of mean-variance analysis for optimizing portfolios and making informed investment decisions, applying your understanding to assess risk-return trade-offs in CFA practice scenarios.
Statistical measures of asset returns are essential for understanding investment performance, risk, and return dynamics in financial markets. For the CFA exam, it is important to master concepts like mean return, variance, standard deviation, covariance, correlation, and other statistical tools used to evaluate and compare asset returns.
Mean Return
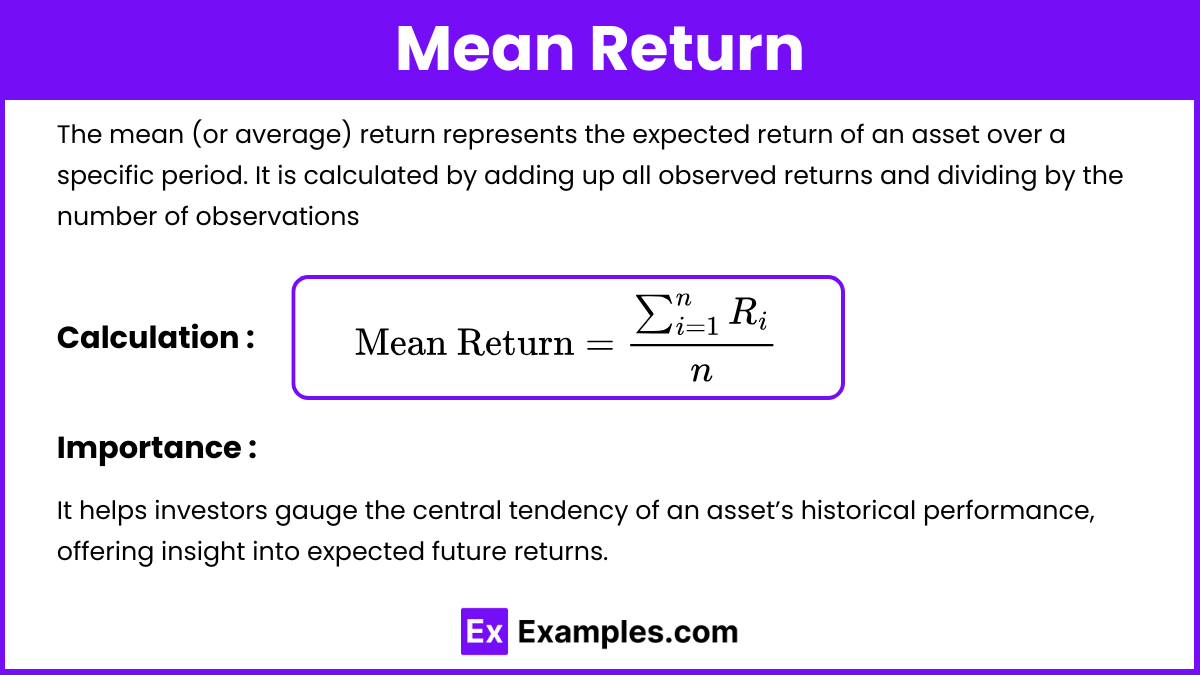
- The mean (or average) return represents the expected return of an asset over a specific period.
- Calculation: It is calculated by adding up all observed returns and dividing by the number of observations:

- Importance: It helps investors gauge the central tendency of an asset’s historical performance, offering insight into expected future returns.
Variance and Standard Deviation
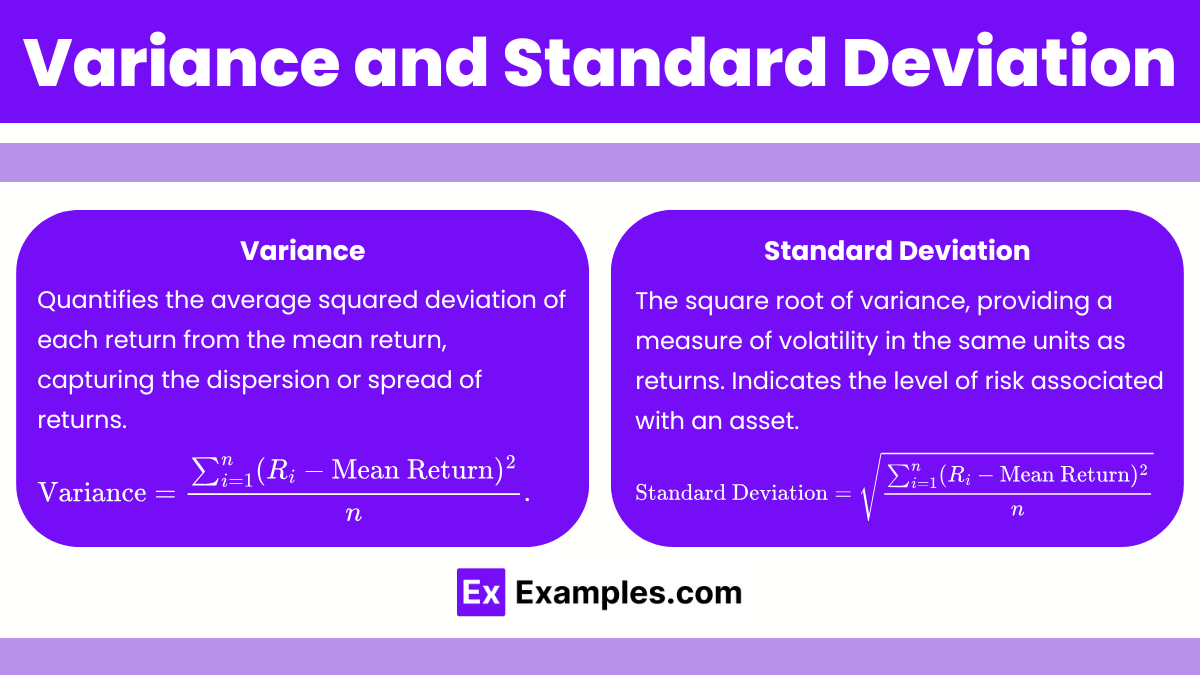
- Variance: Quantifies the average squared deviation of each return from the mean return, capturing the dispersion or spread of returns. Variance measures the dispersion of returns around the mean, indicating the level of risk associated with an asset. Higher variance implies greater return volatility.
 .
. - Standard Deviation: The square root of variance, providing a measure of volatility in the same units as returns. Indicates the level of risk associated with an asset. As the square root of variance, standard deviation provides a measure of volatility in the same units as the asset’s returns. It is commonly used as a risk indicator in portfolio management.

- Importance: Both variance and standard deviation are essential for understanding the risk and potential return fluctuations of an asset.
Covariance
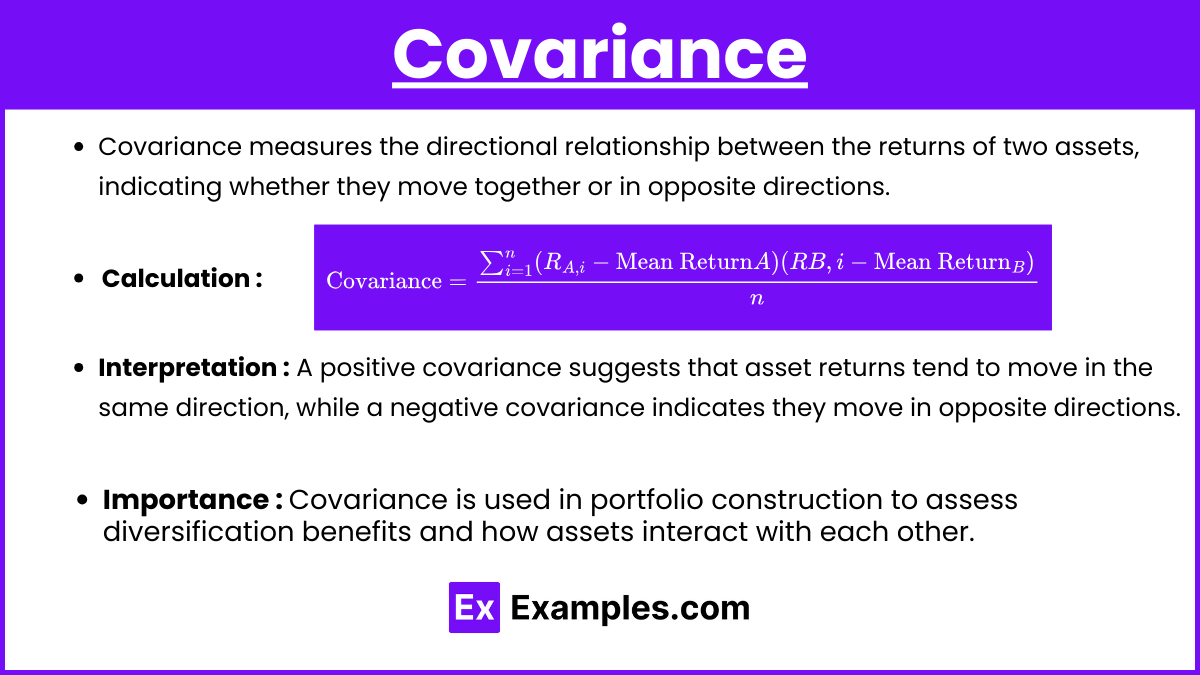
- Definition: Covariance measures the directional relationship between the returns of two assets, indicating whether they move together or in opposite directions.
- Calculation:
 .
. - Interpretation: A positive covariance suggests that asset returns tend to move in the same direction, while a negative covariance indicates they move in opposite directions.
- Importance: Covariance is used in portfolio construction to assess diversification benefits and how assets interact with each other.
Correlation

- Definition: Correlation standardizes covariance to a range between -1 and 1, providing a clear measure of the strength and direction of the relationship between two assets.
- Formula:
 where σA and σB are the standard deviations of assets A and B.
 - Interpretation:
- 1: Perfect positive correlation (assets move identically).
- -1: Perfect negative correlation (assets move inversely).
- 0: No correlation (no consistent relationship in movement).
- Importance: Correlation helps in constructing diversified portfolios, as lower correlation between assets reduces overall portfolio risk.
Skewness
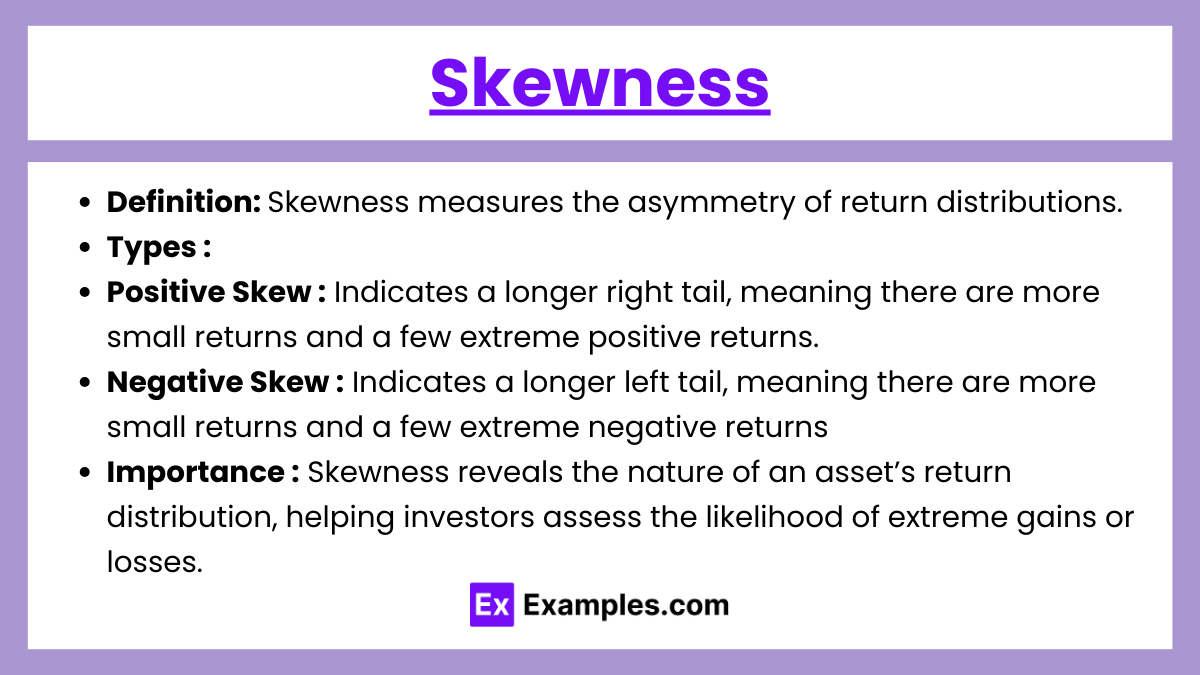
- Definition: Skewness measures the asymmetry of return distributions.
- Types:
- Positive Skew: Indicates a longer right tail, meaning there are more small returns and a few extreme positive returns.
- Negative Skew: Indicates a longer left tail, meaning there are more small returns and a few extreme negative returns.
- Importance: Skewness reveals the nature of an asset’s return distribution, helping investors assess the likelihood of extreme gains or losses.
Kurtosis
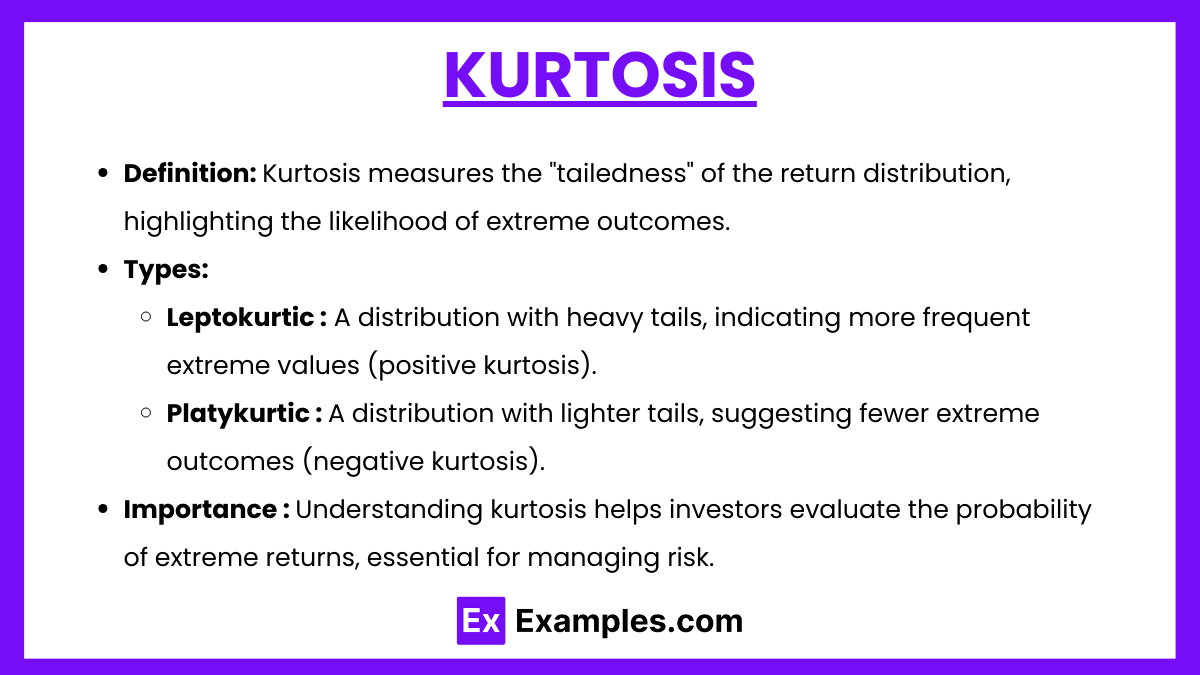
- Definition: Kurtosis measures the “tailedness” of the return distribution, highlighting the likelihood of extreme outcomes.
- Types:
- Leptokurtic: A distribution with heavy tails, indicating more frequent extreme values (positive kurtosis).
- Platykurtic: A distribution with lighter tails, suggesting fewer extreme outcomes (negative kurtosis).
- Importance: Understanding kurtosis helps investors evaluate the probability of extreme returns, essential for managing risk.
Examples
Example 1. Calculating the Arithmetic Mean Return for Stock Performance
An analyst is assessing the performance of a stock that has delivered annual returns of 8%, 12%, and 15% over three years. The arithmetic mean return is calculated by adding the returns (8% + 12% + 15%) and dividing by 3, resulting in an average return of 11.67%. This basic measure of expected return is useful for a quick comparison with other stocks or indices, though it does not account for compounding effects over multiple periods.
Example 2. Using Geometric Mean to Determine Compound Growth Rate
A mutual fund’s returns over three years are 10%, 5%, and 20%. The geometric mean return, which accounts for compounding, is calculated as ![]() , yielding approximately 11.5%. This method reflects the average rate of return per period for investments held over multiple years, and is especially useful for understanding long-term performance in the CFA exam.
, yielding approximately 11.5%. This method reflects the average rate of return per period for investments held over multiple years, and is especially useful for understanding long-term performance in the CFA exam.
Example 3. Assessing Risk with Standard Deviation in a Portfolio
An investor holds a portfolio with annual returns over four years of 6%, 10%, 12%, and -2%. The standard deviation is calculated by finding the variance in returns around the mean, then taking the square root of this variance. This standard deviation, or volatility, provides insight into the portfolio’s risk profile, with higher values indicating greater variability. In the CFA curriculum, understanding standard deviation is crucial for evaluating and comparing risk across different assets or portfolios.
Example 4. Evaluating Risk-Adjusted Performance with the Sharpe Ratio
A bond fund has an average annual return of 9% and a standard deviation of 5%, while the risk-free rate is 2%. The Sharpe Ratio is calculated as ![]() . This ratio measures the fund’s excess return per unit of risk, making it easier to compare risk-adjusted performance with other investment options. In the CFA context, the Sharpe Ratio is key for identifying investments that offer the highest return for a given level of risk.
. This ratio measures the fund’s excess return per unit of risk, making it easier to compare risk-adjusted performance with other investment options. In the CFA context, the Sharpe Ratio is key for identifying investments that offer the highest return for a given level of risk.
Example 5. Understanding Correlation for Portfolio Diversification
An investor holds stocks in both a technology and a utilities company. Historically, the returns on these stocks have had a correlation coefficient of -0.3, indicating a weak, inverse relationship. This negative correlation implies that when technology stocks perform poorly, utility stocks may perform well, helping to stabilize the portfolio’s overall return. In the CFA exam, correlation is a critical metric for diversification, enabling candidates to optimize portfolios by balancing assets with different risk and return profiles.
Practice Questions
Question 1
What is the primary advantage of using the geometric mean over the arithmetic mean when calculating the average return of an investment over multiple periods?
A) It accounts for compounding, giving a more accurate measure of return over time.
B) It is easier to calculate and understand than the arithmetic mean.
C) It tends to give a higher return estimate, making investments look more favorable.
D) It disregards any losses, focusing only on positive returns.
Answer: A) It accounts for compounding, giving a more accurate measure of return over time.
Explanation: The geometric mean considers the compounding effect over multiple periods, making it a more accurate measure of average return for investments held over time. Unlike the arithmetic mean, which simply averages returns without accounting for compounding, the geometric mean provides the true average growth rate per period. This is particularly relevant in finance because it reflects the cumulative effect of returns and losses over time. Options B, C, and D are incorrect: the geometric mean is more complex to calculate than the arithmetic mean, does not inflate returns, and incorporates all returns (both gains and losses) in its calculation.
Question 2
Which of the following ratios is most appropriate for measuring an investment’s excess return per unit of total risk?
A) Treynor Ratio
B) Sortino Ratio
C) Sharpe Ratio
D) Coefficient of Variation
Answer: C) Sharpe Ratio
Explanation: The Sharpe Ratio measures an investment’s excess return (over the risk-free rate) per unit of total risk, where risk is represented by standard deviation. This ratio is widely used to assess risk-adjusted performance, as it captures both upside and downside volatility. The Treynor Ratio (option A) measures return relative to systematic risk (beta), making it more suitable when evaluating portfolios relative to the market. The Sortino Ratio (option B) focuses only on downside risk, useful for investments where investors are more concerned about avoiding losses than capturing volatility. The Coefficient of Variation (option D) is used for comparing risk per unit of return across assets but does not account for excess return or a risk-free rate.
Question 3
If two assets have a correlation coefficient of -0.8, what does this indicate about their relationship?
A) The assets move in the same direction, with high positive correlation.
B) The assets have no linear relationship, showing correlation close to zero.
C) The assets have a strong negative relationship, moving in opposite directions.
D) The assets’ returns have no impact on each other due to market independence.
Answer: C) The assets have a strong negative relationship, moving in opposite directions.
Explanation: A correlation coefficient of -0.8 indicates a strong negative relationship between the two assets, meaning that when one asset’s return increases, the other’s tends to decrease, and vice versa. This inverse relationship is valuable for diversification, as including negatively correlated assets in a portfolio can reduce overall risk. Option A is incorrect because positive correlation would have a positive value closer to +1. Option B is incorrect because a near-zero correlation would indicate no linear relationship. Option D is also incorrect because the correlation coefficient specifically measures the relationship between the returns of the two assets, not market independence.

