Preparing for the CFA Exam requires proficiency in “Parametric and Non-Parametric Tests of Independence,” which involve statistical tests to determine if there is a significant association between variables. Key topics include t-tests, chi-square tests, Fisher’s exact test, and Mann-Whitney U test. Mastery of these concepts enables candidates to evaluate relationships within financial data, assess market trends, and make informed decisions, all of which are essential for success on the CFA Exam.
Learning Objectives
In studying “Parametric and Non-Parametric Tests of Independence” for the CFA exam, you should learn to understand the statistical tests that allow analysts to evaluate relationships between variables without assuming a specific distribution. This area includes parametric tests, like the Pearson correlation test, which assumes a normal distribution, and non-parametric tests, like the chi-square test and Spearman’s rank correlation, which do not require such assumptions. Key topics include choosing the appropriate test based on data characteristics, interpreting test outcomes, and applying these methods to evaluate market trends, investor behavior, and economic factors. Mastery of these concepts will enable you to analyze dependencies within financial data, helping you make informed decisions in portfolio management and risk assessment.
What Are Parametric and Non-Parametric Tests of Independence?
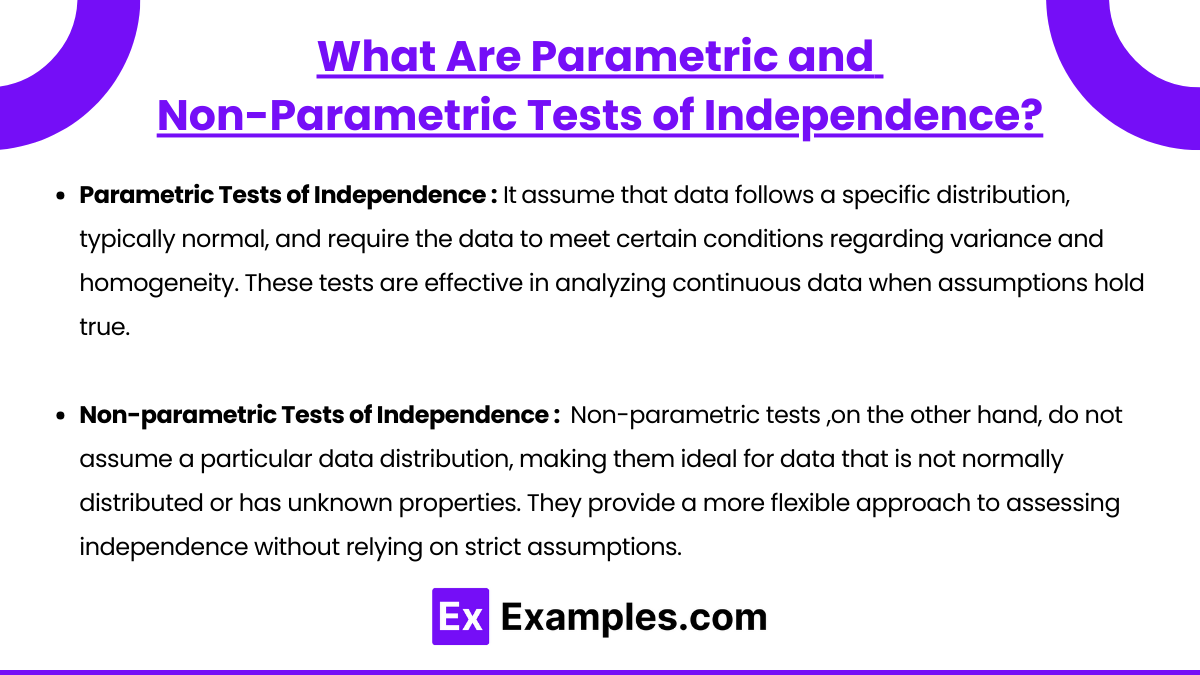
Parametric tests of independence assume that data follows a specific distribution, typically normal, and require the data to meet certain conditions regarding variance and homogeneity. These tests are effective in analyzing continuous data when assumptions hold true.
Non-parametric tests, on the other hand, do not assume a particular data distribution, making them ideal for data that is not normally distributed or has unknown properties. They provide a more flexible approach to assessing independence without relying on strict assumptions.
Key Parametric Tests of Independence
Parametric tests are generally more powerful but depend on assumptions about the population’s distribution, such as normality.
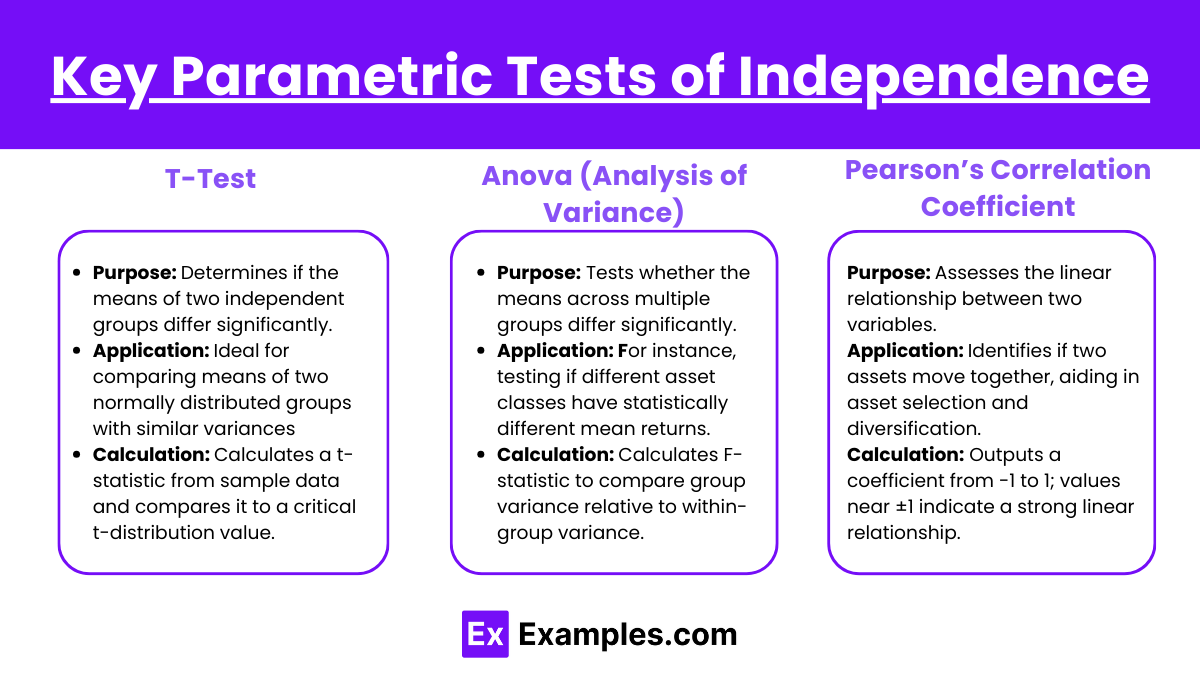
T-Test
- Purpose: Assesses if the means of two independent groups are significantly different.
- Application: Useful when comparing the means of two normally distributed groups with similar variances, such as stock returns for two different industries.
- Calculation: Uses sample data to calculate a t-statistic, which is compared against a critical value from the t-distribution.
ANOVA (Analysis of Variance)
- Purpose: Tests whether the means across multiple groups differ significantly.
- Application: For instance, testing if different asset classes have statistically different mean returns.
- Calculation: Calculates F-statistic to compare group variance relative to within-group variance.
Pearson’s Correlation Coefficient
- Purpose: Measures the linear relationship between two variables.
- Application: Determines if two assets move together, helping in asset selection and portfolio diversification.
- Calculation: Provides a coefficient between -1 and 1, with values near ±1 indicating a strong linear relationship.
Key Non-Parametric Tests of Independence
Non-parametric tests are particularly valuable for data not meeting parametric assumptions, such as ordinal data or non-normally distributed data.
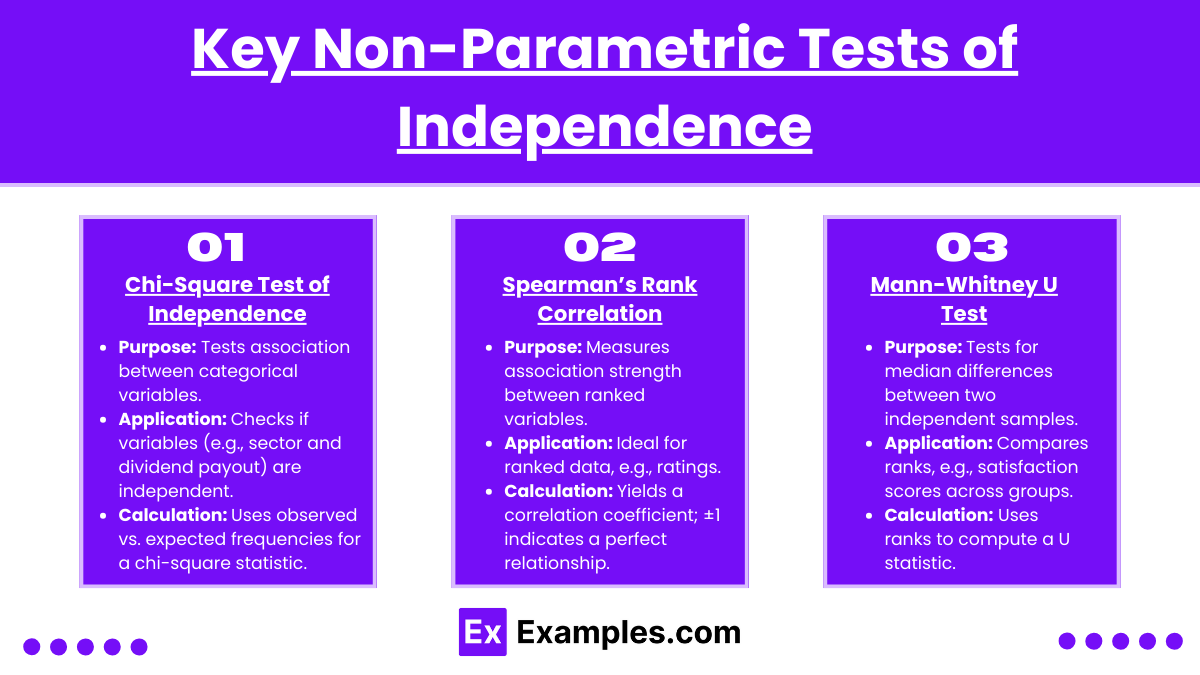
Chi-Square Test of Independence
- Purpose: Evaluates whether there’s an association between two categorical variables.
- Application: For example, examining whether sector and dividend payout ratio are independent.
- Calculation: Compares observed frequency distribution to expected frequencies, producing a chi-square statistic.
Spearman’s Rank Correlation
- Purpose: Measures the strength and direction of association between two ranked variables.
- Application: Suitable for ranked data, such as ratings or ordinal investment metrics.
- Calculation: Ranks data values and calculates a correlation coefficient, with ±1 indicating a perfect monotonic relationship.
Mann-Whitney U Test
- Purpose: Tests for differences between two independent samples, based on ranks rather than actual values.
- Application: Useful when comparing medians of two groups, such as investor satisfaction scores across two investment types.
- Calculation: Assigns ranks to combined data and calculates a U statistic to assess median differences.
Choosing Between Parametric and Non-Parametric Tests
- Data Type: Use parametric tests for continuous, normally distributed data; use non-parametric tests for ordinal data or when normality cannot be assumed.
- Sample Size: Parametric tests generally require larger samples to ensure accuracy, whereas non-parametric tests are more flexible with smaller samples.
- Data Distribution: If data is not normally distributed, non-parametric tests provide a safer alternative as they don’t rely on distributional assumptions.
Examples
Example 1. Evaluating Treatment Effects in Medical Research
In clinical studies, researchers often need to evaluate the independence between treatment types and patient outcomes. By applying parametric tests, such as the Pearson Chi-square test, or non-parametric tests like the Fisher’s Exact Test, researchers can determine if different treatment methods lead to significantly different outcomes, independent of other factors. This approach is especially relevant when sample sizes are small or when assumptions of normality may not be met.
Example 2. Analyzing Customer Preferences in Market Research
Market researchers use tests of independence to assess relationships between customer demographics (age, income) and product preference. For instance, a company might apply a parametric test if assumptions hold, or a non-parametric test, like the Mann-Whitney U test, to evaluate if product preferences vary significantly between different demographic groups. This analysis helps businesses understand whether certain products are favored by specific customer segments, aiding in targeted marketing strategies.
Example 3. Assessing Educational Program Effectiveness
In educational research, independence tests are valuable for analyzing the effectiveness of various teaching methods on student performance. Researchers may use parametric tests like ANOVA when data distributions are normal or switch to non-parametric tests, such as the Kruskal-Wallis test, when assumptions aren’t met. These tests help determine if certain teaching approaches yield independently different outcomes across different groups of students.
Example 4. Investigating Environmental Impact Factors
Environmental scientists may investigate if pollution levels vary independently across different regions by employing parametric tests, like correlation tests for normally distributed variables, or non-parametric tests, such as Spearman’s rank correlation. These tests are essential when analyzing whether regional environmental conditions (like proximity to industrial areas) correlate independently with pollutant concentration, regardless of other variables.
Example 5. Evaluating Quality Control in Manufacturing
Quality control analysts in manufacturing may apply independence tests to ensure that factors like production time or equipment used are independent of defect rates. Parametric tests like Pearson’s correlation coefficient or non-parametric tests such as Kendall’s tau are used to check if certain production variables consistently lead to different defect rates. This process is key for maintaining consistent quality and identifying potential areas for improvement in the manufacturing process.
Practice Questions
Question 1
Which of the following is a parametric test commonly used to assess the independence of two variables?
A) Chi-Square Test
B) Spearman’s Rank Correlation
C) Pearson’s Correlation Coefficient
D) Mann-Whitney U Test
Answer: C) Pearson’s Correlation Coefficient
Explanation:
Pearson’s Correlation Coefficient is a parametric test used to measure the linear relationship between two continuous variables. It assumes that the data is normally distributed and that there is a linear relationship between the variables. This makes it suitable as a parametric test of independence for assessing if there is a correlation between two variables. The Chi-Square Test (A) is a non-parametric test used for categorical data, Spearman’s Rank Correlation (B) is a non-parametric alternative to Pearson’s for ordinal data or non-normal distributions, and the Mann-Whitney U Test (D) is a non-parametric test used to compare two independent samples.
Question 2
In which scenario would a non-parametric test of independence, such as the Chi-Square Test, be more appropriate than a parametric test?
A) When comparing the means of two normally distributed variables
B) When testing for a relationship between two ordinal variables
C) When assessing the correlation between two continuous, normally distributed variables
D) When the data is paired and normally distributed
Answer: B) When testing for a relationship between two ordinal variables
Explanation:
The Chi-Square Test is a non-parametric test of independence best used when analyzing categorical or ordinal data where parametric assumptions, such as normality, do not hold. Option B describes a scenario where the Chi-Square Test would be suitable as it can test for an association between ordinal variables. In contrast, parametric tests typically require interval or ratio data with a normal distribution, making options A, C, and D scenarios where parametric tests like t-tests or Pearson’s correlation would be more appropriate.
Question 3
Which of the following statements is TRUE about non-parametric tests of independence?
A) Non-parametric tests assume a normal distribution.
B) Non-parametric tests require homogeneity of variance.
C) Non-parametric tests are more flexible with fewer assumptions than parametric tests.
D) Non-parametric tests are always more powerful than parametric tests.
Answer: C) Non-parametric tests are more flexible with fewer assumptions than parametric tests.
Explanation:
Non-parametric tests, such as the Chi-Square Test and Spearman’s Rank Correlation, are often used because they do not require assumptions about the distribution of the data (e.g., normality or homogeneity of variance). This makes them more flexible and suitable for data that do not meet the assumptions required by parametric tests. Option A is incorrect because non-parametric tests do not assume a normal distribution, B is incorrect because they do not require homogeneity of variance, and D is incorrect because non-parametric tests are not necessarily more powerful than parametric tests; in fact, parametric tests are typically more powerful when their assumptions are met.

