Preparing for the CFA Exam demands a deep understanding of Fixed-Income Bond Valuation, focusing on prices and yields. Mastery of bond pricing techniques, yield calculations, and their relationship is crucial. This knowledge equips candidates with the ability to assess investment value and risk, vital for excelling in the finance sector.
Learning Objective
In studying “Fixed-Income Bond Valuation: Prices and Yields” for the CFA Exam, you should aim to understand the fundamental principles of bond valuation, including the calculation of present value and yield to maturity. Explore the impact of interest rates, inflation, and credit risk on bond prices and yields. Learn to apply various yield measures such as spot rates, forward rates, and yield to call in different market scenarios. Develop skills in interpreting yield curves and their implications for bond trading strategies. Equip yourself to analyze bond risks and returns effectively, enhancing your ability to make informed investment decisions.
Bond Valuation Principles
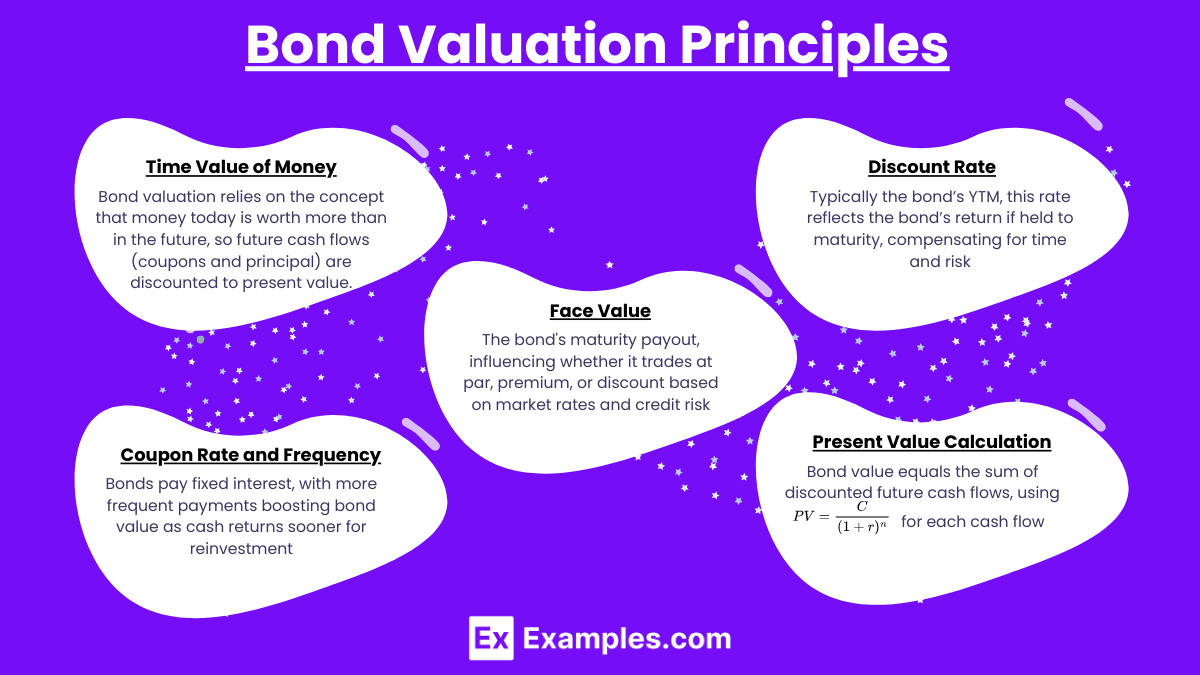
Bond valuation fundamentally revolves around calculating the present value of expected future cash flows, which typically include periodic coupon payments and the principal repayment at maturity. This process uses a discount rate that reflects the risk profile of the bond, where the discount rate is often equivalent to the bond’s yield to maturity (YTM). Here’s a breakdown of the core principles:
- Time Value of Money: The valuation of bonds is heavily influenced by the concept of the time value of money, which asserts that money available at the present time is worth more than the same amount in the future due to its potential earning capacity. This principle is crucial because it dictates that future cash flows (coupons and final principal repayment) must be discounted to reflect their value in present terms.
- Discount Rate: The choice of discount rate is critical in bond valuation. It generally reflects the bond’s YTM, which is the internal rate of return (IRR) on the bond’s cash flows assuming the bond is held to maturity. This rate compensates investors for the time value of money and the risk assumed over the period.
- Coupon Rate and Frequency: Bonds typically pay interest at a fixed rate known as the coupon rate, and the frequency of these payments (annually, semi-annually, quarterly) impacts the valuation. The more frequent the coupon payment, the higher the bond’s value, due to the earlier return of cash to bondholders, which can be reinvested sooner.
- Face Value: The face value or par value of a bond is the amount paid to the bondholder at maturity. Bond prices can be quoted as a percentage of face value. Market interest rates and the bond’s credit risk influence whether bonds sell at a discount (below face value), at par (at face value), or at a premium (above face value).
- Calculation of Present Value: The present value of each future cash flow is calculated using the formula
 where C is the cash flow, r is the discount rate (YTM), and n is the number of periods until the payment. The bond’s value is the sum of the present values of all future cash flows, including both the coupon payments and the final principal repayment.
By mastering these principles, CFA candidates can effectively determine the intrinsic value of bonds, assess their attractiveness as investments, and make informed decisions in the fixed-income market
Yield Measures and Their Applications
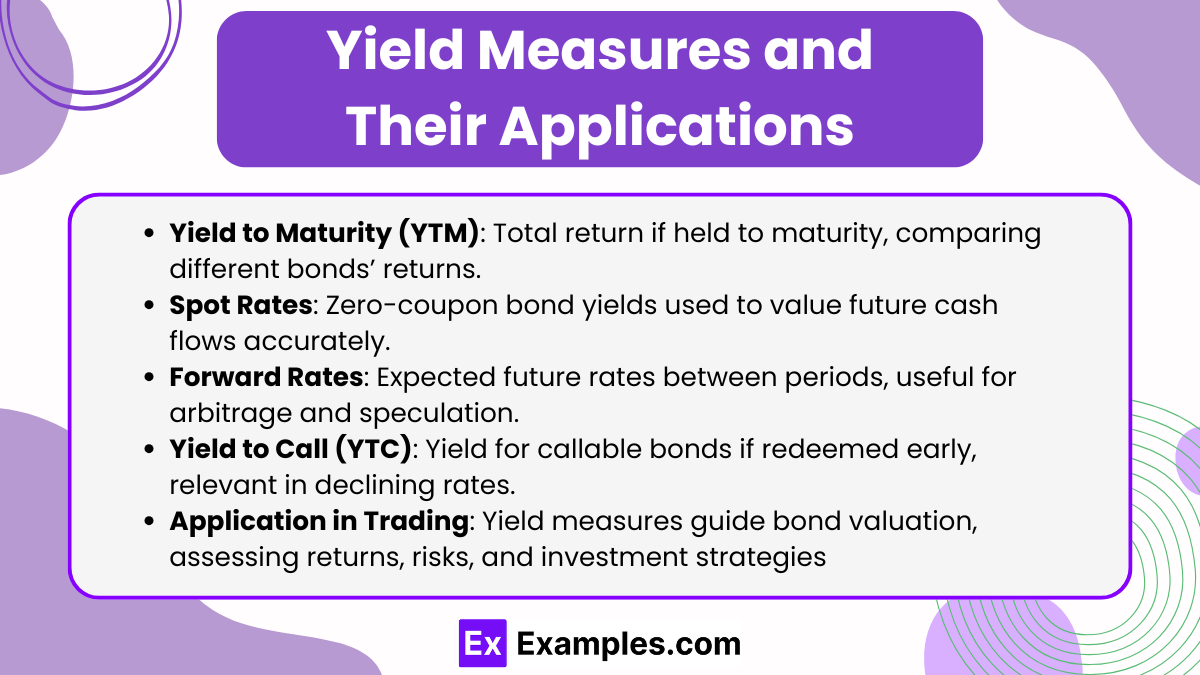
Yield measures are essential for evaluating the returns on bonds and their attractiveness as investment options. Each yield measure provides unique insights into different aspects of bond investment, and understanding these can significantly enhance an investor’s ability to make informed decisions. Here’s a detailed look at key yield measures and their applications:
- Yield to Maturity (YTM): YTM is the most comprehensive yield measure, indicating the total return an investor will receive if the bond is held to maturity and all payments are made as scheduled. It considers the bond’s current price, its face value, coupon payments, and the time remaining until maturity. It’s commonly used for comparing the return on bonds with different maturities and coupon rates.
- Spot Rates: A spot rate is the yield on a zero-coupon bond that pays no interest but is sold at a discount to its face value. It reflects the interest rate for a particular maturity. Using spot rates, investors can build a spot rate curve to determine the present value of a bond’s future cash flows based purely on these rates, which can provide a more accurate bond valuation than YTM alone.
- Forward Rates: Derived from spot rates, forward rates represent the expected future interest rate between two periods within the bond’s life. They are crucial for identifying arbitrage opportunities and for speculative purposes where investors predict interest rate movements and position their bond holdings accordingly.
- Yield to Call (YTC): For bonds with a callable feature, YTC is an important yield measure. It calculates the yield assuming the bond will be redeemed by the issuer before its maturity date at a predefined call price. This yield is particularly relevant for bonds in a declining interest rate environment where the risk of the bond being called away is higher.
- Application in Bond Valuation and Trading: These yield measures are critical tools in both bond valuation and trading. They help investors understand not just the return they are likely to achieve, but also the risks involved with different bond investments. For instance, comparing the YTM and YTC can inform investors about potential returns in scenarios where the bond is either held to maturity or called early. Similarly, spot and forward rates are instrumental for those focusing on pure interest rate plays or constructing laddered bond portfolios to manage interest rate risk
Impact of Interest Rates on Bond Valuation
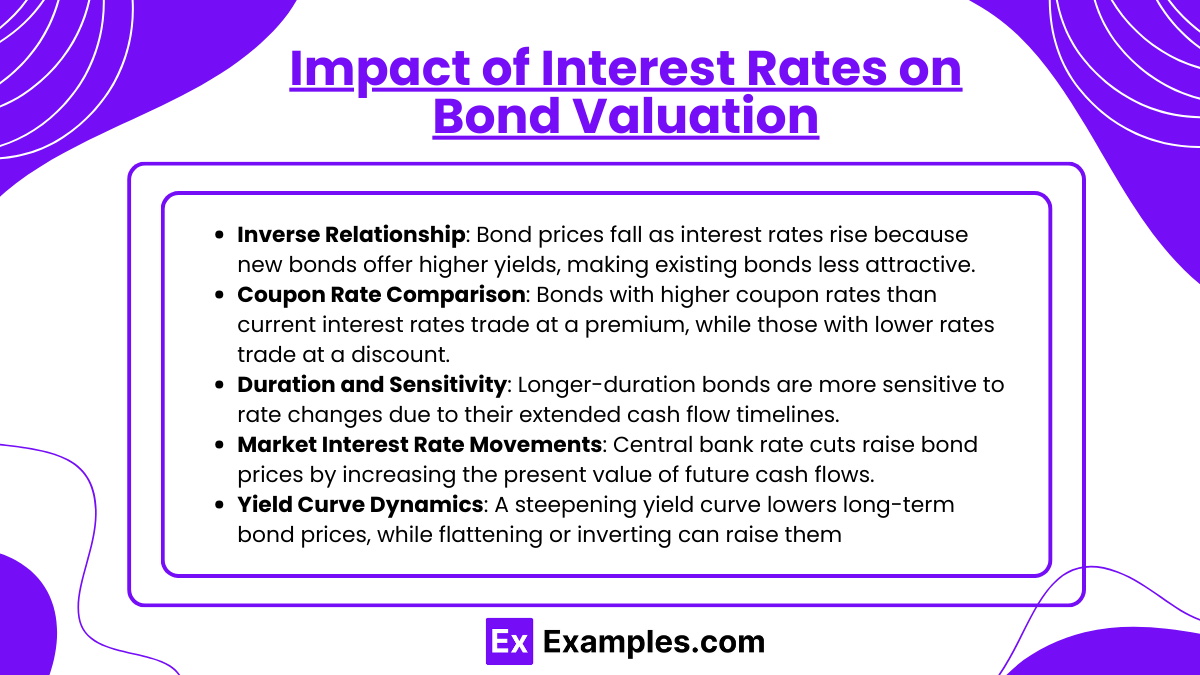
Interest rates are a fundamental determinant of bond valuation, influencing their pricing and yield dynamics in the fixed-income market. Understanding how interest rates affect bond values is crucial for investors, especially in assessing risk and return profiles. Here’s a focused explanation of this impact:
- Inverse Relationship: Bond prices and interest rates have an inverse relationship. When interest rates rise, bond prices fall, and vice versa. This is because the fixed cash flows from a bond (coupon payments) become less attractive when new bonds are issued with higher yields due to increased rates.
- Coupon Rate Comparison: If the coupon rate of a bond is higher than the prevailing interest rates, the bond will likely trade at a premium because its payments are more attractive compared to new issues. Conversely, if the coupon rate is lower than current interest rates, the bond will trade at a discount.
- Duration and Sensitivity: The duration of a bond measures its sensitivity to changes in interest rates. Longer-duration bonds are more sensitive to interest rate changes because their cash flows are spread out over a longer period, making them more susceptible to fluctuations in the discount rate used in present value calculations.
- Market Interest Rate Movements: The general movement of market interest rates, often influenced by central bank policies and economic conditions, plays a significant role in bond valuation. For instance, when a central bank lowers rates to stimulate the economy, bond prices generally rise as the present value of their future cash flows increases due to the lower discount rates.
- Yield Curve Dynamics: The shape of the yield curve, which plots interest rates against different maturities, also affects bond valuation. A steepening yield curve suggests rising long-term interest rates, which can lead to lower prices for long-term bonds. Conversely, a flattening or inverted yield curve suggests lower long-term rates, potentially increasing the prices of these bonds
Analysis of Yield Curves
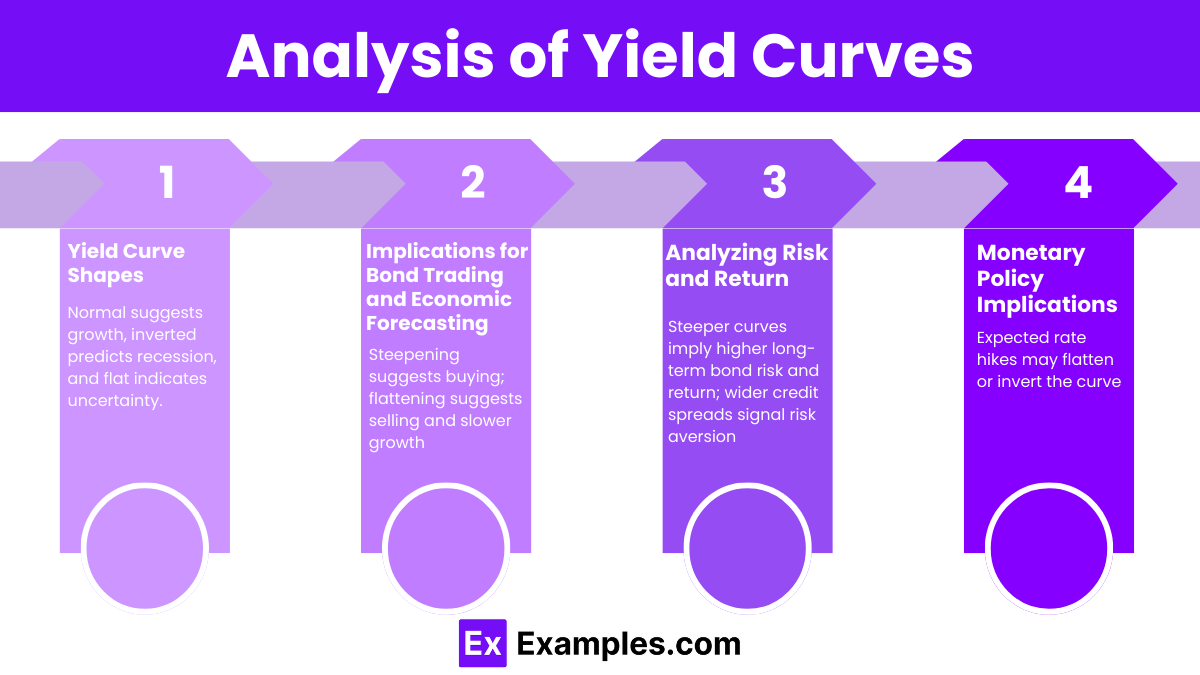
Yield curves are graphical representations that show the relationship between interest rates and bonds of different maturities under the same credit quality, typically government securities. They are a fundamental tool in financial analysis for predicting economic conditions and determining bond valuation. Here’s a detailed look at the key aspects of yield curve analysis:
- Yield Curve Shapes:
- Normal Yield Curve: A normal or upward-sloping yield curve indicates that longer-term interest rates are higher than short-term rates. This shape suggests economic expansion, as investors demand higher yields for longer maturities due to the anticipation of rising inflation and stronger economic growth.
- Inverted Yield Curve: An inverted or downward-sloping yield curve occurs when long-term rates are lower than short-term rates. It is often seen as a predictor of economic recession. Investors may expect lower inflation or even deflation, prompting them to accept lower yields for longer maturities.
- Flat Yield Curve: A flat yield curve indicates that short-term and long-term rates are very close to each other. This condition can occur during transitions between economic cycles or when the market is uncertain about future economic growth and inflation.
- Implications for Bond Trading and Economic Forecasting:
- Bond Trading Strategies: The shape of the yield curve influences bond trading strategies. For example, a steepening curve suggests it may be beneficial to buy long-term bonds to capitalize on rising yields and prices, while a flattening curve might prompt selling long-term bonds to avoid depreciation.
- Economic Forecasting: Financial analysts use changes in the yield curve to forecast changes in economic conditions. A sudden flattening can indicate that the market anticipates slower economic growth, whereas a steepening curve might suggest expectations of accelerated economic activity.
- Analyzing Risk and Return:
- Interest Rate Risk: The yield curve provides insights into the interest rate risk associated with different maturities. A steeper curve can indicate higher risk and potentially higher returns for long-term investments compared to short-term bonds.
- Credit Spread Analysis: Analysts also examine the spread between yields on corporate bonds and similar maturity government bonds. An expanding spread can indicate increasing risk aversion or worsening economic outlook, affecting bond valuation and investment strategies.
- Monetary Policy Implications:
- Central Bank Policies: Yield curves are also a reflection of monetary policy expectations. For example, if the market anticipates that the central bank will raise interest rates, the short end of the curve might rise faster than the long end, potentially flattening or even inverting the curve depending on the expectations for future economic activity
Examples
Example 1: Calculating Bond Prices with a Flat Yield Curve
Suppose a 5-year bond with a face value of $1,000 pays an annual coupon of 5%. Assume the current yield for all maturities is 5%. The bond price can be calculated as follows:
![]()
Example 2: Impact of Interest Rate Increase on Bond Prices
Consider a bond with a face value of $1,000, a 5% coupon rate, and 10 years to maturity. If interest rates increase from 5% to 6%, the new price of the bond is calculated by discounting the bond’s future cash flows at the new rate:
![]()
Example 3: Yield to Maturity Calculation
A bond with a current market price of $950, a face value of $1,000, a coupon rate of 7%, and 5 years remaining until maturity. To find the YTM, which is the rate that equates the present value of future cash flows to the current price:
![]()
Example 4: Calculating Yield to Call
Assume a callable bond with a face value of $1,000, a coupon rate of 6%, callable in 5 years at $1,050, and 10 years to maturity. If the bond is currently priced at $1,100, the yield to call (YTC) is the rate that equates the present value of future cash flows until the call date to the current price:
![]()
Example 5: Effects of a Steepening Yield Curve
Imagine a bond portfolio consisting of various maturities. If the yield curve steepens, meaning that long-term rates increase more than short-term rates, the value of longer-maturity bonds in the portfolio will decrease more compared to shorter-maturity bonds. The overall portfolio value might decrease, but the impact will depend on the duration and yield characteristics of the individual bonds.
Practice Questions
Question 1
What impact does a decrease in market interest rates have on the price of a bond holding all other factors constant?
A) The price of the bond decreases
B) The price of the bond increases
C) The price of the bond remains unchanged
D) The price of the bond initially increases, then decreases
Answer: B) The price of the bond increases
Explanation:
Bond prices and interest rates have an inverse relationship. When market interest rates decrease, the present value of a bond’s future cash flows (coupons and principal) increases, leading to an increase in the bond’s price.
Question 2
Which yield measure is most relevant for a bond with a callable feature that the issuer may redeem before its maturity?
A) Yield to Maturity (YTM)
B) Yield to Call (YTC)
C) Current Yield
D) Yield to Worst (YTW)
Answer: B) Yield to Call (YTC)
Explanation:
Yield to Call (YTC) is crucial for callable bonds as it calculates the returns on the bond assuming it will be called (redeemed) by the issuer before it reaches maturity. This measure provides investors with a more accurate estimate of returns in scenarios where the bond may not be held to its full term.
Question 3
How would a flat yield curve affect a strategy involving buying long-term bonds and selling short-term bonds?
A) It would increase the profitability of the strategy.
B) It would decrease the profitability of the strategy.
C) It would have no impact on the profitability of the strategy.
D) It would only be profitable if interest rates decrease further.
Answer: B) It would decrease the profitability of the strategy.
Explanation:
A flat yield curve indicates little difference in yield between short-term and long-term bonds. This situation minimizes the benefit of a “buy long, sell short” strategy as the typical yield advantage of long-term bonds over short-term bonds, which can generate arbitrage profit, diminishes

