Financial Statement Analysis is the process of reviewing and evaluating a company’s financial reports to assess its financial health, profitability, and future potential. By examining key statements like the balance sheet, income statement, and cash flow statement, analysts can gain insights into the company’s performance, liquidity, and operational efficiency. This analysis aids investors, creditors, and other stakeholders in making informed decisions by providing a clearer picture of financial stability, risks, and growth prospects, essential for strategic planning and investment evaluation.
Learning Objectives
In studying “Financial Statement Analysis: Introduction to Financial Statement Analysis” for the CFA Exam, you should learn to understand the primary financial statements—balance sheet, income statement, and cash flow statement—and their interrelationships. Analyze how these statements provide insights into a company’s financial position, performance, and cash flows. Evaluate the importance of tools like ratio analysis, vertical analysis, and horizontal analysis in assessing profitability, liquidity, and solvency. Additionally, explore how these techniques aid in identifying trends, making investment and credit decisions, and assessing financial health. Apply your understanding to interpreting and analyzing financial data in CFA-style scenarios.
Purpose of Financial Statement Analysis

The primary goal of FSA is to provide insights into a company’s financial health. It helps stakeholders assess profitability, liquidity, solvency, and operational efficiency. Financial statement analysis is crucial for:
- Investment Decisions: Understanding if the company is a viable investment.
- Credit Decisions: Determining a company’s ability to repay debt.
- Internal Assessment: Enabling management to evaluate performance and operational efficiency.
Key Financial Statements

- Balance Sheet: Shows a company’s financial position at a specific point in time, detailing assets, liabilities, and equity. It follows the equation: Assets = Liabilities + Equity.
- Income Statement: Reports revenue, expenses, and profit over a period, providing insight into a company’s profitability and performance.
- Cash Flow Statement: Breaks down cash inflows and outflows into three activities—operating, investing, and financing—helping assess liquidity and cash management.
Types of Financial Analysis

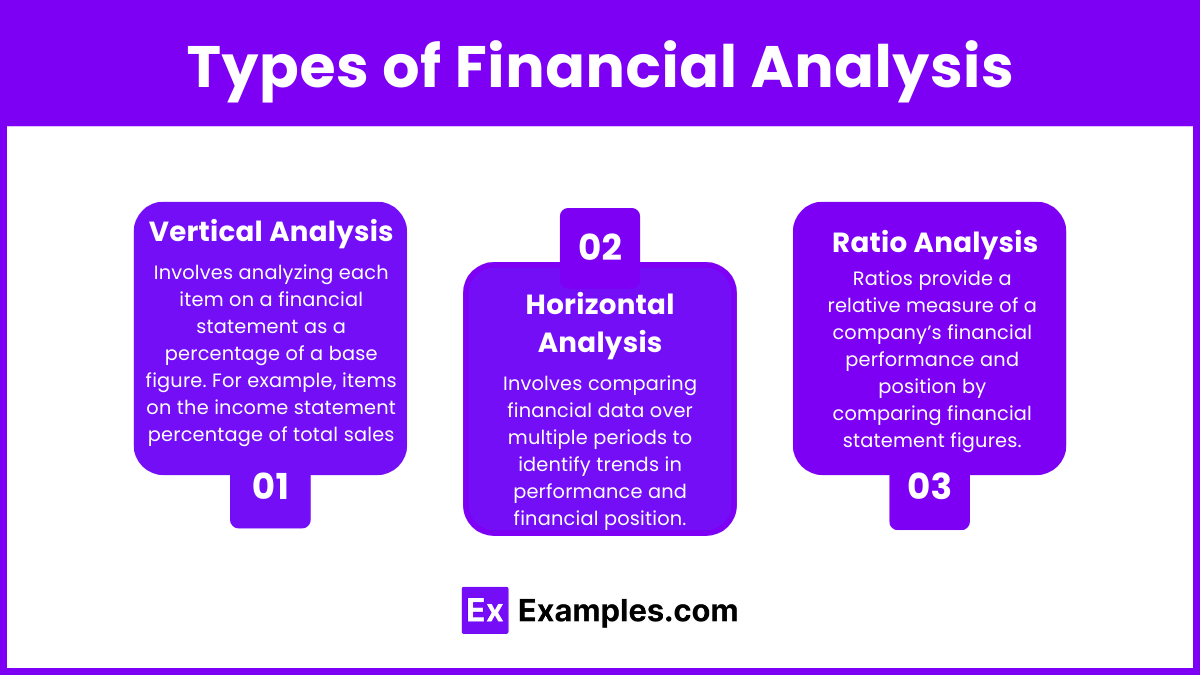
- Vertical Analysis: Involves analyzing each item on a financial statement as a percentage of a base figure. For example, items on the income statement are analyzed as a percentage of total sales, while balance sheet items are analyzed as a percentage of total assets.
- Horizontal Analysis: Involves comparing financial data over multiple periods to identify trends in performance and financial position. This is especially useful in identifying growth rates in revenue, expenses, and profit.
- Ratio Analysis: Ratios provide a relative measure of a company’s financial performance and position by comparing financial statement figures. Key ratios include:
- Liquidity Ratios (e.g., Current Ratio, Quick Ratio): Assess the ability to meet short-term obligations.
- Profitability Ratios (e.g., Return on Equity, Gross Margin): Evaluate the company’s ability to generate profit.
- Solvency Ratios (e.g., Debt-to-Equity Ratio): Examine long-term financial stability.
- Efficiency Ratios (e.g., Asset Turnover Ratio): Indicate how well assets are being utilized.
Techniques in Financial Statement Analysis

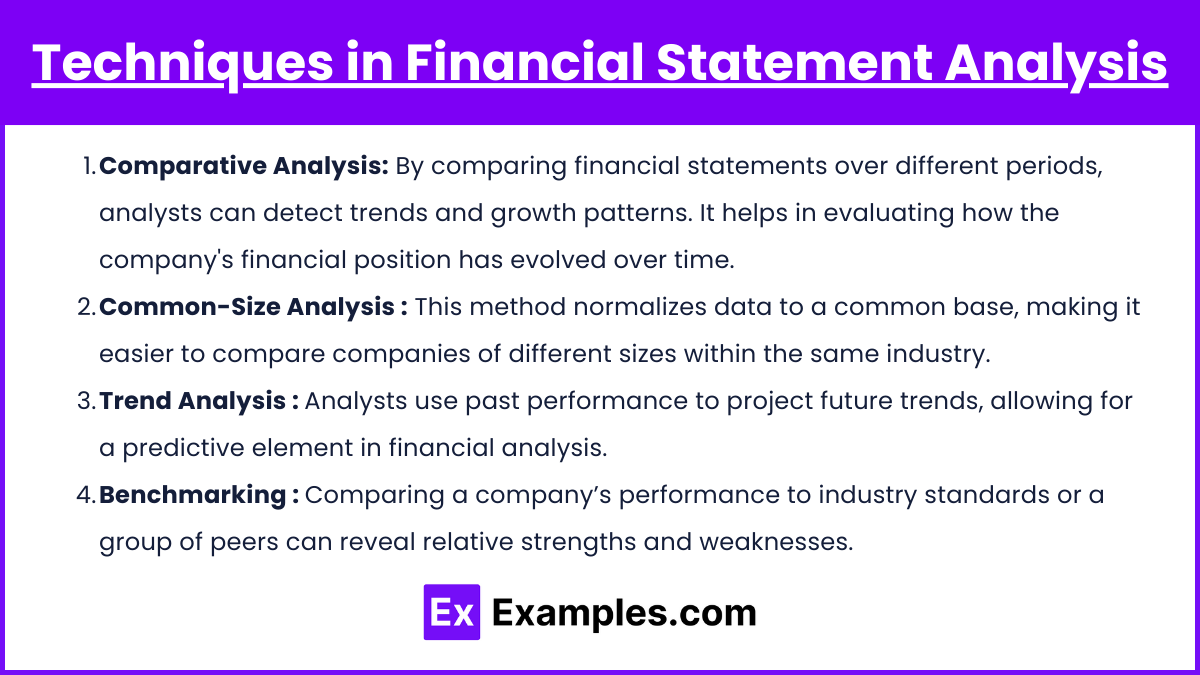
- Comparative Analysis: By comparing financial statements over different periods, analysts can detect trends and growth patterns. It helps in evaluating how the company’s financial position has evolved over time.
- Common-Size Analysis: This method normalizes data to a common base, making it easier to compare companies of different sizes within the same industry.
- Trend Analysis: Analysts use past performance to project future trends, allowing for a predictive element in financial analysis.
- Benchmarking: Comparing a company’s performance to industry standards or a group of peers can reveal relative strengths and weaknesses.
Limitations of Financial Statement Analysis

Despite its importance, FSA has limitations, including:
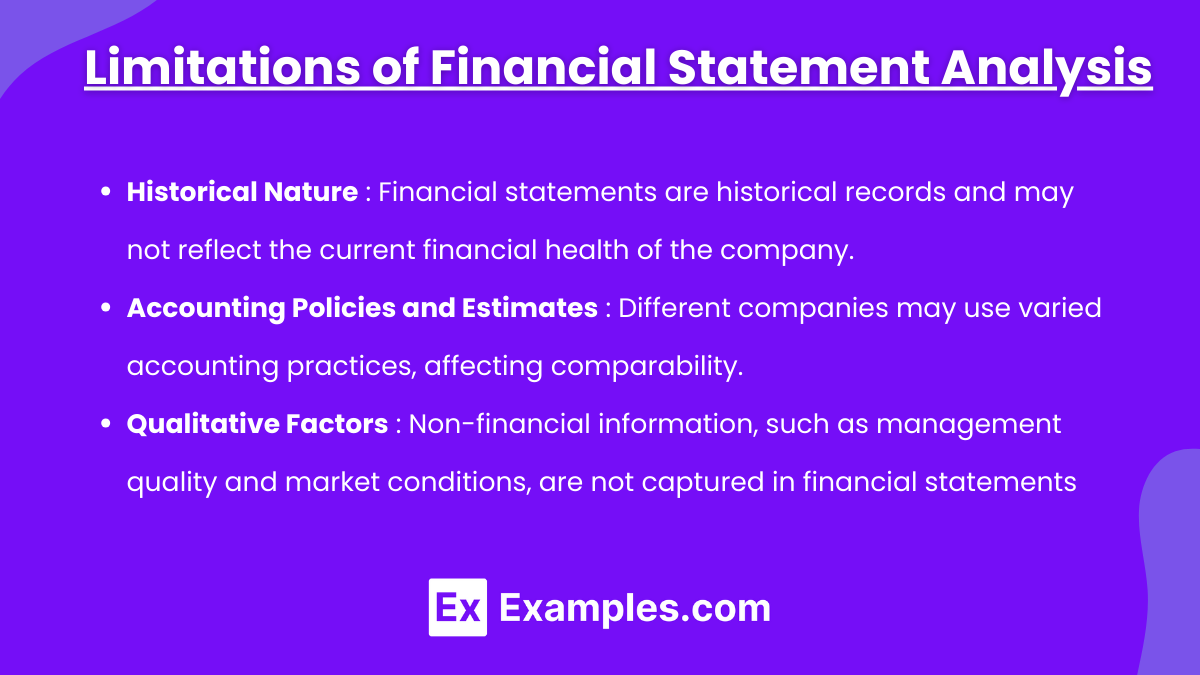
- Historical Nature: Financial statements are historical records and may not reflect the current financial health of the company.
- Accounting Policies and Estimates: Different companies may use varied accounting practices, affecting comparability.
- Qualitative Factors: Non-financial information, such as management quality and market conditions, are not captured in financial statements.
Examples
Example 1: Evaluating Profitability Using the Income Statement
An analyst reviews a company’s income statement to assess its profitability. By comparing revenue, cost of goods sold, and operating expenses over multiple periods, the analyst calculates key profitability ratios, such as the Gross Profit Margin and Net Profit Margin. These ratios reveal how efficiently the company generates profit from its revenue. For instance, if the gross profit margin improves consistently, it suggests effective cost control or improved pricing strategies, essential insights for potential investors and creditors.
Example 2: Assessing Liquidity Through the Balance Sheet
Liquidity analysis is crucial for understanding a company’s short-term financial health. Using the balance sheet, an analyst examines current assets (like cash, receivables, and inventory) relative to current liabilities. Calculating the Current Ratio (Current Assets ÷ Current Liabilities) and Quick Ratio (Cash and Receivables ÷ Current Liabilities) helps determine whether the company can meet its immediate obligations. For example, a high quick ratio may indicate a strong liquidity position, meaning the company can readily cover its liabilities without selling inventory, thus making it attractive for short-term creditors.
Example 3: Analyzing Solvency with Debt Ratios
To assess long-term financial stability, an analyst examines the debt structure using ratios like the Debt-to-Equity Ratio (Total Debt ÷ Total Equity) and the Interest Coverage Ratio (Operating Income ÷ Interest Expense). High levels of debt relative to equity may suggest a riskier financial position, as excessive leverage could lead to difficulties in meeting long-term obligations. In this example, an analyst might conclude that a company with a high debt-to-equity ratio needs to focus on debt reduction strategies to avoid solvency issues, providing crucial information for both investors and lenders.
Example 4: Using Cash Flow Analysis to Understand Liquidity and Cash Generation
An analyst reviews the Cash Flow Statement to understand how effectively a company generates cash. They focus on Operating Cash Flow (cash generated from core business operations) to assess whether it is sufficient to cover capital expenditures, debt repayment, and dividends. For instance, if a company consistently shows positive cash flows from operations while maintaining stable cash reserves, it indicates robust liquidity management and financial stability, even if profits fluctuate. This insight is valuable for assessing the company’s ability to withstand economic downturns.
Example 5: Identifying Trends Through Horizontal Analysis
Horizontal analysis involves comparing financial data across multiple periods to identify trends. For example, an analyst might compare annual sales, expenses, and net income over a five-year period. If sales show steady growth but operating expenses increase disproportionately, it could indicate operational inefficiencies. Conversely, a consistent upward trend in net income suggests strong performance, which is attractive for potential investors. This method provides a longitudinal view of financial performance, helping analysts anticipate future growth or identify potential areas for cost control.
Practice Questions
Question 1
An analyst calculates the current ratio and quick ratio for a company and finds that the current ratio is significantly higher than the quick ratio. What could be the primary reason for this difference?
A) The company has a large amount of cash on hand.
B) The company has a significant amount of inventory.
C) The company has substantial short-term debt.
D) The company has high accounts receivable.
Answer: B) The company has a significant amount of inventory.
Explanation: The current ratio (Current Assets ÷ Current Liabilities) includes all current assets, such as cash, accounts receivable, and inventory. The quick ratio (Quick Assets ÷ Current Liabilities), however, excludes inventory from the calculation, focusing only on the most liquid assets (cash and receivables). When there is a large difference between the current and quick ratios, it typically indicates that a substantial portion of the company’s current assets is tied up in inventory. Inventory is less liquid than cash or receivables, which is why it’s excluded in the quick ratio. This means the company may have sufficient current assets overall but relies heavily on inventory, which can affect short-term liquidity if inventory cannot be quickly converted to cash.
Question 2
Which of the following statements is false regarding the usefulness of the cash flow statement in financial analysis?
A) It provides information about a company’s ability to generate cash from operations.
B) It shows whether the company can cover its capital expenditures and debt repayments.
C) It helps assess the company’s profitability over a specific period.
D) It is useful in determining the sustainability of a company’s dividend payments.
Answer: C) It helps assess the company’s profitability over a specific period.
Explanation: The cash flow statement is primarily used to evaluate a company’s ability to generate cash from operating, investing, and financing activities. It does not directly measure profitability, which is instead assessed by the income statement. The cash flow statement provides insight into the liquidity and cash generation capabilities of a company rather than its profit. Options A, B, and D are true statements about the cash flow statement’s utility, as it does help determine whether the company can meet obligations, fund capital expenditures, and sustain dividend payments. However, profitability analysis is best derived from the income statement, making option C the false statement.
Question 3
If a company’s debt-to-equity ratio is rising significantly over several years, what could this indicate about the company’s financial risk?
A) The company is reducing its dependence on debt financing.
B) The company’s financial risk is likely decreasing.
C) The company is increasing its reliance on equity financing.
D) The company’s financial risk is likely increasing.
Answer: D) The company’s financial risk is likely increasing.
Explanation: The debt-to-equity ratio (Total Debt ÷ Total Equity) measures a company’s financial leverage, showing the proportion of financing that comes from debt versus equity. A rising debt-to-equity ratio suggests that the company is increasingly reliant on debt financing compared to equity. This higher reliance on debt typically increases financial risk, as the company must meet debt repayment obligations regardless of its operational performance. The company’s solvency could become a concern if it cannot generate enough income to service its debt. Therefore, a rising debt-to-equity ratio generally implies increasing financial risk, making option D the correct answer.


