Financial statement modeling is a key skill in the CFA curriculum, primarily used to project a company’s future financial performance based on historical data. This process involves building a model that integrates the income statement, balance sheet, and cash flow statement into a cohesive framework. The model serves as a critical tool for forecasting future earnings, assessing financial health, and supporting valuation decisions. Financial statement models are widely used in investment analysis, mergers and acquisitions, and corporate finance to predict performance under various scenarios. Understanding how to construct and manipulate these models is essential for both decision-making and investment strategies in the CFA framework.
Learning Objectives
In studying “Financial Statement Modeling” for the CFA, you should learn to construct and analyze financial models that integrate income statements, balance sheets, and cash flow statements. Understand the forecasting techniques for projecting revenues, expenses, capital expenditures, and working capital requirements. Analyze how assumptions on growth rates, margins, and key financial ratios impact a company’s financial outlook and valuation. Evaluate the interdependence of financial statements to ensure consistency and accuracy in modeling. Additionally, practice scenario and sensitivity analysis to assess the impact of different variables on financial outcomes, aiding in investment decision-making and risk assessment.
Constructing and Analyzing Integrated Financial Models
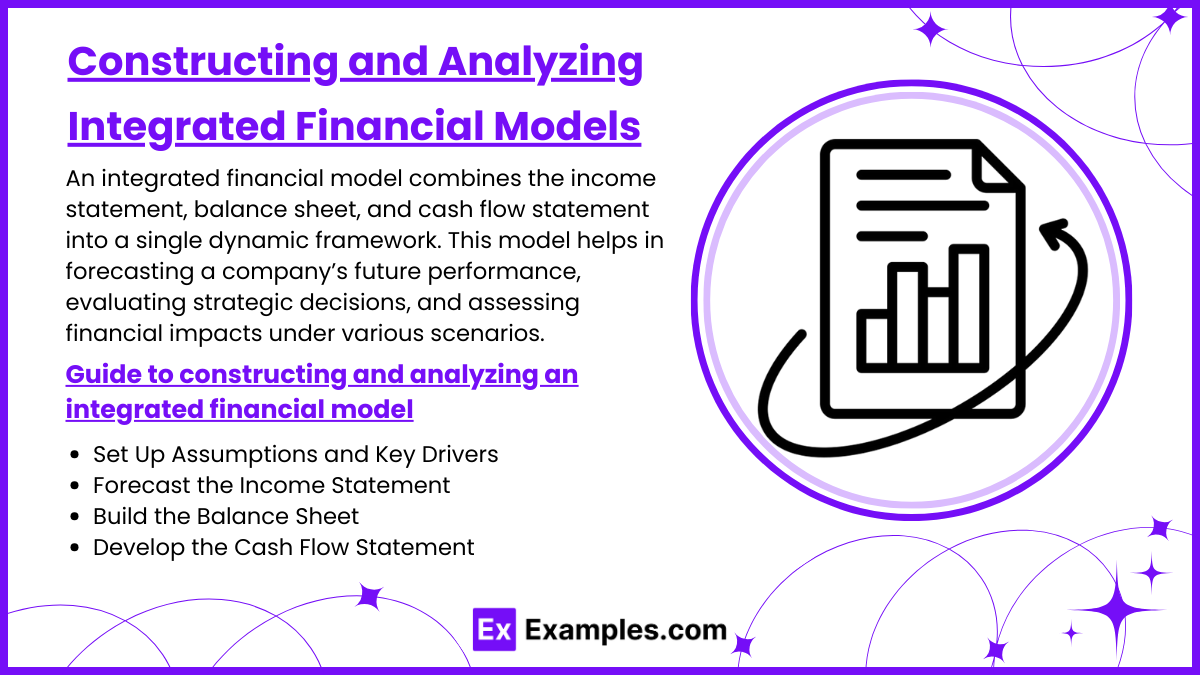
An integrated financial model combines the income statement, balance sheet, and cash flow statement into a single dynamic framework. This model helps in forecasting a company’s future performance, evaluating strategic decisions, and assessing financial impacts under various scenarios. Building an integrated model requires a structured approach, linking each financial statement and incorporating assumptions to ensure consistency and accuracy. Here’s a guide to constructing and analyzing an integrated financial model.
1. Set Up Assumptions and Key Drivers
Begin by defining the assumptions and drivers that will influence the model. These include growth rates, cost structures, working capital requirements, tax rates, and other factors impacting each financial statement.
- Revenue Growth Rate: Project revenue growth based on historical data, market conditions, or management guidance.
- Cost Assumptions: Estimate cost of goods sold (COGS) and operating expenses as a percentage of revenue or based on historical averages.
- Working Capital Drivers: Set assumptions for days sales outstanding (DSO), days payable outstanding (DPO), and inventory turnover to forecast changes in working capital.
- Capital Expenditures (CapEx): Estimate future CapEx for maintenance and growth, impacting both cash flow and the balance sheet.
- Debt and Equity Financing: Determine financing assumptions, such as interest rates on debt, repayment schedules, and potential equity issuance or buybacks.
Example: Assume revenue will grow at 5% annually, COGS will be 60% of revenue, and operating expenses will increase by 3% per year. Set DSO at 30 days and CapEx as 4% of revenue.
2. Forecast the Income Statement
Using the assumptions, forecast the income statement to project profitability over the period. Revenue projections feed into expenses, taxes, and net income.
- Revenue Projection: Start with the base-year revenue and apply the growth rate assumption to project each year’s revenue.
- COGS and Gross Profit: Calculate COGS based on the percentage of revenue, and subtract it from revenue to obtain gross profit.
- Operating Expenses and Operating Income: Apply assumptions to forecast operating expenses, yielding operating income (EBIT) after subtracting these from gross profit.
- Interest Expense and Taxes: Include interest expenses based on projected debt and adjust for the tax rate to calculate net income.
- Net Income: This final line item flows into retained earnings on the balance sheet and impacts cash flow.
Example: If revenue is projected to be $1 million in Year 1 with a 5% growth rate, revenue in Year 2 would be $1.05 million. Calculate COGS at 60% of revenue and subtract operating expenses to get net income.
3. Build the Balance Sheet
The balance sheet projections depend on net income from the income statement and cash flow from the cash flow statement. Each line item must be linked and adjusted based on assumptions.
- Assets: Forecast current assets, such as cash and accounts receivable, based on working capital assumptions. Estimate fixed assets by adjusting for CapEx and depreciation.
- Liabilities: Project accounts payable and other liabilities based on DPO or other assumptions. Include debt, factoring in repayments or new financing.
- Equity: Link retained earnings to net income from the income statement, subtracting dividends to obtain ending equity. Any new equity financing or buybacks should be reflected here.
Example: Use projected DSO to calculate accounts receivable by multiplying projected sales by DSO and dividing by 365. Adjust fixed assets each year by adding CapEx and subtracting depreciation.
4. Develop the Cash Flow Statement
The cash flow statement is divided into operating, investing, and financing activities, linking cash flow with balance sheet changes and net income.
- Operating Cash Flow: Start with net income and adjust for non-cash items (e.g., depreciation) and changes in working capital accounts like accounts receivable, inventory, and accounts payable.
- Investing Cash Flow: Reflect capital expenditures (as a cash outflow) and asset sales (if any) in this section. CapEx projections reduce cash and increase fixed assets on the balance sheet.
- Financing Cash Flow: Include cash inflows from debt or equity issuance and outflows from repayments or dividends. Changes in debt impact cash flow and liabilities on the balance sheet.
Example: If net income is $100,000 and depreciation is $10,000, add back the depreciation to calculate operating cash flow. Adjust for changes in working capital, such as an increase in accounts receivable, to reflect cash usage.
Forecasting Techniques for Revenues, Expenses, Capital Expenditures, and Working Capital
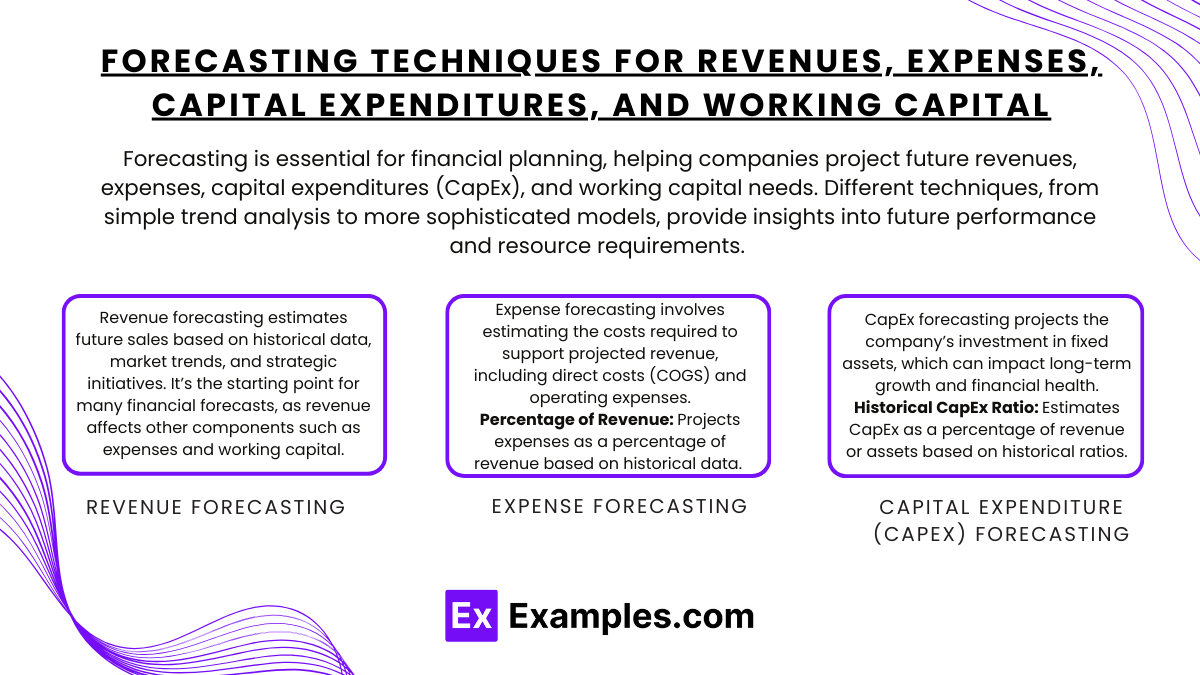
Forecasting is essential for financial planning, helping companies project future revenues, expenses, capital expenditures (CapEx), and working capital needs. Different techniques, from simple trend analysis to more sophisticated models, provide insights into future performance and resource requirements. Here’s an overview of common forecasting techniques for each component of financial projections.
1. Revenue Forecasting
Revenue forecasting estimates future sales based on historical data, market trends, and strategic initiatives. It’s the starting point for many financial forecasts, as revenue affects other components such as expenses and working capital.
- Historical Growth Analysis: Uses past revenue growth rates to project future revenue. This approach works best for stable, mature companies with consistent growth patterns.
- Example: If a company has shown consistent 5% annual revenue growth, apply this rate to forecast future revenue.
- Trend Analysis and Seasonality: Analyzes monthly or quarterly revenue patterns to account for seasonality. Useful for businesses with seasonal fluctuations, such as retail or tourism.
- Example: Retail companies often project higher sales in the holiday quarter based on past seasonal trends.
- Market and Economic Analysis: Projects revenue based on economic indicators, industry growth rates, or market share targets. This method incorporates broader economic factors, making it useful for industries impacted by economic cycles.
- Example: A construction company might forecast growth aligned with projected GDP growth and housing demand.
- Bottom-Up Approach: Builds revenue forecasts by estimating sales for individual products, services, or customer segments, then aggregating these forecasts. This approach is useful for companies with multiple revenue streams or new product launches.
- Example: A technology firm might project revenue by estimating units sold for each product line and applying average prices.
- Top-Down Approach: Starts with an overall market forecast and estimates the company’s expected market share, then scales this down to forecast revenue. Useful for companies in expanding markets or with growth initiatives.
- Example: A startup in an emerging industry could project revenue by estimating total market growth and its expected share.
2. Expense Forecasting
Expense forecasting involves estimating the costs required to support projected revenue, including direct costs (COGS) and operating expenses.
- Percentage of Revenue: Projects expenses as a percentage of revenue based on historical data. Common for variable costs that fluctuate with sales, like COGS or sales commissions.
- Example: If COGS has consistently been 60% of revenue, use this ratio to forecast future COGS based on projected revenue.
- Fixed and Variable Cost Segmentation: Separates expenses into fixed and variable components, then applies growth rates or percentages of revenue to each. This approach provides a more accurate view of expenses.
- Example: A company might forecast rent (fixed) to grow by inflation while calculating sales commissions (variable) as a percentage of sales.
- Historical Trend Analysis: Projects future expenses based on historical trends in specific expense categories, such as SG&A or R&D. Best suited for stable businesses with predictable expense patterns.
- Example: If marketing expenses have grown by 3% annually, apply this growth rate to project future marketing costs.
- Zero-Based Budgeting: Starts each period’s forecast from zero, justifying every expense item without relying on past trends. Useful for controlling costs in times of financial restraint or for rapidly growing companies.
- Example: A company might use zero-based budgeting for travel expenses, estimating needs based on upcoming projects rather than prior spending.
- Activity-Based Forecasting: Links expenses to specific activities or cost drivers, such as production volume or headcount. This approach works well for manufacturing or labor-intensive businesses.
- Example: A factory might project utility costs based on expected machine usage or labor costs based on projected staffing levels.
3. Capital Expenditure (CapEx) Forecasting
CapEx forecasting projects the company’s investment in fixed assets, which can impact long-term growth and financial health.
- Historical CapEx Ratio: Estimates CapEx as a percentage of revenue or assets based on historical ratios. This approach is simple and useful for mature companies with stable CapEx needs.
- Example: If a company’s CapEx has historically been 5% of revenue, this ratio can be applied to forecast future CapEx based on projected revenue.
- Growth-Based Forecasting: Projects CapEx based on growth targets or expansion plans, considering the necessary investments to support future capacity or technology.
- Example: A company aiming to increase production capacity by 10% may project CapEx to cover the cost of new equipment or facilities.
- Replacement and Maintenance Cycle: Forecasts CapEx based on the depreciation and maintenance cycle of existing assets, useful for asset-heavy industries like manufacturing and transportation.
- Example: If a company’s machinery has an expected life of 10 years, schedule replacements or major repairs based on this lifecycle.
- Project-Specific Forecasting: Estimates CapEx based on planned projects or investments, such as new product development, facility expansion, or acquisitions. Useful for companies with discrete CapEx projects.
- Example: A retail company planning to open new stores may forecast CapEx based on the expected cost of each store.
- Industry Benchmarking: Compares CapEx to industry standards, allowing for adjustments based on the company’s competitive strategy or growth goals.
- Example: If companies in a tech industry spend 8% of revenue on CapEx, use this as a benchmark for a tech startup’s CapEx forecast.
Analyzing the Impact of Assumptions on Financial Projections
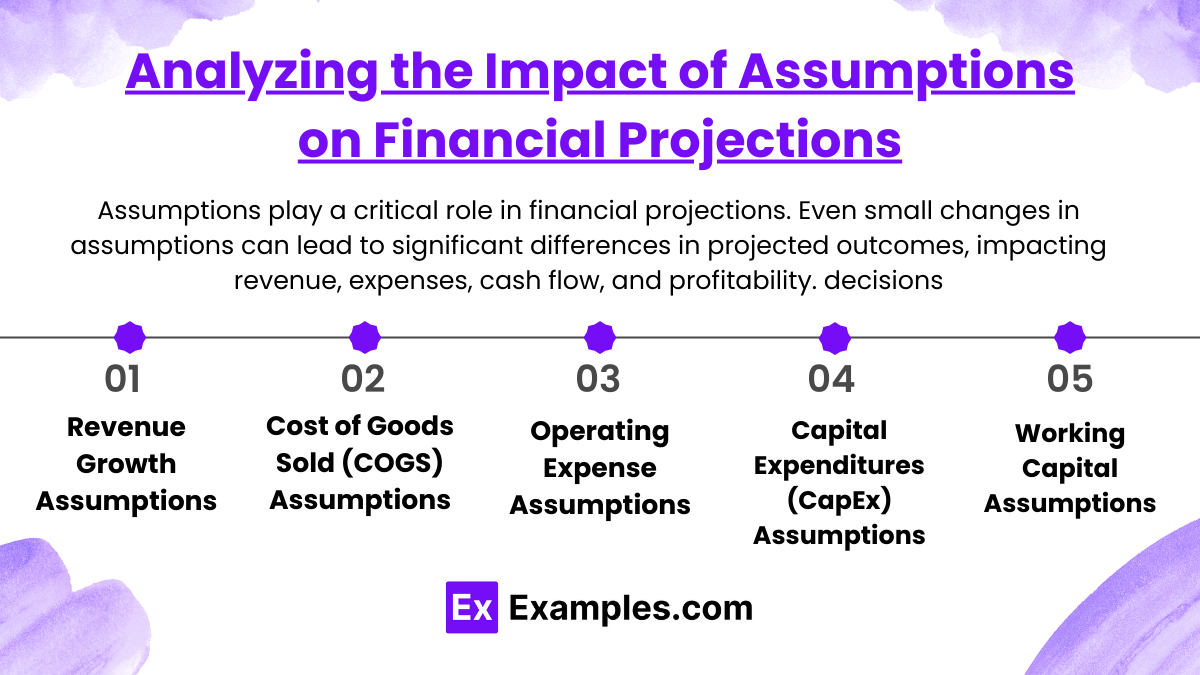
Assumptions play a critical role in financial projections. Even small changes in assumptions can lead to significant differences in projected outcomes, impacting revenue, expenses, cash flow, and profitability. By examining the impact of these assumptions, businesses can identify key drivers, assess risks, and make better-informed decisions. Here’s a comprehensive guide on analyzing the impact of assumptions on financial projections.
1. Revenue Growth Assumptions
Revenue growth is one of the most fundamental assumptions in financial projections, as it influences other forecast components like expenses, profit margins, and cash flow.
- Impact on Sales and Profitability: Higher revenue assumptions drive increased sales projections and may lead to higher profits. However, overly optimistic revenue growth can inflate profitability estimates and result in unrealistic financial outcomes.
- Effect on Variable Expenses: Revenue growth assumptions also affect variable costs such as cost of goods sold (COGS) and sales commissions, which typically scale with sales. If revenue grows, these costs generally increase, impacting gross and operating margins.
- Influence on Cash Flow: Revenue directly affects cash flow, particularly if sales are made on credit. Changes in revenue growth assumptions impact accounts receivable, potentially affecting cash availability.
Example: If a company projects a 10% revenue growth rate but revises it to 5%, net income and cash flow would decrease in line with lower revenue, affecting overall financial health.
2. Cost of Goods Sold (COGS) Assumptions
COGS projections, often a percentage of revenue, have a direct effect on gross margins and overall profitability.
- Impact on Gross Margin: Changes in COGS assumptions affect gross profit and margins, with a higher COGS percentage reducing profitability.
- Sensitivity to Cost Drivers: For businesses with significant raw materials, labor, or production costs, changes in commodity prices or labor rates can influence COGS.
Example: If COGS is expected to be 60% of revenue but increases to 65%, the gross profit margin decreases, lowering overall profitability.
3. Operating Expense Assumptions
Operating expenses include both fixed and variable costs and directly impact operating margins.
- Fixed vs. Variable Expense Impact: Variable expenses, like sales commissions, scale with revenue, while fixed expenses (e.g., rent) remain steady. Incorrect assumptions about the mix can misrepresent operating leverage.
- Operating Efficiency: Assumptions about expense growth (e.g., inflation or cost-cutting) influence margins. Overestimating cost savings or efficiencies can lead to unrealistic profit projections.
Example: Assuming stable operating expenses while planning for a large expansion can understate future costs, leading to unexpected strain on profitability.
4. Capital Expenditures (CapEx) Assumptions
CapEx assumptions impact both balance sheet assets and cash flow, especially for asset-intensive businesses.
- Growth-Related CapEx: Assumptions on CapEx for growth (e.g., new facilities) determine long-term capacity and scalability. Overestimating growth-driven CapEx can strain cash reserves without immediate ROI.
- Maintenance CapEx: Underestimating maintenance CapEx can lead to future cash outflows or unplanned costs for repairs or replacements.
Example: If CapEx is projected as $500,000 based on expansion goals, but growth slows, cash flow is constrained due to unnecessary investments in new assets.
5. Working Capital Assumptions
Working capital assumptions determine a company’s liquidity, as well as its ability to fund day-to-day operations.
- Accounts Receivable (Days Sales Outstanding – DSO): Longer collection periods reduce cash flow from operations, while shorter DSO improves liquidity.
- Inventory (Days Inventory Outstanding – DIO): Higher DIO increases holding costs and ties up cash in inventory, while lower DIO may indicate efficient inventory management.
- Accounts Payable (Days Payable Outstanding – DPO): Longer payment periods free up cash in the short term but may affect supplier relations if stretched too far.
Example: If a company assumes a DSO of 30 days but actuals are 45, cash flow projections will be lower due to delays in collections.
Evaluating the Interdependence of Financial Statements
Financial statements—namely, the income statement, balance sheet, and cash flow statement—are closely interconnected. Each statement influences and depends on the others, providing a holistic view of a company’s financial health. Understanding this interdependence is crucial for accurate financial analysis and forecasting. Here’s a breakdown of the interconnections and how they impact financial analysis.
1. Income Statement and Balance Sheet Interdependence
The income statement provides a snapshot of a company’s profitability over a specific period, while the balance sheet offers a cumulative view of assets, liabilities, and equity. These two statements are interconnected in several ways:
- Net Income and Retained Earnings: Net income from the income statement flows into retained earnings on the balance sheet, affecting shareholders’ equity. Positive net income increases retained earnings, while a net loss reduces it.
- Example: A company with $100,000 in net income will see this amount added to retained earnings, boosting total shareholders’ equity on the balnce sheet.
- Depreciation and Fixed Assets: Depreciation is recorded as an expense on the income statement, reducing net income. It also reduces the book value of fixed assets on the balance sheet by accumulating depreciation.
- Example: If depreciation expense is $10,000, it reduces both net income and the net book value of fixed assets on the balance sheet.
- Inventory and COGS: Changes in inventory impact COGS on the income statement and are reflected in the inventory balance on the balance sheet. Beginning and ending inventory levels influence COGS, affecting gross profit.
- Example: A reduction in ending inventory results in higher COGS, lowering gross profit and net income, while the balance sheet shows reduced inventory.
- Accounts Receivable and Revenue: When revenue is recognized but not yet collected, it creates an accounts receivable balance on the balance sheet. Collecting this receivable later will affect cash flow.
- Example: Revenue of $50,000 recognized but not yet collected creates an accounts receivable entry, showing revenue growth on the income statement but with no immediate impact on cash.
2. Balance Sheet and Cash Flow Statement Interdependence
The balance sheet and cash flow statement are deeply connected, as cash flow activities (operating, investing, and financing) affect balance sheet accounts.
- Operating Cash Flow and Working Capital: Changes in working capital accounts—such as accounts receivable, inventory, and accounts payable—affect cash flow from operations. An increase in accounts receivable, for instance, indicates revenue earned but not yet collected, reducing operating cash flow.
- Example: If accounts receivable increases by $20,000, cash flow from operations decreases by the same amount, affecting liquidity.
- Investing Activities and Fixed Assets: Capital expenditures (CapEx) and asset sales appear under investing activities in the cash flow statement. CapEx reduces cash flow and increases fixed assets on the balance sheet, while asset sales generate cash inflows and reduce fixed assets.
- Example: A $30,000 CapEx outflow will reduce cash and increase property, plant, and equipment on the balance sheet.
- Financing Activities and Debt/Equity: Cash flows from financing activities reflect changes in debt and equity. Issuing debt increases cash and liabilities, while repaying debt reduces both. Similarly, issuing equity increases cash and shareholders’ equity.
- Example: If the company issues $100,000 in debt, this inflow is shown in financing activities, while both cash and long-term liabilities increase on the balance sheet.
- Cash and Cash Equivalents: The ending cash balance on the cash flow statement flows into the cash and cash equivalents account on the balance sheet, reconciling the net change in cash for the period.
- Example: If cash flow from all activities totals $15,000, this amount is added to cash on the balance sheet, confirming the change in liquidity.
3. Income Statement and Cash Flow Statement Interdependence
The income statement and cash flow statement are linked through net income, which serves as the starting point for cash flow from operating activities.
- Net Income to Operating Cash Flow: The cash flow statement begins with net income from the income statement and adjusts for non-cash items (e.g., depreciation, amortization) and changes in working capital to determine cash flow from operations.
- Example: If net income is $80,000, this amount is the starting point, with adjustments for items like depreciation to reflect actual cash generated from operations.
- Non-Cash Expenses (e.g., Depreciation and Amortization): Depreciation and amortization reduce net income but are added back in the cash flow statement because they don’t affect cash flow directly.
- Example: Depreciation of $15,000 reduces net income but is added back in the operating cash flow, preserving cash flow.
- Gains and Losses on Asset Sales: Gains or losses from asset sales are included in net income but are excluded from operating cash flow, appearing instead in investing cash flow. This ensures that operating cash flow reflects only core business activities.
- Example: A $10,000 gain from asset sale would be removed from operating cash flow and added to cash inflows under investing activities.
4. Equity Section of the Balance Sheet and Financial Statements
The equity section of the balance sheet is influenced by various transactions and adjustments from all three financial statements.
- Retained Earnings and Net Income: Retained earnings increase or decrease based on net income (or loss) from the income statement, less any dividends paid.
- Example: With $120,000 net income and $20,000 in dividends, retained earnings increase by $100,000, strengthening shareholders’ equity.
- Dividend Payments: Dividends are a financing outflow on the cash flow statement and reduce retained earnings on the balance sheet.
- Example: A $25,000 dividend reduces both cash (financing activity outflow) and retained earnings, impacting shareholders’ equity.
- Stock Issuance and Repurchase: Issuing new shares raises cash and increases shareholders’ equity, while repurchasing shares reduces both.
- Example: Issuing shares for $50,000 increases cash and shareholders’ equity, providing capital for the company.
Examples
Example 1: Forecasting Revenue Growth
A financial statement model can be developed to project a company’s revenue growth based on historical sales data and market trends. For instance, a model may use previous sales figures and economic indicators to estimate future revenues over the next five years. This projection is crucial for budgeting, strategic planning, and evaluating potential investments.
Example 2: Valuation of a Company
Financial statement modeling is often used in company valuations, such as for mergers and acquisitions. By creating a detailed model that incorporates the income statement, balance sheet, and cash flow statement, analysts can calculate key metrics like net present value (NPV) and internal rate of return (IRR). This helps investors understand the company’s worth and make informed decisions regarding potential acquisitions.
Example 3: Scenario Analysis for Capital Expenditures
A financial model can facilitate scenario analysis to evaluate the impact of capital expenditures on a company’s financial health. For example, if a company is considering purchasing new equipment, the model can simulate different scenarios, such as varying costs, financing options, and expected returns. This analysis aids in determining whether the investment is financially viable and aligns with the company’s strategic goals.
Example 4: Cash Flow Projections
Cash flow modeling is a critical component of financial statement modeling, particularly for businesses reliant on accurate cash management. By projecting cash inflows and outflows, a company can assess its liquidity position over time. This modeling can help identify periods of cash shortfall and inform strategies for managing working capital effectively, ensuring the business can meet its obligations.
Example 5: Assessing Debt Financing Options
Financial statement modeling allows companies to evaluate different debt financing options by analyzing their effects on the financial statements. For example, a company may model how taking on additional debt to fund expansion will impact its interest expenses, cash flows, and overall financial ratios, such as debt-to-equity and interest coverage ratios. This analysis helps management decide on the optimal capital structure to support growth while maintaining financial stability.
Practice Questions
Question 1
What is the primary objective of financial statement modeling?
A) To predict future stock prices
B) To evaluate the creditworthiness of a company
C) To create a structured representation of a company’s financial performance and projections
D) To assess the effectiveness of marketing strategies
Correct Answer: C) To create a structured representation of a company’s financial performance and projections.
Explanation: The primary objective of financial statement modeling is to build a comprehensive and structured model that reflects a company’s historical financial performance and allows for projections of future financial results. These models typically integrate income statements, balance sheets, and cash flow statements to facilitate analysis and decision-making. Options A, B, and D represent different financial analyses that may not involve comprehensive modeling of financial statements.
Question 2
Which financial statements are typically included in a comprehensive financial statement model?
A) Only the income statement
B) Income statement, balance sheet, and cash flow statement
C) Income statement and profit margin analysis
D) Only the cash flow statement
Correct Answer: B) Income statement, balance sheet, and cash flow statement.
Explanation: A comprehensive financial statement model generally includes the income statement, balance sheet, and cash flow statement. This triad of financial statements provides a complete view of a company’s financial health, performance, and cash management. Each statement serves a unique purpose, and together, they allow for thorough financial analysis. Options A, C, and D do not capture the full scope of what constitutes a complete financial statement model.
Question 3
What role do assumptions play in financial statement modeling?
A) They are not necessary and can be omitted.
B) They provide a basis for forecasting and scenario analysis.
C) They guarantee accurate financial results.
D) They are used only for historical data.
Correct Answer: B) They provide a basis for forecasting and scenario analysis.
Explanation: Assumptions are critical in financial statement modeling as they underpin the forecasts and projections made in the model. These assumptions can relate to revenue growth rates, expense trends, capital expenditures, and market conditions. By varying these assumptions, analysts can conduct scenario analyses to evaluate how different conditions may impact a company’s financial performance. Options A and D misrepresent the importance of assumptions, while option C is misleading, as assumptions do not guarantee accuracy; they are estimates that help guide the modeling process.

