The Model Building Process in technical trading is a systematic approach to creating rules-based strategies for analyzing market behavior and executing trades. It begins with defining a clear objective, followed by selecting relevant technical indicators, developing logical entry and exit rules, and incorporating risk management. Backtesting, optimization, and forward testing validate the model’s performance in historical and real-time conditions. By iteratively refining and monitoring, this process aims to produce a robust, adaptable model capable of generating consistent returns in varying market environments.
Learning Objectives
In studying “The Model Building Process” within “Perspectives on Technical Trading Systems” for the CMT, you should learn to understand the systematic approach to creating trading models. Analyze each step, including defining objectives, data preparation, indicator selection, rule development, and backtesting. Evaluate how backtesting and forward testing validate model effectiveness and understand risk management’s role in safeguarding capital within trading strategies. Additionally, explore the importance of optimization without overfitting to maintain adaptability. Apply this structured approach to interpret technical trading models, assessing their relevance and reliability when addressing real-world trading scenarios and market changes.
1. Introduction to Model Building

Model building in technical analysis involves developing systematic rules to identify market trends, entry and exit points, and risk management strategies. It incorporates both qualitative insights (like market psychology) and quantitative indicators to form predictive trading models.
Key Aspects of Model Building:
- Defining Objectives: The purpose of the model guides its design, whether it’s for predicting stock prices, measuring risk, or evaluating asset allocation. Clearly defining the objective sets the scope and structure of the model.
- Data Collection and Preparation: Reliable data is crucial to model accuracy. Data must be cleaned, organized, and sometimes transformed to remove noise or biases that could distort results. Common data types include price, volume, economic indicators, and company financials.
- Selecting Variables: Choosing relevant variables, or factors, that influence the desired outcome is a critical step. For example, in an equity valuation model, earnings, interest rates, and industry growth are often considered.
- Model Types and Techniques: Model types can vary widely, from simple linear regression and moving averages to complex machine learning models like neural networks. The selection depends on the model’s objectives, data structure, and the desired level of complexity.
- Backtesting and Validation: Testing the model on historical data helps determine its effectiveness and allows adjustments to improve reliability. Validation also involves ensuring the model performs as expected in different market conditions.
2. Defining the Objective
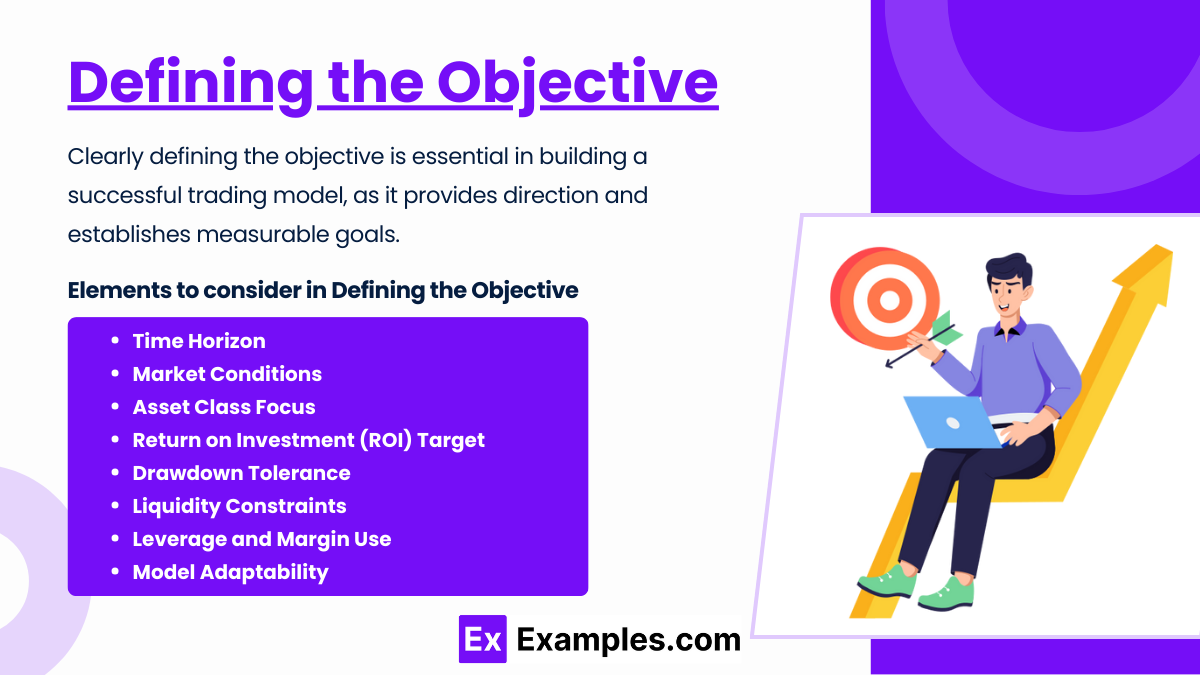
Clearly defining the objective is essential in building a successful trading model, as it provides direction and establishes measurable goals.
Elements to consider in Defining the Objective
- Time Horizon: Determining whether the model will operate on short-term (intra-day), medium-term (swing trading), or long-term (position trading) timeframes is crucial, as it impacts indicator selection, data granularity, and the frequency of trades.
- Market Conditions: Identifying the specific market conditions the model is designed to capitalize on—such as trending, volatile, or range-bound markets—helps ensure the model performs optimally under the intended circumstances.
- Asset Class Focus: Specifying the asset class (e.g., equities, forex, commodities) or instrument type (e.g., options, futures) influences the model’s structure, as different asset classes exhibit unique patterns, volatility levels, and market behaviors.
- Return on Investment (ROI) Target: Setting a clear ROI target establishes a benchmark for the model’s performance and helps assess whether the model is meeting profitability expectations relative to risk exposure.
- Drawdown Tolerance: Defining acceptable drawdown levels ensures that the model adheres to risk management principles, minimizing the likelihood of capital depletion during periods of adverse market conditions.
3. Data Collection and Preparation

Data Collection and Preparation is a fundamental process in analysis, research, and machine learning that involves gathering relevant data, cleaning it, and transforming it into a usable format. Here are key steps in data collection and preparation:
- Defining Objectives: Clearly identify the goals and requirements of the analysis or model. Understanding what information is needed helps in targeting the right data sources and avoiding irrelevant data.
- Data Collection: Gather data from various sources, such as databases, APIs, surveys, sensors, or third-party providers. Depending on the project, data may be structured (like tables) or unstructured (like text, images, or videos).
- Data Cleaning: Remove errors, duplicates, and inconsistencies in the data. Cleaning ensures data quality by addressing issues such as missing values, incorrect formatting, outliers, and irrelevant data.
- Data Transformation: Convert data into the required format or structure. This includes normalizing, aggregating, or encoding data to make it compatible with analysis or modeling tools. Common techniques include scaling, creating dummy variables, and feature engineering.
- Data Integration: Combine data from multiple sources into a unified dataset. This step is essential when using varied data sources, ensuring compatibility and reducing redundancies.
4. Selecting Technical Indicators
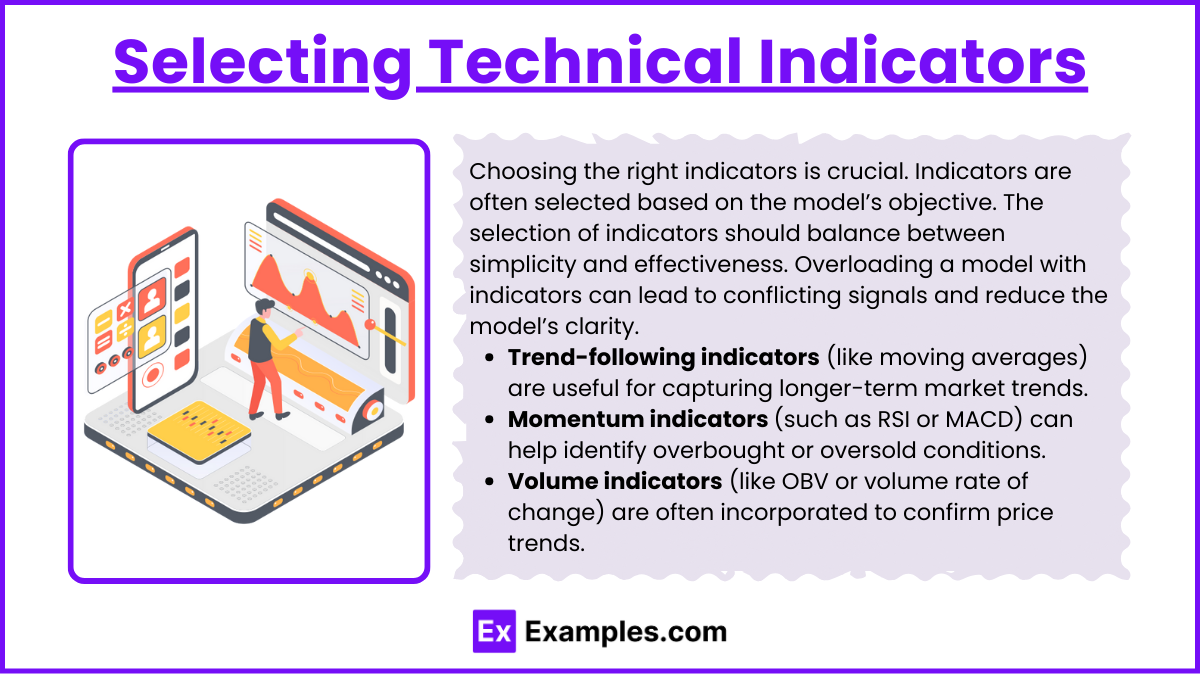
- Choosing the right indicators is crucial. Indicators are often selected based on the model’s objective. For example:
- Trend-following indicators (like moving averages) are useful for capturing longer-term market trends.
- Momentum indicators (such as RSI or MACD) can help identify overbought or oversold conditions.
- Volume indicators (like OBV or volume rate of change) are often incorporated to confirm price trends.
- The selection of indicators should balance between simplicity and effectiveness. Overloading a model with indicators can lead to conflicting signals and reduce the model’s clarity.
Examples
Example 1: Moving Average Crossover System
In this model, a trader sets up two moving averages (e.g., a 50-day and a 200-day moving average) to identify trend shifts. When the shorter moving average crosses above the longer one, it signals a buying opportunity, while a cross below suggests selling. This model seeks to capture momentum and trend direction, and it can be enhanced by integrating stop-loss levels and profit targets to manage risk. Backtesting ensures that the parameters (such as the 50- and 200-day periods) align with the asset’s historical behavior, while optimization may involve tweaking these values for different market conditions.
Example 2: Relative Strength Index (RSI) Mean Reversion Model
The RSI mean reversion model operates on the principle that assets oscillate between overbought and oversold levels. Here, a trader might set buy signals when the RSI drops below 30 (indicating oversold conditions) and sell signals above 70 (indicating overbought conditions). This model focuses on capturing reversals rather than trends and is commonly used in short-term trading. Backtesting on historical price data helps validate whether the 30 and 70 levels are suitable, while forward testing in live conditions allows the trader to fine-tune the settings to respond accurately to the asset’s behavior.
Example 3: Bollinger Bands Breakout Model
This model relies on Bollinger Bands to detect volatility-driven breakout opportunities. Bollinger Bands create an envelope around price levels based on standard deviation, expanding and contracting with market volatility. A trader might initiate a buy when the price breaks above the upper band and a sell when it drops below the lower band. This strategy assumes that price movement outside the bands indicates strong directional momentum. The model is typically backtested with historical volatility levels to determine the standard deviation multipliers, and it can be optimized by adjusting the time periods and standard deviation settings for different assets or timeframes.
Example 4: Moving Average Convergence Divergence (MACD) Trend Following Model
The MACD model captures shifts in momentum by analyzing the convergence and divergence between two exponential moving averages. In this model, the trader buys when the MACD line crosses above the signal line and sells when it crosses below. This strategy is often combined with volume indicators to confirm price movements and reduce the probability of false signals. Backtesting identifies effective parameter settings for the MACD line and signal line periods, and forward testing allows the trader to refine the model based on real-time market conditions. By focusing on trend reversals, this model is useful in trend-following and trend-reversal strategies.
Example 5: Mean Reversion Model Using Pairs Trading
Pairs trading is a statistical arbitrage model that assumes the relationship between two correlated assets will revert to the mean over time. A trader might monitor the spread between the prices of two stocks in a similar industry and take opposite positions if the spread widens or narrows beyond a historical range. For example, if the spread is wider than usual, the trader would short the outperforming stock and go long on the underperforming one. Backtesting assesses the historical correlation between the assets, and optimization fine-tunes the entry and exit thresholds to balance potential profit with acceptable risk.
Practice Questions
Question 1
Which of the following is the first step in the model-building process for technical trading systems?
A. Selecting technical indicators
B. Backtesting the model
C. Defining the model’s objective
D. Optimizing model parameters
Answer: C. Defining the model’s objective
Explanation: The initial step in any successful model-building process is defining the objective. This objective sets the foundation for the entire model by specifying what the model aims to achieve, such as capturing short-term price movements, identifying trends, or maximizing returns while minimizing risks. By clearly stating the goal, the subsequent steps, like indicator selection and rule development, can be aligned with the desired outcomes. Skipping this step can lead to an unclear focus, potentially resulting in a model that lacks consistency and relevance.
Question 2
In the context of model building, overfitting refers to:
A. Using too many technical indicators to optimize model performance on historical data
B. Testing the model on out-of-sample data to check its robustness
C. Implementing effective risk management strategies to limit drawdowns
D. Adjusting model parameters to make it more generalized across different markets
Answer: A. Using too many technical indicators to optimize model performance on historical data
Explanation: Overfitting occurs when a model is overly complex or tailored specifically to historical data, often by adding numerous indicators or adjusting parameters excessively. This can result in a model that performs exceptionally well on past data but fails to generalize in real-time trading. While it may seem beneficial during backtesting, overfitting often leads to poor performance on new data, as the model is too “fitted” to the unique patterns in historical data rather than capturing broader, repeatable market behavior. Avoiding overfitting is crucial to creating a robust, adaptable trading system.
Question 3
Which of the following describes the purpose of forward testing in the model-building process?
A. Optimizing model parameters to achieve maximum profit on historical data
B. Evaluating the model’s real-time performance without financial risk
C. Analyzing the model’s risk-to-reward ratio under different market conditions
D. Determining the best entry and exit points using technical indicators
Answer: B. Evaluating the model’s real-time performance without financial risk
Explanation: Forward testing, also known as paper trading, is the stage where the model is tested in real-time market conditions, often without committing actual capital. This phase helps validate if the model’s predictions align with real-world dynamics and assesses its adaptability to current market movements. Unlike backtesting, which uses historical data, forward testing allows for observing the model’s behavior as it encounters new, unforeseen data. Forward testing is essential for refining the model before live deployment and is an important step in ensuring the model’s robustness and effectiveness in real trading conditions.

