Relative Strength (RS) as a criterion for investment selection is a powerful technical analysis tool used to compare the performance of one asset against another or a benchmark, such as a stock index. By evaluating which assets are outperforming relative to others, traders and investors can identify stronger investment opportunities with greater potential for returns. RS is especially valuable in trending markets, where assets with high RS tend to continue their performance trajectory. This approach supports momentum-based strategies, guiding investors toward assets with favorable performance trends.
Learning Objectives
In studying “Relative Strength as a Criterion for Investment Selection” for the CMT, you should learn to understand the concept of relative strength (RS) in comparing asset performance against benchmarks or other securities. Examine how RS is used to identify outperforming assets and apply it in technical trading systems to enhance investment selection. Evaluate the principles and calculations of RS ratios, recognizing its role in momentum-based strategies. Additionally, analyze RS’s effectiveness across different market conditions and its limitations in sideways markets. Apply these insights to interpret RS patterns and make informed trading decisions within a technical trading framework.
Relative Strength (RS) is a technical analysis concept focused on comparing the performance of one security or asset against another or a benchmark, often to identify outperforming stocks or sectors for potential investment. The theory behind RS is that securities demonstrating stronger performance relative to others are more likely to continue performing well. This approach serves as an essential criterion in developing systematic trading strategies.
Understanding Relative Strength (RS)
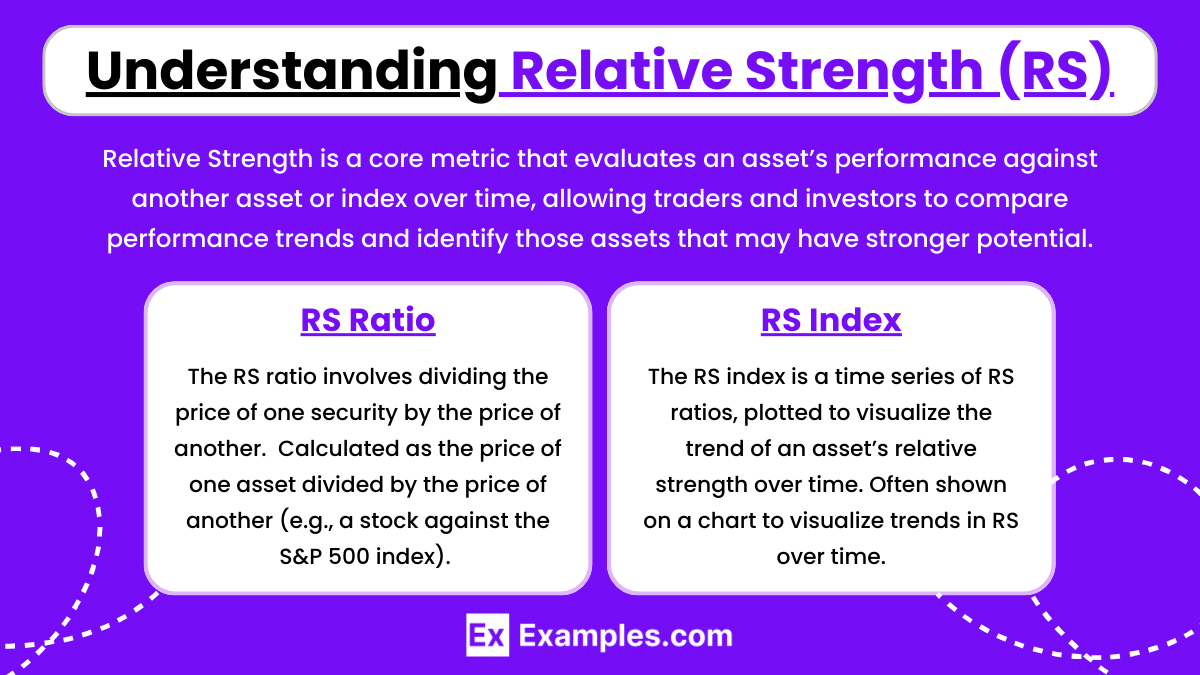
Relative Strength is a core metric that evaluates an asset’s performance against another asset or index over time, allowing traders and investors to compare performance trends and identify those assets that may have stronger potential. RS can be calculated using various methods, each tailored to specific analytical needs. Relative Strength measures how a security performs compared to another asset or index, helping traders and investors identify favorable investments. RS values are often expressed as ratios or indexes:
- RS Ratio: Calculated as the price of one asset divided by the price of another (e.g., a stock against the S&P 500 index). The RS ratio involves dividing the price of one security by the price of another. This ratio is particularly helpful for gauging how an individual stock or sector is performing relative to a broader market index.
- RS Index: Often shown on a chart to visualize trends in RS over time. The RS index is a time series of RS ratios, plotted to visualize the trend of an asset’s relative strength over time. This approach is particularly useful for detecting trends and momentum, as an upward-trending RS index indicates a strong relative performance and vice versa.
These metrics are frequently charted to enable visual analysis of an asset’s performance relative to a benchmark, revealing patterns that support decision-making.
Types of RS Indicators
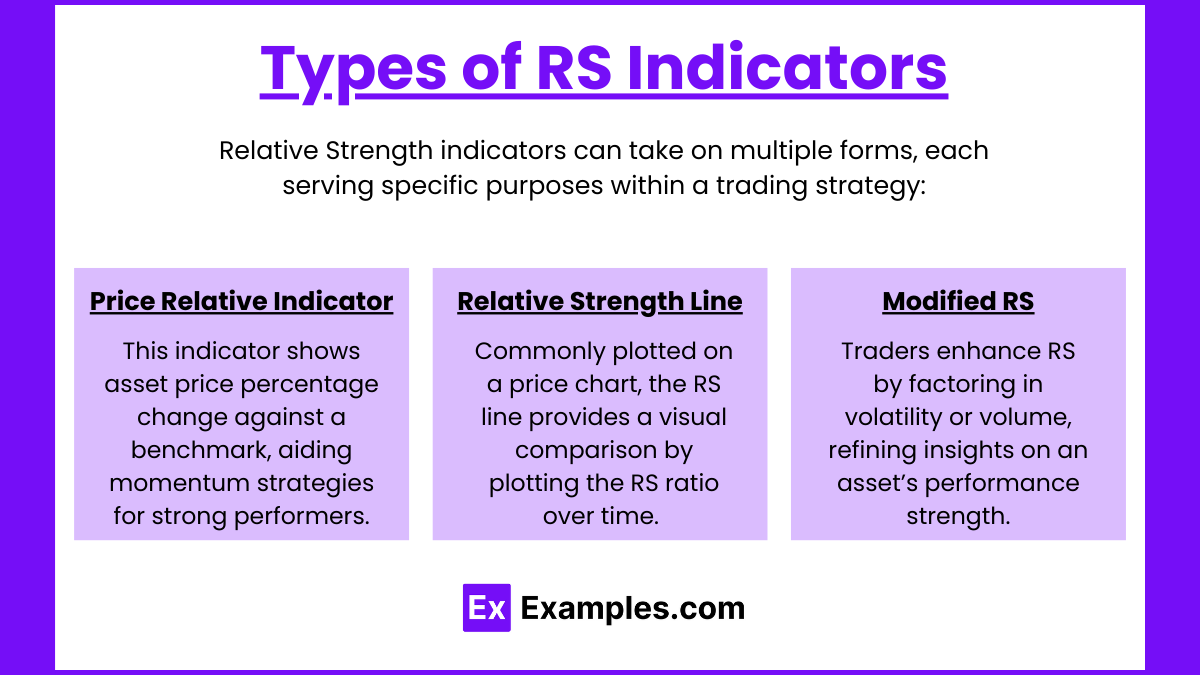
Relative Strength indicators can take on multiple forms, each serving specific purposes within a trading strategy:
- Price Relative Indicator: This indicator measures the percentage change in the asset price relative to a benchmark, often used in momentum strategies where the aim is to follow securities with the strongest performance.
- Relative Strength Line: Commonly plotted on a price chart, the RS line provides a visual comparison by plotting the RS ratio over time. An upward-trending line suggests the stock is outperforming the benchmark, while a downward trend indicates underperformance.
- Modified RS: Some traders modify RS by adjusting for factors like volatility or weighting RS values by volume, providing a more nuanced view of performance strength.
Importance of RS in Investment Selection
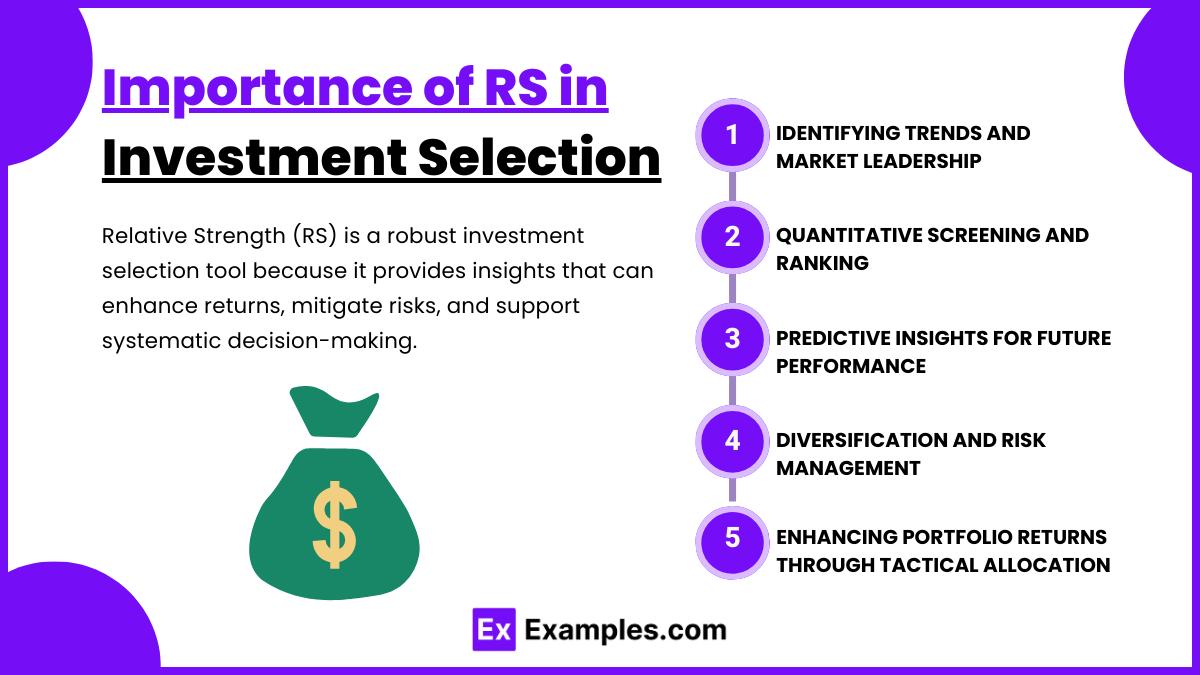
Relative Strength (RS) is a robust investment selection tool because it provides insights that can enhance returns, mitigate risks, and support systematic decision-making. Here are several key reasons why RS is vital in identifying promising investment opportunities:
1. Identifying Trends and Market Leadership
RS helps investors recognize and align with assets or sectors leading the market. By focusing on these leaders, traders can capitalize on prevailing market trends:
- Market Cycles: RS allows traders to identify assets that perform well in specific market cycles, whether bullish, bearish, or sideways. This information is especially useful in sectors that tend to outperform under certain economic conditions, such as technology in growth markets or utilities in downturns.
- Consistent Outperformers: RS helps reveal which stocks or sectors are consistently outperforming their peers, allowing investors to focus on market leaders instead of laggards. This is particularly valuable in momentum strategies, which benefit from identifying established and emerging trends.
2. Quantitative Screening and Ranking
One of RS’s strengths is its ability to provide a quantitative approach to stock selection. Investors can rank stocks or sectors based on their RS scores, allowing them to:
- Prioritize High RS Assets: Stocks or sectors with the highest RS scores often indicate those with the most significant price strength relative to a benchmark. This prioritization enables a systematic approach, ensuring that the strongest assets are favored in investment decisions.
- Streamlined Screening Process: RS provides an objective screening metric that reduces the need for time-intensive qualitative analysis. This makes RS particularly useful in large portfolios or ETFs, where quick and efficient filtering of a vast number of securities is necessary.
3. Predictive Insights for Future Performance
Historical data suggests that stocks exhibiting high RS often continue to perform well, although no guarantee exists:
- Momentum Persistence: RS capitalizes on the “momentum effect,” where assets showing strong performance tend to continue outperforming in the near term. This effect supports strategies like “buy strength, sell weakness,” where investments are made in the strongest assets and rotated out as they lose relative strength.
- Outperformance Potential: By investing in high RS assets, traders can potentially gain exposure to sectors or stocks more likely to experience positive price momentum. This is particularly advantageous for trend-following investors who seek to participate in rising markets.
4. Diversification and Risk Management
RS aids in diversifying portfolios while also managing downside risk:
- Sector Rotation for Diversification: RS supports sector rotation, which involves reallocating investments into sectors with rising RS scores. This strategy can improve diversification by ensuring exposure to different sectors throughout various market cycles, adapting to emerging economic conditions.
- Risk Reduction by Avoiding Weak Assets: Focusing on high RS assets inherently reduces exposure to weaker securities. By avoiding underperforming stocks, investors can mitigate losses and improve the risk-adjusted returns of a portfolio.
5. Enhancing Portfolio Returns Through Tactical Allocation
RS is an effective tool for tactical asset allocation, enabling investors to shift their portfolios toward high-RS assets:
- Dynamic Adjustments: RS allows for dynamic portfolio adjustments by overweighting strong assets and underweighting or removing weak ones. This tactical approach can optimize returns over a passive strategy by adjusting exposure based on relative performance.
- Capitalizing on Sector Shifts: With RS, investors can make tactical allocations to outperforming sectors as economic cycles evolve, potentially enhancing returns by seizing opportunities in sectors that benefit from economic, regulatory, or technological shifts.
Calculation Methods for RS
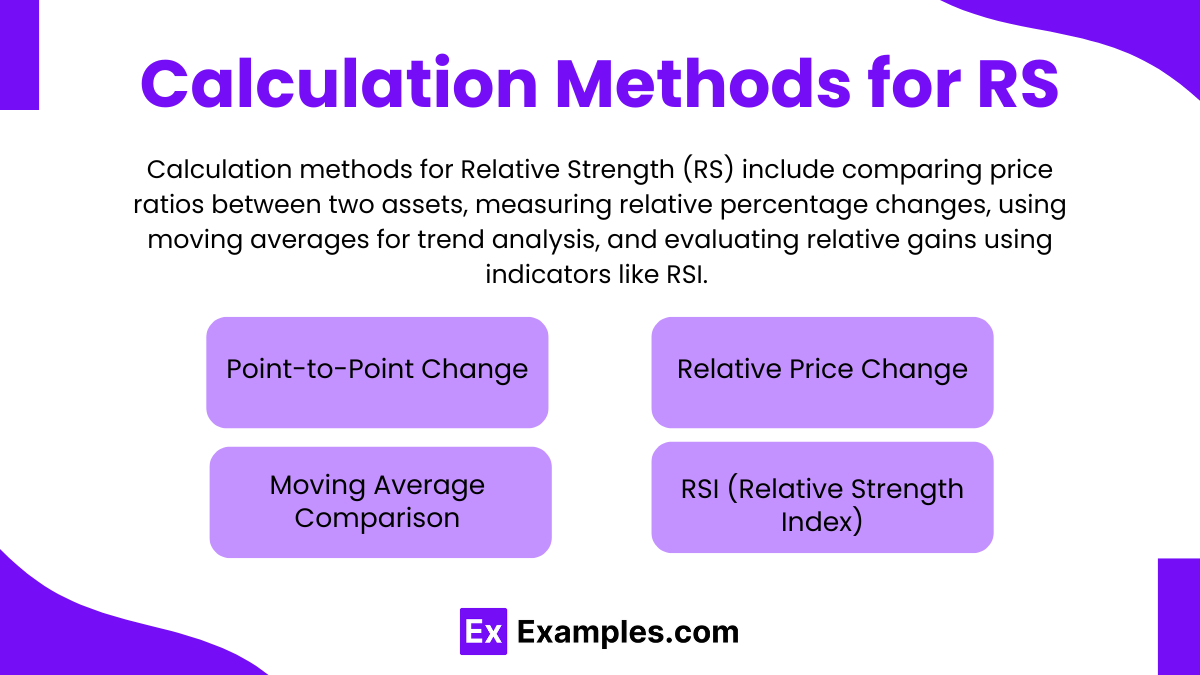
Calculation methods for Relative Strength (RS) include comparing price ratios between two assets, measuring relative percentage changes, using moving averages for trend analysis, and evaluating relative gains using indicators like RSI. There are several approaches to calculating Relative Strength, each catering to different investment strategies:
- Point-to-Point Change: Measures the change in an asset’s price over a fixed period relative to a benchmark.
- Relative Price Change: Considers percentage price changes between two securities over a given period.
- Moving Average Comparison: Uses moving averages (e.g., 50-day and 200-day averages) to assess trends in RS, filtering out short-term noise for more stable patterns.
- RSI (Relative Strength Index): Although different from RS as a criterion, RSI is a momentum oscillator that indicates overbought or oversold conditions based on relative gains and losses.
Examples
Example 1: Sector Rotation Strategy
In a sector rotation strategy, relative strength is used to identify and invest in the strongest-performing sectors during various economic cycles. For instance, during a market uptrend, technology and consumer discretionary sectors might display high relative strength compared to defensive sectors. Investors can overweight these high-performing sectors to capture growth. Conversely, during a downturn, sectors like utilities or consumer staples may exhibit stronger relative performance, signaling a rotation to safer assets. This approach aligns investments with sectors gaining relative strength, helping to maximize returns based on current market conditions.
Example 2: Relative Strength with Moving Averages for Stock Selection
Traders often use relative strength in conjunction with moving averages to confirm trends in individual stocks. For example, a stock that exhibits strong relative strength compared to a market index (e.g., the S&P 500) and is trading above its 50-day and 200-day moving averages may be considered for entry. This setup signals both momentum and stability in the stock’s price movement, suggesting it’s likely to outperform in the short to medium term. Investors may stay invested as long as the stock maintains its relative strength and remains above the key moving averages, using crossovers as exit signals.
Example 3: Top-Down Approach Using Relative Strength
A top-down approach to investment selection starts by analyzing broad asset classes (e.g., equities, bonds, commodities) and then narrows down to sectors, industries, and finally individual securities. Using relative strength at each level, investors can progressively filter out weaker performers. For example, within equities, if the technology sector shows the strongest relative performance, the investor would then examine industries within tech, identifying leading companies with the highest relative strength scores. This approach helps optimize returns by channeling investments into the most resilient areas across all levels of the market.
Example 4: RS and Momentum Trading System
Relative strength is a core component in momentum trading systems, where investors buy assets that are outperforming their peers, betting on the continuation of this performance. For example, a trader might screen for the top 10% of stocks in a specific index based on relative strength, establishing a portfolio of high-momentum stocks. The position is held as long as the stock remains within this top percentile. This strategy is effective in trending markets, where high relative strength tends to persist, allowing investors to benefit from sustained outperformance until a reversal or mean reversion occurs.
Example 5: Long/Short Relative Strength Pairs Trading
Relative strength can also be applied in pairs trading by selecting one stock to go long and another to short based on their relative strength rankings. For instance, if two companies are in the same sector but one shows significantly higher relative strength than the other, the trader could go long on the stronger stock and short the weaker one. This approach benefits from the performance differential while minimizing exposure to market-wide risk. As long as the high-RS stock continues to outperform the low-RS stock, the trade remains favorable, capturing gains from the relative performance difference.
Practice Questions
Question 1
Which of the following best defines the concept of Relative Strength (RS) in the context of technical analysis?
A) A measure comparing the volatility of an asset to the overall market.
B) A ratio that shows how a security performs relative to a benchmark or another security.
C) An indicator used to identify overbought and oversold conditions in the market.
D) A metric that predicts future price movements based solely on historical trading volume.
Answer: B) A ratio that shows how a security performs relative to a benchmark or another security.
Explanation: Relative Strength (RS) is a concept in technical analysis that compares the performance of one asset or security to a benchmark (e.g., a market index like the S&P 500) or to another security. This ratio is calculated by dividing the price of the asset by the price of the benchmark or another asset. RS helps analysts and traders identify outperforming assets, which are often more likely to continue performing well due to the momentum effect. Options A, C, and D are incorrect as they describe different concepts: volatility, overbought/oversold indicators, and volume-based metrics, none of which are the basis for the Relative Strength concept.
Question 2
In which of the following market phases is Relative Strength (RS) analysis most effective for investment selection?
A) Sideways or choppy market conditions
B) Declining or bear market phases
C) Trending markets, either upward or downward
D) Volatile markets with sudden price spikes and drops
Answer: C) Trending markets, either upward or downward
Explanation: Relative Strength (RS) analysis is most effective in trending markets, where securities that are outperforming relative to their peers are likely to continue doing so, aligning with momentum-based strategies. When the market is trending, assets with strong RS tend to persist in the same direction, whether in an uptrend or downtrend. In contrast, during sideways or choppy markets (Option A) and volatile markets with unpredictable price movements (Option D), RS may generate misleading signals. While RS can provide useful insights in bear markets (Option B), it is particularly valuable in trending markets where strong performance relative to benchmarks is more consistent and reliable.
Question 3
Which of the following is a limitation of using Relative Strength (RS) as a criterion for investment selection?
A) RS is heavily dependent on accurate fundamental analysis of securities.
B) RS tends to underperform in choppy or sideways markets.
C) RS exclusively focuses on the fundamental value of stocks rather than their price performance.
D) RS uses moving averages, making it ineffective in identifying short-term trends.
Answer: B) RS tends to underperform in choppy or sideways markets.
Explanation: One key limitation of Relative Strength (RS) is that it may underperform during choppy or sideways markets, where no clear trend exists. In these conditions, assets may not exhibit consistent outperformance relative to benchmarks, making RS signals less reliable and potentially leading to losses if the assets don’t follow a strong directional trend. Option A is incorrect because RS does not rely on fundamental analysis; it’s purely a technical indicator based on price performance. Option C is also incorrect, as RS is fundamentally focused on price performance rather than intrinsic value. Finally, Option D is incorrect because RS doesn’t inherently rely on moving averages, although moving averages can be combined with RS to enhance its reliability in trend identification.

