Preparing for the CMT Exam requires a strong grasp of volume and breadth analysis, essential aspects of technical analysis. Mastery of volume trends, trading activity, and market breadth indicators helps in understanding market sentiment, price movements, and trend strength. This knowledge is crucial for evaluating market health and achieving a high CMT score.
Learning Objective
In studying “Volume and Breadth” for the CMT Exam, you should aim to understand key concepts in analyzing market activity and sentiment through volume and breadth indicators. Examine how volume analysis reveals the strength behind price movements and how breadth indicators, such as the advance-decline line, provide insights into the overall market trend. Analyze tools like on-balance volume (OBV), accumulation/distribution line, and volume-weighted average price (VWAP). Evaluate how these indicators contribute to identifying bullish or bearish conditions and apply your knowledge to interpret market health and strength, using these techniques effectively in technical analysis and exam scenarios.
Understanding Volume Analysis
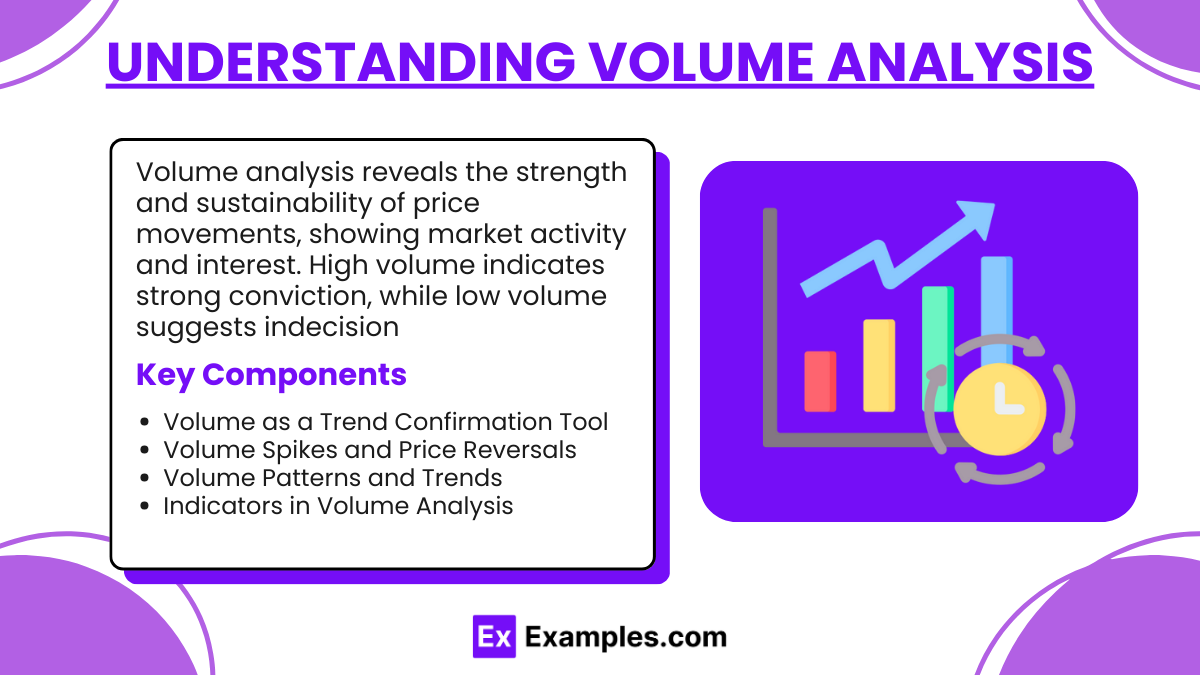
Volume analysis is a key component of technical analysis, providing insights into the strength and sustainability of price movements in the market. Volume represents the total number of shares or contracts traded within a specific period, reflecting the level of activity and interest in a security. Higher volume generally signifies greater market interest and conviction, while lower volume may indicate less enthusiasm or indecision among traders.
Key Concepts in Volume Analysis:
- Volume as a Trend Confirmation Tool: Volume is often used to confirm the validity of price trends. In an uptrend, increasing volume suggests strong buying interest, reinforcing the trend’s strength. Conversely, declining volume during an uptrend may signal that the trend is weakening, as fewer traders are willing to buy at higher prices. For a downtrend, increasing volume signals strong selling pressure, while decreasing volume may indicate a potential bottom or reversal.
- Volume Spikes and Price Reversals: Large, sudden increases in volume (volume spikes) can precede price reversals. These spikes often occur at key support or resistance levels, as a large number of buyers or sellers enter the market, causing a rapid price change. Analyzing these spikes in relation to price action can help traders anticipate potential turning points in the market.
- Volume Patterns and Trends: Recognizing volume patterns, such as increasing volume in a trending market or diverging volume relative to price, can provide signals about the likely future direction of a trend. For instance, if price continues to rise but volume decreases, it may indicate diminishing interest, suggesting a possible reversal.
- Indicators in Volume Analysis: Traders use various indicators based on volume, such as On-Balance Volume (OBV), Accumulation/Distribution (A/D) line, and Volume Oscillator, to gain additional insights. These indicators track cumulative buying and selling pressure, helping traders interpret underlying market strength or weakness.
Volume analysis is crucial for assessing market sentiment, identifying trend sustainability, and providing additional confirmation for trading decisions. It forms a cornerstone in technical analysis by allowing traders to measure market enthusiasm and commitment, which can improve timing for entries, exits, and managing risk effectively.
Breadth Indicators
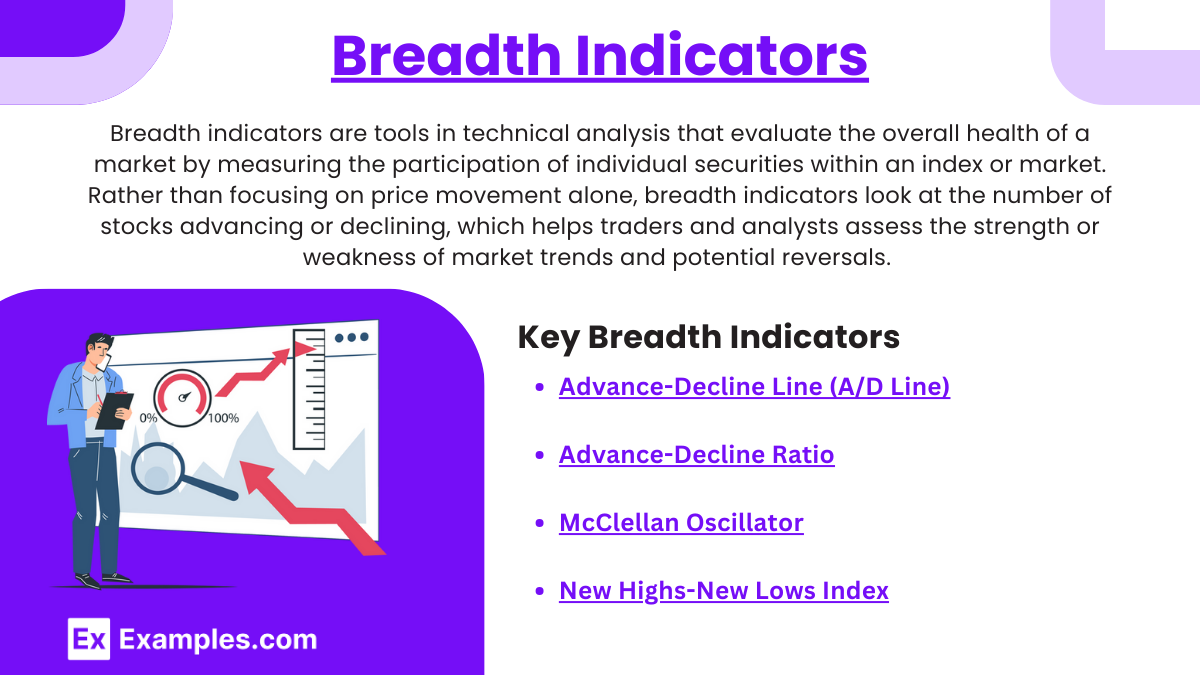
Breadth indicators are tools in technical analysis that evaluate the overall health of a market by measuring the participation of individual securities within an index or market. Rather than focusing on price movement alone, breadth indicators look at the number of stocks advancing or declining, which helps traders and analysts assess the strength or weakness of market trends and potential reversals. These indicators are valuable for understanding if a market’s rally or decline is supported by a broad base of stocks or driven by a few influential stocks.
Key Breadth Indicators
- Advance-Decline Line (A/D Line):
The A/D line is one of the most popular breadth indicators and represents the cumulative difference between the number of advancing and declining stocks in a given market index. If the A/D line rises along with the index, it confirms a strong, broad-based market trend. However, if the index rises while the A/D line falls, it may signal weakening breadth, indicating that fewer stocks are supporting the rally, which can be a warning of a potential market reversal. - Advance-Decline Ratio:
This ratio compares the number of advancing stocks to the number of declining stocks. A high A/D ratio suggests that most stocks are participating in the current market direction, indicating trend strength. Conversely, a low A/D ratio may show that only a few stocks are leading the movement, signaling a potentially weak or unsustainable trend. - McClellan Oscillator:
The McClellan Oscillator uses the difference between the number of advancing and declining stocks to create a momentum oscillator. By smoothing the difference with short- and long-term exponential moving averages (EMAs), this oscillator helps traders gauge the strength and direction of market breadth. Positive readings indicate bullish breadth, while negative readings suggest bearish breadth. Extremes in the McClellan Oscillator often signal overbought or oversold conditions, which may precede a trend reversal. - New Highs-New Lows Index:
This index compares the number of stocks making new 52-week highs to those making new 52-week lows. When new highs consistently exceed new lows, it indicates broad market strength. Conversely, if new lows consistently outnumber new highs, it suggests weakness in the market. This indicator is particularly useful for confirming long-term market trends and identifying potential reversal points.
Importance of Breadth Indicators
Breadth indicators provide valuable insights into the internal strength or weakness of the market beyond price movement alone. They help traders understand whether a trend is supported by a broad array of stocks or led by a few, making it possible to spot divergences that may indicate trend reversals. For instance, if a major index is rallying while breadth indicators show weakening participation, it could signal that the trend is losing momentum, potentially foreshadowing a downturn
Volume and Breadth Combined Analysis
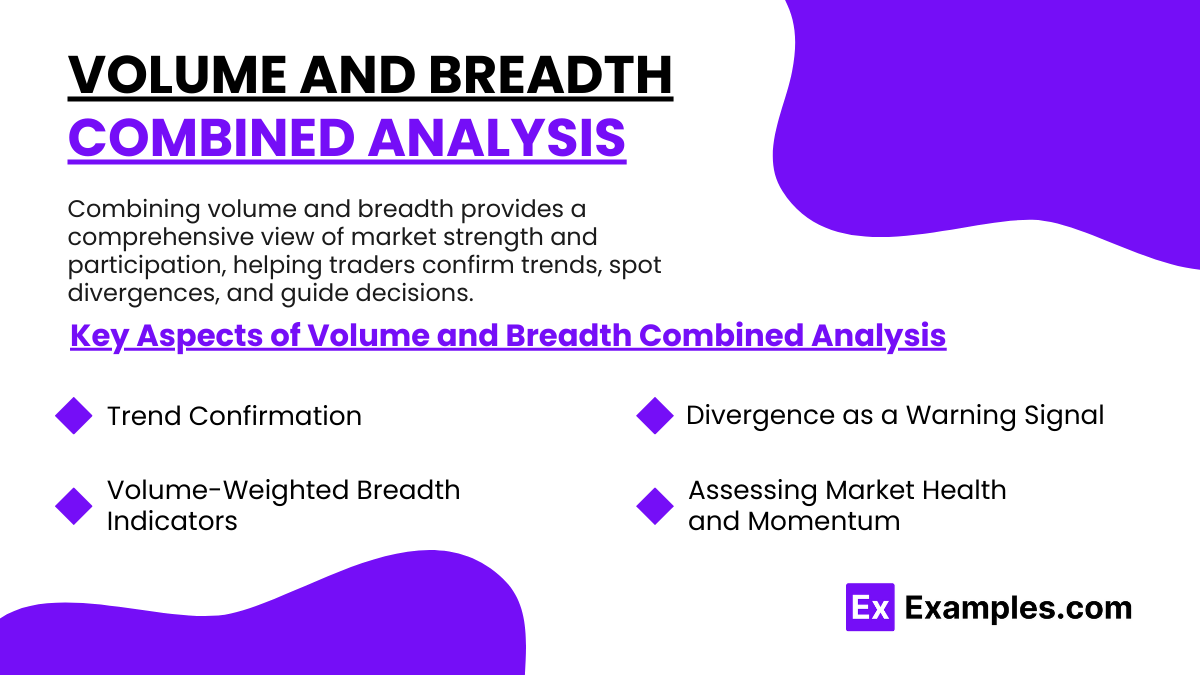
Combining volume and breadth analysis offers a more robust and nuanced view of market conditions, providing insights into both the strength and participation of market movements. While volume reveals the intensity of buying and selling within a particular asset or index, breadth shows the degree to which individual securities within the market support the overall trend. Together, these indicators allow traders to confirm trends, identify divergences, and make better-informed decisions about market direction and momentum.
Key Aspects of Volume and Breadth Combined Analysis
- Trend Confirmation: When both volume and breadth align with the market direction, it strengthens the trend’s validity. For example, a rising market accompanied by increasing volume and a strong advance-decline line indicates widespread participation and high conviction among traders. Conversely, a downtrend with both falling breadth and volume reinforces the bearish sentiment.
- Divergence as a Warning Signal: Divergences between volume and breadth can serve as early warning signals of potential trend reversals. For instance, if a market index continues to rise but is accompanied by decreasing volume and a falling advance-decline line, it may suggest that fewer stocks are driving the rally, potentially indicating weakening momentum. Such divergences can prompt traders to exercise caution, as they may foreshadow a market pullback or reversal.
- Volume-Weighted Breadth Indicators: Volume-weighted breadth indicators, such as volume-adjusted advance-decline lines or volume-weighted on-balance volume (OBV), combine aspects of both volume and breadth into a single measure. These indicators assign more weight to stocks with higher trading volumes, helping traders focus on the movements of more actively traded securities, which may provide clearer signals about market health and sentiment.
- Assessing Market Health and Momentum: By analyzing both volume and breadth, traders gain a more comprehensive view of the market’s underlying strength. For example, during a rally, broad-based participation confirmed by both strong breadth and high volume suggests a healthy trend. In contrast, narrow participation and low volume during an uptrend may signal vulnerability, as the rally might lack the robust support needed for sustained gains.
In technical analysis, combining volume and breadth offers a well-rounded perspective on market sentiment, allowing traders to make more informed decisions by interpreting both the intensity and breadth of market participation.
Applications of Volume and Breadth in Technical Analysis
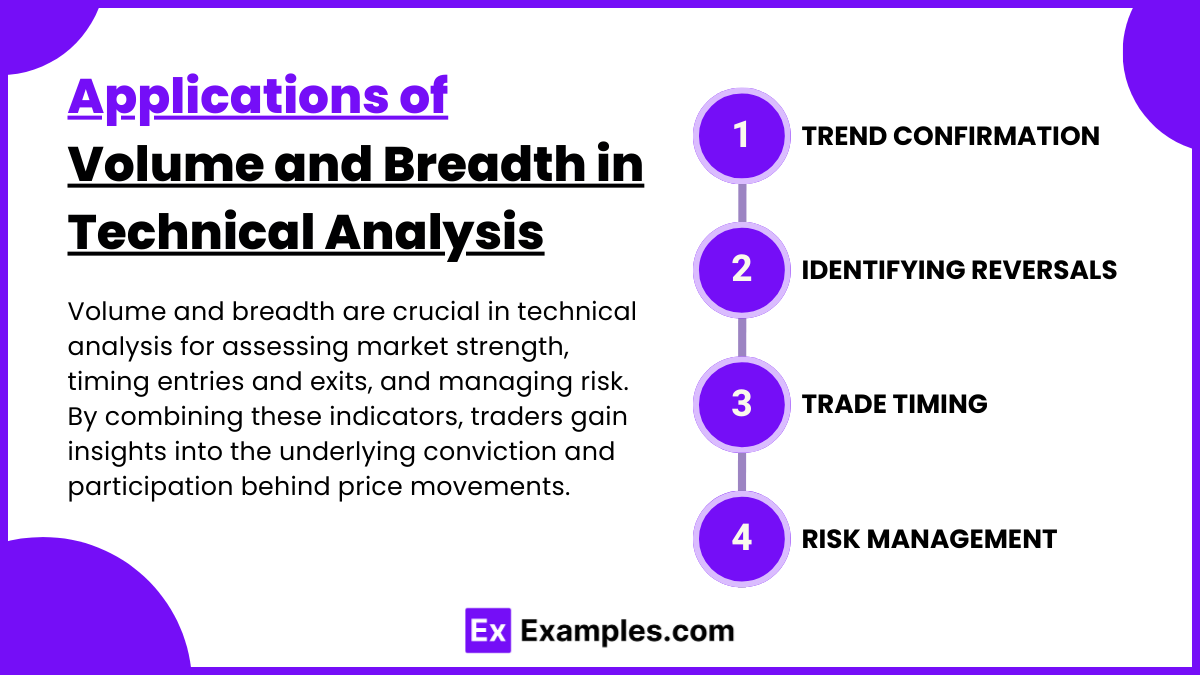
Volume and breadth are crucial in technical analysis for assessing market strength, timing entries and exits, and managing risk. By combining these indicators, traders gain insights into the underlying conviction and participation behind price movements.
- Trend Confirmation: High volume and strong breadth confirm trend strength, signaling robust market sentiment, while weak volume or breadth may signal trend exhaustion.
- Identifying Reversals: Divergences between price trends and volume or breadth (e.g., rising prices with declining breadth) can indicate potential trend reversals, allowing traders to act preemptively.
- Trade Timing: Volume and breadth provide cues for optimal entry and exit points; strong volume and breadth during uptrends or downtrends reinforce trade confidence.
- Risk Management: Observing volume and breadth helps traders gauge market momentum, enabling better risk management by avoiding trades in weakening trends.
Examples
Example 1
In a strong uptrend, both the stock index and the advance-decline line are rising, and trading volume is increasing daily. This alignment of volume and breadth suggests a robust, broad-based rally, indicating high confidence among traders and a healthy trend.
Example 2
A market index is making new highs, but the advance-decline line is declining, and volume is decreasing. This divergence shows that fewer stocks are participating in the rally, signaling potential weakness in the trend and a possible upcoming reversal.
Example 3
During a downtrend, the number of stocks hitting new lows outpaces those making new highs, and volume is significantly elevated. The high volume coupled with negative breadth reinforces the bearish sentiment, indicating strong selling pressure and a potentially prolonged downtrend.
Example 4
An index experiences a volume spike while price remains relatively flat, and breadth indicators show mixed results. This suggests increased trading activity without a clear trend direction, possibly indicating indecision or accumulation before a significant price movement.
Example 5
In a sideways or consolidating market, volume is low, and the advance-decline ratio hovers near neutral. This low volume and lack of breadth directionality imply weak market momentum, signaling traders to wait for clearer volume and breadth signals before making trades.
Practice Questions
Question 1
What does it generally indicate when an index is rising, but volume and the advance-decline line are both decreasing?
A. A strong, healthy uptrend
B. A potential trend reversal
C. Increased market participation
D. Confirmation of the trend
Answer: B. A potential trend reversal
Explanation: When the index rises but both volume and breadth (as measured by the advance-decline line) decrease, it indicates that fewer stocks are participating in the rally, and trading interest is waning. This divergence often signals weakening trend strength and a potential reversal.
Question 2
Which of the following would most likely confirm a strong uptrend?
A. Rising prices with low volume and flat breadth
B. Rising prices with increasing volume and positive breadth
C. Declining prices with increasing volume and negative breadth
D. Rising prices with decreasing volume and mixed breadth
Answer: B. Rising prices with increasing volume and positive breadth
Explanation: A strong uptrend is typically confirmed by rising prices accompanied by increasing volume and positive breadth, showing both market interest and broad participation in the trend. This alignment reinforces the trend’s strength and suggests sustained momentum.
Question 3
If the market experiences a volume spike while breadth indicators remain neutral, what might this suggest?
A. A clear upward trend
B. Indecision or potential accumulation
C. Strong bullish momentum
D. An immediate sell-off
Answer: B. Indecision or potential accumulation
Explanation: A volume spike with neutral breadth indicators often indicates indecision in the market or possible accumulation. High trading activity without clear directional breadth suggests that investors are trading actively, but the market has yet to establish a definitive trend direction.

