Preparing for the CMT Exam involves a solid grasp of Bar Chart Patterns, a key aspect of technical analysis. Mastery of various bar chart formations, including trend identification and reversal signals, is crucial. This knowledge aids in predicting price movements, enhancing trading strategies, and optimizing market analysis, all essential for achieving a high CMT score.
Learning Objective
In studying “Bar Chart Patterns” for the CMT Exam, you should learn to identify and interpret various bar chart formations that signal potential price trends and market reversals. Understand the principles behind single and multiple bar patterns, such as inside bars, outside bars, and key reversal patterns. Analyze how these patterns provide insight into supply and demand dynamics, trader psychology, and market momentum. Evaluate the use of bar chart patterns in both intraday and long-term trading strategies. Additionally, apply this knowledge to real-time chart analysis and interpret pattern signals within the context of broader market conditions for successful CMT preparation.
Understanding Bar Chart Basics

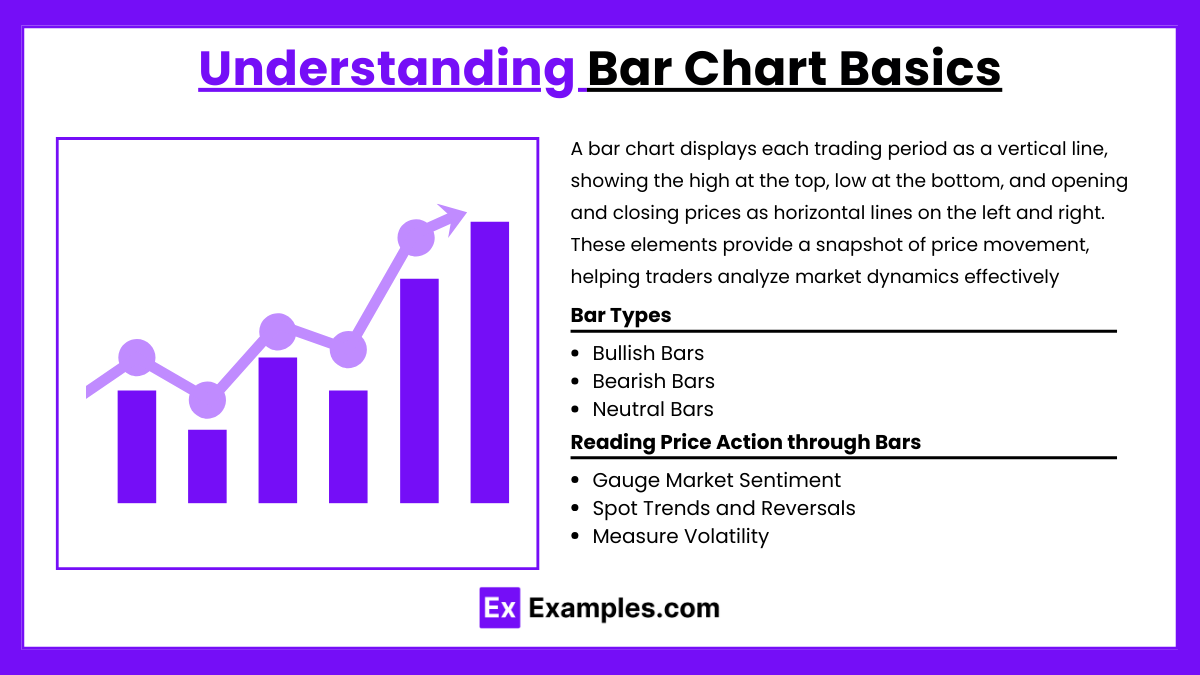
Bar charts are fundamental tools in technical analysis, providing a detailed visual representation of price action over specific time frames. Each bar in a bar chart reflects essential price information, including the opening, high, low, and closing (OHLC) prices of an asset for a particular period. Here’s a breakdown of the main components and their significance in bar chart basics:
Definition and Components of Bar Charts
A bar chart represents each trading period (such as a day, hour, or minute) as a vertical line or “bar.” This bar shows the high and low prices for the period, with horizontal lines indicating the opening and closing prices:
- Open: The initial price at the start of the period, marked as a horizontal line on the left side of the bar.
- High: The highest price reached during the period, located at the top of the bar.
- Low: The lowest price during the period, positioned at the bottom of the bar.
- Close: The final price at the end of the period, marked by a horizontal line on the right side of the bar.
These components give a complete snapshot of price movement, making it easier to observe the trading dynamics over time.
Bar Types and Their Significance
Different bar types provide insights into market sentiment and potential price action:
- Bullish Bars: When the closing price is higher than the opening price, indicating buying strength.
- Bearish Bars: When the closing price is lower than the opening price, signaling selling pressure.
- Neutral Bars: Bars with little difference between opening and closing prices, suggesting indecision in the market.
Identifying the type of bar can help traders interpret the prevailing market mood—whether it’s bullish, bearish, or neutral—and anticipate potential movements.
Reading Price Action through Bars
Bar charts allow analysts to identify trends, reversals, and volatility. By observing the size and direction of bars, traders can:
- Gauge Market Sentiment: Strong upward or downward movements suggest high buying or selling interest, while small, neutral bars may indicate indecision.
- Spot Trends and Reversals: Consecutive bullish or bearish bars can signal a trend, while sudden changes (e.g., from bullish to bearish bars) might indicate a reversal.
- Measure Volatility: Large bars represent periods of high volatility, and small bars indicate low volatility, helping traders adjust their strategies.
Single Bar Patterns and Their Interpretation

Single bar patterns are individual bars that can provide valuable insights into potential price movements, trend strength, and possible reversals. By analyzing these single bars, traders can interpret market sentiment and make quick trading decisions. Here’s an overview of key single bar patterns and their interpretations:
Inside and Outside Bars
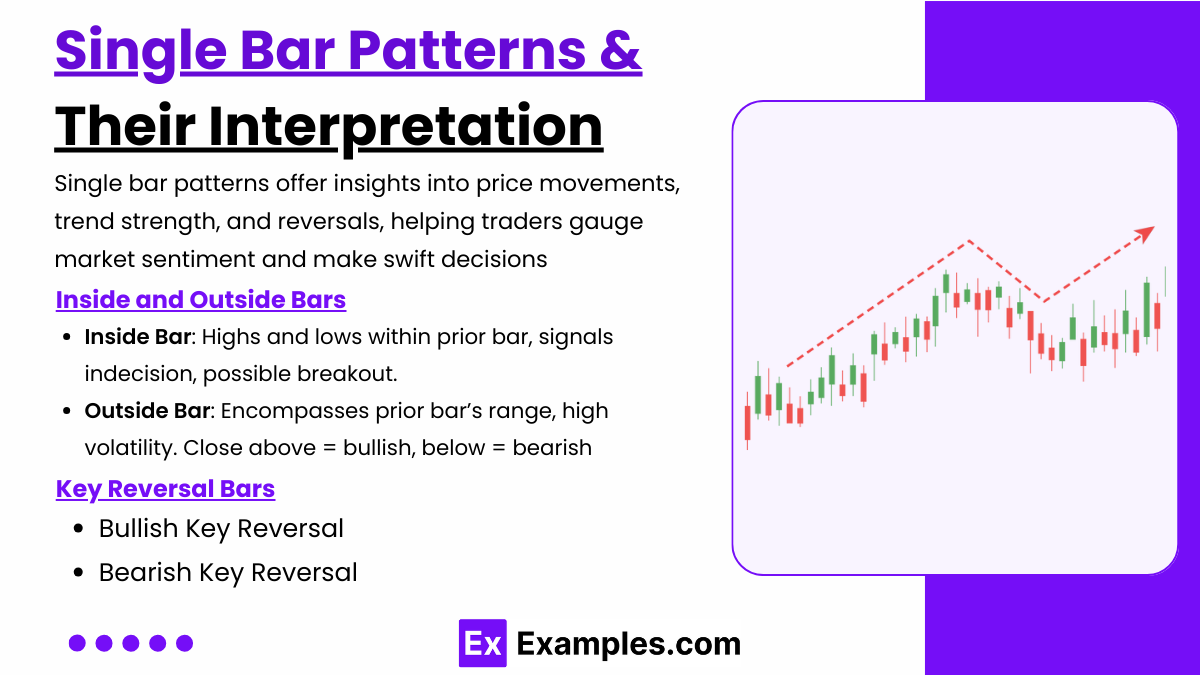
- Inside Bar: An inside bar is a bar whose high and low prices fall within the range of the previous bar, indicating a period of consolidation or indecision in the market. Inside bars suggest that neither buyers nor sellers have gained control, and they often signal a potential breakout when the market decides on a direction. Traders watch for price movements outside the high or low of the inside bar as a potential breakout in that direction.
- Outside Bar: An outside bar (or engulfing bar) has a range that completely encompasses the previous bar’s high and low. This pattern signifies heightened volatility and uncertainty, as it reflects a strong push from one side of the market. If the outside bar closes above the previous bar’s high, it’s considered bullish, while a close below the previous low is bearish. Outside bars can signal trend continuation or reversal depending on their position within a trend.
Key Reversal Bars
- A key reversal bar is characterized by a sharp reversal in price direction within a single trading period. For instance, in an uptrend, a key reversal bar would open higher than the previous close, but close lower than the previous bar’s low, indicating a potential trend reversal.
- Bullish Key Reversal: Occurs when a bar opens lower and closes higher, surpassing the previous bar’s high. This pattern often suggests a shift from selling to buying pressure and can mark the beginning of an uptrend.
- Bearish Key Reversal: Forms when a bar opens higher and closes lower, dropping below the previous bar’s low. This pattern may indicate that buyers are losing control, signaling the start of a potential downtrend.
Key reversal bars are powerful indicators as they often highlight significant changes in market sentiment and momentum. They tend to be reliable signals, especially when they appear at key support or resistance levels.
Other Important Single Bars
- Pin Bar: A pin bar has a long tail (or “wick”) on one side and a small body on the other, indicating strong rejection of a price level. The direction of the tail shows where price was pushed back, with a bullish pin bar having a long lower tail (showing rejection of lower prices) and a bearish pin bar having a long upper tail (showing rejection of higher prices). Pin bars are frequently used to identify trend reversals or continuations when they appear at significant price levels.
- Doji: A doji bar forms when the opening and closing prices are nearly the same, resulting in a small or nonexistent body with long tails on both sides. This pattern reflects indecision in the market, with neither buyers nor sellers dominating. Dojis often signal that a trend may be weakening, and a reversal could follow, particularly when they appear after an extended uptrend or downtrend.
Application in Trading
- Single bar patterns are versatile tools in technical analysis. Traders use them to detect market sentiment quickly, especially in fast-moving markets where time-sensitive decisions are critical. Each of these patterns provides clues about whether a current trend is likely to continue or reverse.
- When combined with other technical indicators (like volume or moving averages), single bar patterns can help traders increase the reliability of their predictions. For example, an inside bar breakout accompanied by high trading volume may suggest a stronger breakout potential
Multi-Bar Patterns and Trend Identification

Multi-bar patterns consist of two or more bars that work together to indicate potential trend direction, trend strength, or market reversal points. These patterns provide more information than single-bar patterns and are valuable for identifying sustained trends or trend shifts. Traders use multi-bar patterns to assess whether a current trend will continue or if a reversal is likely. Here’s an in-depth look at some of the key multi-bar patterns and their interpretations.
Engulfing Patterns
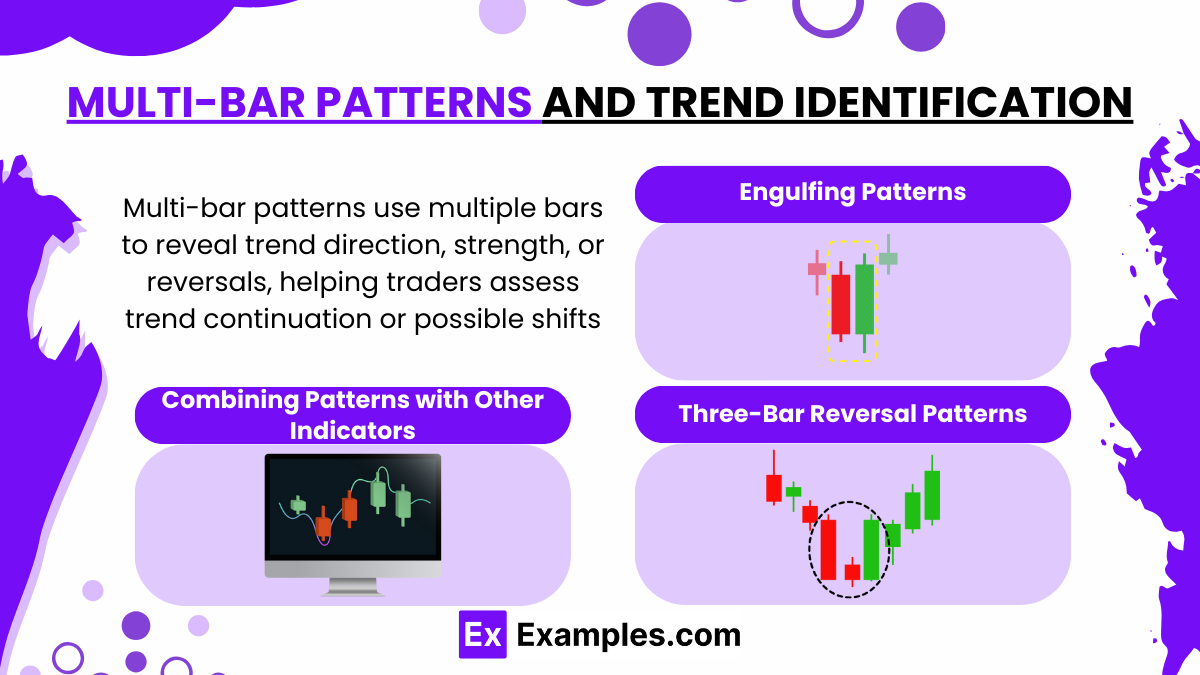
- Bullish Engulfing Pattern: This pattern occurs when a large bullish bar (upward movement) completely engulfs the previous bearish bar (downward movement). It indicates that buying interest has overwhelmed selling pressure, often signaling the end of a downtrend and the start of a potential uptrend. This pattern is more reliable when it appears at the bottom of a downtrend or near support levels.
- Bearish Engulfing Pattern: The bearish engulfing pattern forms when a large bearish bar completely engulfs the previous bullish bar. This pattern suggests that sellers have taken control, often marking the end of an uptrend and a potential downtrend. It is most effective as a reversal signal when found at the top of an uptrend or near resistance levels.
Engulfing patterns are useful for spotting reversals, particularly when accompanied by high trading volume, which strengthens the likelihood of a significant trend change.
Three-Bar Reversal Patterns
- Bullish Three-Bar Reversal: This pattern occurs when a series of three bars indicate a shift from bearish to bullish sentiment. For example, the first bar in a downtrend is a bearish bar, the second bar is a smaller or doji bar (indicating indecision), and the third bar is a bullish bar that closes above the high of the first bar. This pattern can signal a trend reversal from bearish to bullish.
- Bearish Three-Bar Reversal: In this pattern, the first bar in an uptrend is a bullish bar, the second bar is smaller or doji-like, and the third bar is bearish, closing below the low of the first bar. This sequence indicates a potential shift from bullish to bearish sentiment, signaling the beginning of a downtrend.
Three-bar reversals are reliable for identifying trend reversals and are especially effective when the third bar shows strong momentum, confirming the trend change.
Combining Patterns with Other Indicators
Multi-bar patterns become more powerful when used with other technical indicators, such as:
- Volume: High volume during a multi-bar pattern often confirms the pattern’s validity. For example, if a bullish engulfing pattern forms with high trading volume, it reinforces the strength of the potential uptrend.
- Moving Averages: Multi-bar patterns that align with moving average signals, such as crosses or rejections from key levels (like the 50-day or 200-day moving averages), provide further validation. For instance, a bearish three-bar reversal occurring just below a declining moving average strengthens the bearish signal.
- Support and Resistance Levels: Multi-bar patterns that form around significant support or resistance levels tend to be more reliable. A bullish engulfing pattern near a support level, for example, suggests a strong buying interest that might lead to a trend reversal.
Application in Trading
- Trend Continuation: Multi-bar patterns can indicate trend continuation, confirming that the current trend remains strong. Patterns like consecutive bullish bars in a bullish trend often suggest that buying pressure persists, while consecutive bearish bars in a downtrend suggest sustained selling pressure.
- Trend Reversals: Multi-bar patterns can effectively indicate trend reversals, especially when they appear near key support or resistance levels or in overbought or oversold markets. Recognizing these patterns allows traders to position themselves for a potential change in market direction.
- Trend Strength and Momentum: Multi-bar patterns can reveal the strength of a trend. For instance, larger bars with longer ranges in a trend direction indicate high momentum, while small-range bars might suggest weakening momentum.
Examples
Example 1: Bullish Engulfing Pattern
A bullish engulfing pattern forms when a large bullish bar completely engulfs the previous bearish bar. For instance, in a downtrend, a small bearish bar is followed by a larger bullish bar that covers the entire range of the previous bar. This pattern signals potential trend reversal from bearish to bullish, especially when accompanied by high trading volume.
Example 2: Bearish Engulfing Pattern
In a bearish engulfing pattern, a large bearish bar completely engulfs the previous bullish bar. For example, in an uptrend, a small bullish bar is followed by a larger bearish bar that surpasses the previous bar’s high and low. This pattern suggests a potential reversal to a downtrend, particularly when it appears near a resistance level.
Example 3: Inside Bar Pattern
An inside bar pattern occurs when a bar’s high and low prices fall within the range of the previous bar. For example, after a large bullish bar, an inside bar may appear, showing a period of market consolidation or indecision. Traders look for a breakout from the inside bar’s range, which often indicates the continuation or reversal of the prior trend.
Example 4: Key Reversal Bar
A key reversal bar signals a potential trend reversal and is identified by a sharp change in direction. For instance, in an uptrend, a key reversal bar would open higher than the previous close and then close lower than the previous bar’s low. This pattern shows a shift in control from buyers to sellers, indicating a possible downtrend.
Example 5: Pin Bar
A pin bar has a long wick or tail and a small body, indicating strong rejection of a price level. For example, a bearish pin bar has a long upper wick and a small lower body, showing rejection of higher prices. Pin bars are often used to spot potential reversals, especially when they form at key support or resistance levels.
Practice Questions
Question 1
Which of the following best describes a bullish engulfing pattern in bar chart analysis?
A) A large bearish bar that completely engulfs the previous bullish bar
B) A small bar that falls within the range of the previous bar
C) A large bullish bar that completely engulfs the previous bearish bar
D) A bar with a long tail and a small body, showing price rejection
Answer: C
Explanation: A bullish engulfing pattern occurs when a large bullish bar engulfs the entire range of the previous bearish bar, signaling potential reversal to an uptrend. It indicates strong buying interest that overwhelms previous selling pressure.
Question 2
Which bar pattern is most commonly associated with market indecision?
A) Pin bar
B) Key reversal bar
C) Engulfing bar
D) Inside bar
Answer: D
Explanation: An inside bar is characterized by a bar whose high and low prices fall within the range of the previous bar. This pattern suggests market indecision or consolidation, as neither buyers nor sellers are dominating, making it a common signal of potential breakout.
Question 3
In an uptrend, a key reversal bar would likely appear as:
A) A bullish bar with a long lower wick
B) A bar that opens higher but closes lower than the previous low
C) A small bar with a range within the previous bar
D) A bar with a higher close than the previous bar’s close
Answer: B
Explanation: In an uptrend, a key reversal bar appears when a bar opens higher than the previous close but closes lower than the previous bar’s low. This pattern indicates a potential trend reversal, as it shows a shift in control from buyers to sellers.


