Preparing for the CMT Exam requires mastering the selection of markets and issues for trading and investing. Understanding how to evaluate market opportunities, assess liquidity, volatility, and market trends is critical. This knowledge enables effective asset selection, informed investment decisions, and strategic portfolio management, boosting success in technical analysis and trading performance.
Learning Objective
In studying “Selection of Markets and Issues: Trading and Investing” for the CMT Level 2 Exam, you should learn to identify and evaluate market opportunities for trading and investing. Understand how to analyze liquidity, volatility, and market trends to select appropriate assets. Assess key factors influencing market conditions and issue selection, including economic indicators, sector performance, and market sentiment. Explore technical tools for screening and ranking markets, and develop strategies to optimize portfolio diversification and performance. Apply your knowledge to real-world scenarios to enhance trading efficiency and align with market conditions for informed decision-making in technical analysis.
Evaluating Market Opportunities
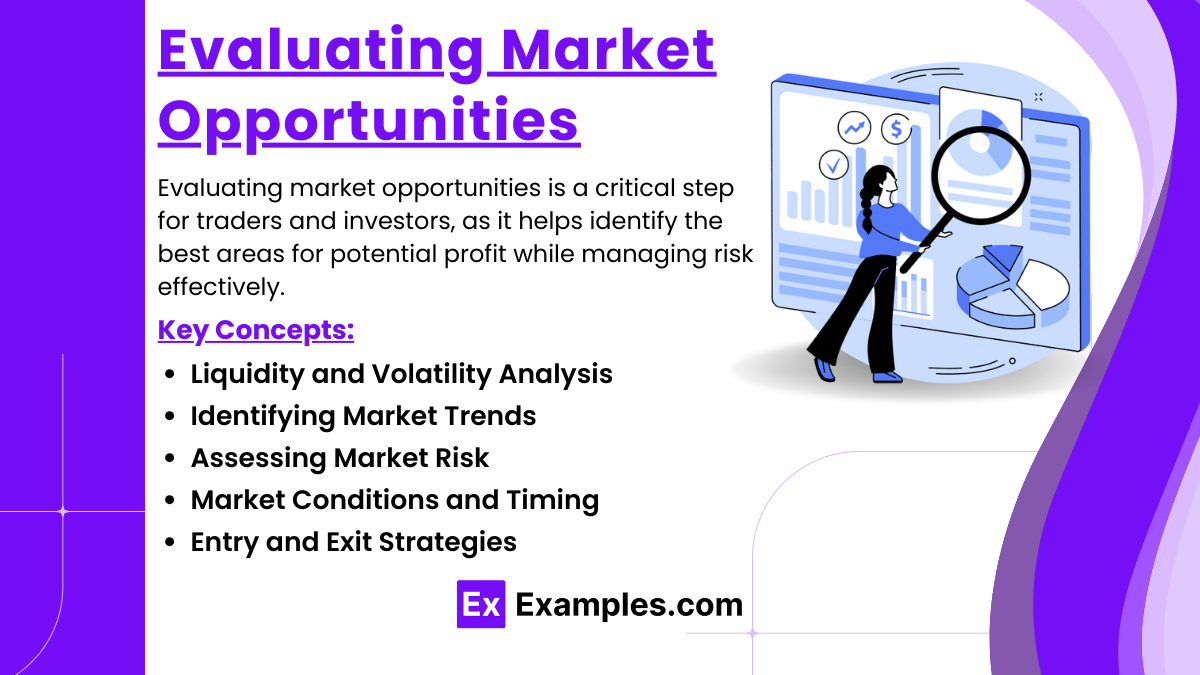
Evaluating market opportunities is a critical step for traders and investors, as it helps identify the best areas for potential profit while managing risk effectively. This involves analyzing market characteristics such as liquidity, volatility, trends, and market conditions. Here is a detailed explanation of key components:
- Liquidity and Volatility Analysis
Liquidity refers to the ease with which an asset can be bought or sold without significantly impacting its price. High liquidity indicates that a market or asset has many buyers and sellers, making transactions smoother and less costly. Conversely, low liquidity may lead to large price swings with even small trades. Volatility measures the degree of variation in asset prices over time. High volatility can offer trading opportunities due to rapid price changes but also poses greater risk. Understanding liquidity and volatility helps traders decide which markets or assets align with their risk tolerance and investment goals. - Identifying Market Trends
Analyzing market trends is essential for making informed trading and investment decisions. Trends represent the general direction of market movement, which can be upward (bullish), downward (bearish), or sideways (ranging). Technical tools such as moving averages, trendlines, and momentum indicators help identify trends and determine their strength. Recognizing trends early allows traders to align their positions with market direction, maximizing potential returns and minimizing risk. - Assessing Market Risk
Every market opportunity comes with inherent risks. Market risk evaluation involves analyzing factors that could adversely affect asset prices, such as economic downturns, political events, or changes in interest rates. Technical indicators, volatility metrics (e.g., Average True Range), and risk assessment models can help quantify potential risks and inform trading strategies. Proper risk assessment ensures that market opportunities are pursued within acceptable levels of risk exposure. - Market Conditions and Timing
Market conditions can vary widely, impacting the effectiveness of trading strategies. For instance, different approaches may be needed during a highly volatile market compared to a stable, trending market. Timing is crucial; traders must identify the best moments to enter or exit positions based on market conditions. Strategies such as swing trading, day trading, or long-term investing rely on accurate timing to capitalize on market movements and reduce exposure to adverse conditions. - Entry and Exit Strategies
Identifying market opportunities also involves planning entry and exit strategies. This includes setting stop-loss orders to minimize potential losses and take-profit levels to lock in gains. Entry and exit decisions are often based on technical signals such as breakouts, reversals, or momentum shifts. Having a clear plan in place reduces emotional decision-making and enhances the likelihood of success.
Selection Criteria for Trading and Investing Issues
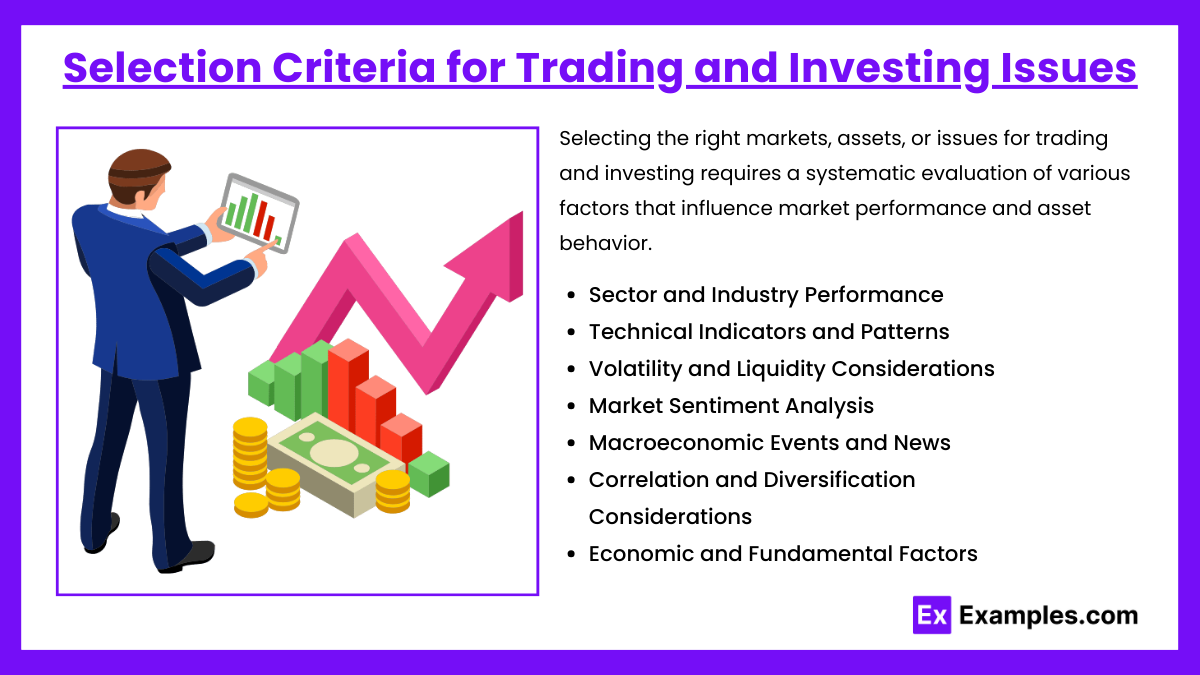
Selecting the right markets, assets, or issues for trading and investing requires a systematic evaluation of various factors that influence market performance and asset behavior. The following criteria are crucial for identifying profitable opportunities and optimizing investment decisions:
- Economic and Fundamental Factors
Fundamental analysis involves examining the economic and financial factors that influence an asset’s intrinsic value. Key indicators include GDP growth, interest rates, inflation, corporate earnings, and industry-specific metrics. For example, a strong earnings report may indicate a company’s growth potential, while rising interest rates might affect bond prices. Evaluating these factors helps traders and investors identify assets with strong fundamentals that align with their strategies. - Sector and Industry Performance
Analyzing sector and industry performance is vital for identifying assets that are likely to benefit from broader market or economic trends. For instance, during a technology boom, technology stocks may outperform other sectors. Conversely, defensive sectors like utilities may be more appealing during economic downturns. Understanding how specific sectors are performing relative to the overall market enables traders to make strategic asset selections. - Technical Indicators and Patterns
Technical analysis uses price charts, indicators, and patterns to evaluate asset behavior. Indicators such as moving averages, Relative Strength Index (RSI), and Bollinger Bands help assess momentum, trends, and potential reversals. Chart patterns like head-and-shoulders, triangles, or double tops/bottoms provide visual cues about potential market moves. By leveraging these tools, traders can time their trades and select assets that exhibit favorable technical characteristics. - Market Sentiment Analysis
Market sentiment reflects the collective emotions and attitudes of investors toward a particular market or asset. Sentiment can be bullish (positive), bearish (negative), or neutral. Tools such as the CBOE Volatility Index (VIX), put-call ratios, and social media trends help gauge market sentiment. Understanding sentiment allows traders to align their strategies with prevailing market attitudes, anticipating potential shifts that could influence asset prices. - Volatility and Liquidity Considerations
The selection process should account for the volatility and liquidity of potential assets. High volatility may offer more trading opportunities due to frequent price swings but comes with increased risk. High liquidity ensures that assets can be quickly bought or sold without significantly affecting prices. Balancing these factors helps traders optimize their risk-return profiles based on their objectives and risk tolerance. - Macroeconomic Events and News
Major macroeconomic events, such as central bank announcements, geopolitical developments, or economic data releases, can have a significant impact on markets. Traders need to monitor such events to anticipate potential market reactions and adjust their asset selections accordingly. News-driven trading opportunities often present themselves quickly, requiring a rapid response to capitalize on price movements. - Correlation and Diversification Considerations
Evaluating the correlation between selected assets is important for portfolio diversification. Highly correlated assets tend to move in tandem, potentially increasing portfolio risk. Selecting assets with low or negative correlations can reduce overall portfolio volatility and enhance long-term returns.
Technical Tools for Screening and Ranking Markets
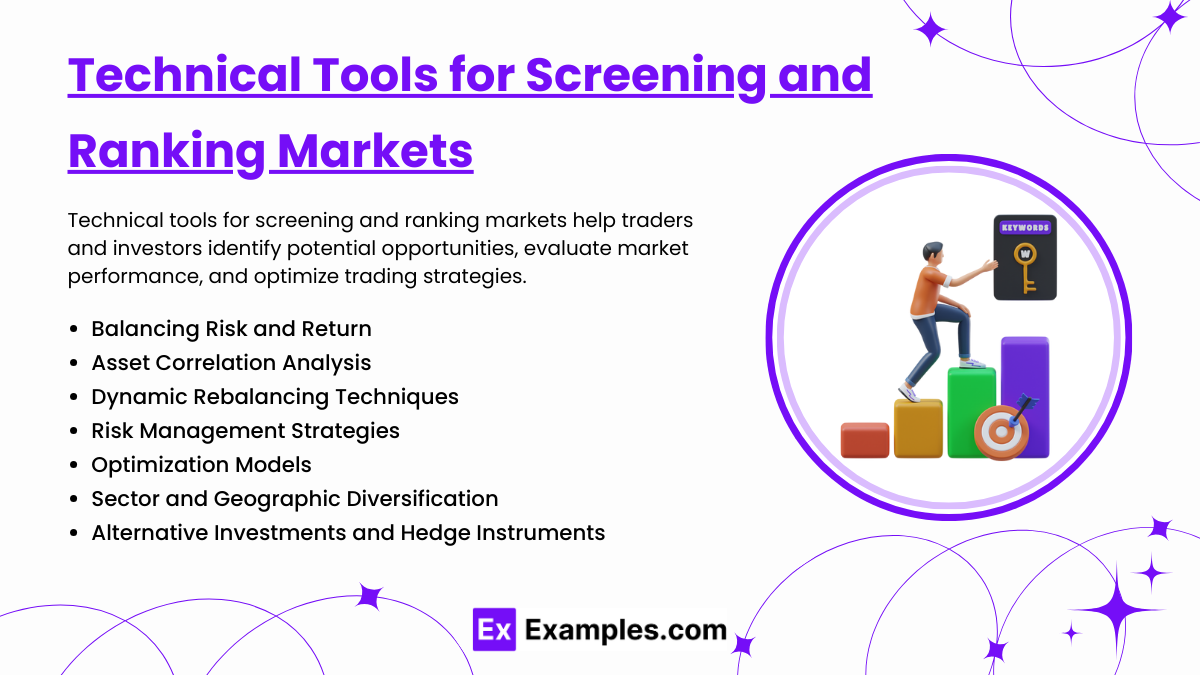
Technical tools for screening and ranking markets help traders and investors identify potential opportunities, evaluate market performance, and optimize trading strategies. By leveraging these tools, analysts can systematically narrow down a broad universe of assets to a manageable list of high-potential opportunities. Here’s an explanation of the key technical tools used:
- Market Screening Techniques
Screening tools allow traders to filter assets based on specific criteria such as price performance, volume, volatility, market capitalization, or technical indicators. For example, a trader may screen for stocks with a Relative Strength Index (RSI) above 70 to identify overbought conditions or those with a moving average crossover signal. Screeners can be customized to align with specific strategies, providing a quick and efficient way to identify assets that meet predefined conditions. - Ranking and Comparison Tools
After screening, assets can be ranked based on specific criteria to prioritize those with the highest potential. For example, a trader may rank stocks by their momentum strength, earnings growth rate, or risk-adjusted returns. By comparing assets on multiple dimensions, analysts can determine which ones offer the best combination of risk and reward, helping them make more informed investment decisions. - Quantitative Models and Algorithms
Advanced quantitative models, such as factor-based models, regression analysis, and algorithmic trading systems, help screen and rank markets with greater precision. Quantitative models use historical data and mathematical formulas to identify relationships, predict future performance, and assess market trends. Algorithmic trading systems can automatically scan markets for specific patterns or conditions, providing real-time alerts and trade signals. - Technical Indicators and Metrics
Commonly used technical indicators, such as moving averages, Bollinger Bands, MACD (Moving Average Convergence Divergence), and ATR (Average True Range), offer valuable insights into market conditions and asset performance. Indicators can help identify trends, volatility, momentum, and potential reversals. Screening tools can filter assets based on these indicators to identify those exhibiting favorable conditions for trading or investing. - Backtesting and Optimization
Backtesting allows traders to test screening criteria and ranking models against historical data to evaluate their effectiveness. By simulating past performance, traders can identify which criteria and models lead to the best results and refine their approach accordingly. Optimization ensures that the screening and ranking tools continue to perform well in changing market conditions, reducing the risk of relying on outdated strategies. - Heatmaps and Visualizations
Visual tools, such as heatmaps, provide a quick and intuitive way to compare market performance across different assets or sectors. Heatmaps use color-coding to highlight assets with strong or weak performance, making it easy to spot trends and potential opportunities at a glance. For example, a heatmap might show sectors with the highest gains, helping traders target outperforming industries. - Correlation Analysis Tools
Correlation tools help traders understand how different assets move relative to each other. High correlations may indicate limited diversification opportunities, while low or negative correlations can enhance portfolio stability. Screening for assets with specific correlation characteristics enables better portfolio construction and market selection strategies. - Market Sentiment Indicators
Sentiment indicators, such as the VIX (Volatility Index), put-call ratios, and social media sentiment trackers, provide additional context for market screening. By gauging market sentiment, traders can assess whether conditions are bullish, bearish, or neutral and adjust their asset selection accordingly. This helps in identifying assets that align with prevailing market trends.
Portfolio Diversification and Optimization Strategies
Portfolio diversification and optimization are essential techniques in managing risk and maximizing returns in trading and investing. These strategies involve distributing investments across various assets or asset classes to reduce exposure to individual asset volatility while optimizing for the best risk-adjusted returns. Here is an in-depth explanation of these concepts:
- Balancing Risk and Return
The primary goal of diversification is to strike a balance between risk and return. By investing in a mix of assets that do not move in the same direction, traders can reduce overall portfolio volatility. For example, holding a combination of stocks, bonds, commodities, and cash reduces the impact of a downturn in any one asset class. The objective is to optimize returns while keeping risk within acceptable limits, enhancing the portfolio’s overall performance. - Asset Correlation Analysis
Correlation measures how assets move relative to one another. Positive correlation indicates that assets move in the same direction, while negative correlation suggests they move in opposite directions. Diversifying a portfolio by including assets with low or negative correlations can reduce risk and smooth out returns. For example, combining stocks with commodities or bonds often provides a hedge against market downturns, as these assets typically react differently to market conditions. - Dynamic Rebalancing Techniques
Market conditions change over time, which can alter the risk and return profile of a portfolio. Dynamic rebalancing involves periodically adjusting the portfolio to bring asset allocations back in line with the desired target. This may involve selling assets that have grown in value to lock in gains and reinvesting in underperforming or undervalued assets to maintain diversification and optimize returns. Rebalancing ensures the portfolio continues to align with the investor’s goals and risk tolerance. - Risk Management Strategies
Effective portfolio diversification is closely tied to risk management. Techniques such as value-at-risk (VaR) calculations, scenario analysis, and stress testing help quantify and manage portfolio risks. By understanding the potential impact of market events on the portfolio, traders can implement hedging strategies, such as options and derivatives, to protect against adverse market movements. Diversification helps mitigate unsystematic risk (specific to individual assets), but systematic risk (market-wide risk) requires careful hedging and risk controls. - Optimization Models
Mathematical optimization models, such as the mean-variance optimization framework introduced by Harry Markowitz, help construct efficient portfolios that maximize expected returns for a given level of risk. By evaluating the expected return, variance, and covariance of assets in a portfolio, the model identifies the “efficient frontier” – a set of optimal portfolios offering the highest returns for a given risk level. Optimization models guide asset allocation decisions and enhance portfolio performance. - Sector and Geographic Diversification
Diversifying across different sectors and geographic regions provides further protection against localized market events. For instance, holding stocks from different industries (technology, healthcare, consumer goods) and regions (U.S., Europe, Asia) can reduce the impact of sector-specific downturns or geopolitical risks. Geographic diversification also captures growth opportunities in emerging markets and economies with different economic cycles. - Alternative Investments and Hedge Instruments
Incorporating alternative investments, such as real estate, private equity, hedge funds, or commodities, provides additional diversification beyond traditional asset classes like stocks and bonds. Hedge instruments like options and futures offer protection against downside risks while potentially enhancing returns. These tools can be tailored to suit an investor’s goals, risk appetite, and market outlook. - Case Studies and Real-World Applications
Practical examples of portfolio diversification and optimization often involve analyzing how diversified portfolios perform during market crises compared to concentrated portfolios. For instance, during financial downturns, portfolios diversified with bonds and defensive stocks tend to perform better than those concentrated solely in equities. Real-world applications illustrate how optimization strategies reduce losses and provide more consistent returns.
Examples
Example 1: Sector Rotation Strategy
An analyst uses economic indicators to determine that the economy is entering a growth phase. Based on this analysis, they select technology and consumer discretionary sectors, as these tend to perform well during expansions. This sector-focused market selection helps maximize returns as market conditions evolve.
Example 2: Volatility-Based Asset Selection
A trader analyzes the volatility of different assets using indicators like the Average True Range (ATR) and Bollinger Bands. They select assets with high volatility for short-term trading opportunities and lower-volatility assets for stable, long-term investments, aligning with their risk tolerance and trading strategy.
Example 3: Technical Screening for Momentum Stocks
Using a technical screener, an investor filters for stocks that have recently crossed above their 50-day moving average with strong Relative Strength Index (RSI) readings. This screening identifies momentum stocks with strong upward trends, suitable for swing trading or short-term gains.
Example 4: Sentiment-Driven Market Selection
An analyst evaluates market sentiment using tools like the VIX (Volatility Index) and social media sentiment analysis. When sentiment shifts to extreme fear, they identify defensive stocks and assets such as utilities and bonds, which typically perform well in risk-averse markets.
Example 5: Global Market Diversification
A portfolio manager analyzes geopolitical and economic conditions in different regions and selects a mix of U.S., European, and Asian equities to diversify geographic exposure. This strategy mitigates the impact of localized risks and capitalizes on growth opportunities across various markets.
Practice Questions
Question 1
What is a primary consideration when selecting a market or issue for trading?
A) The market’s historical trading volume only
B) The asset’s liquidity and volatility
C) The number of competitors in the market
D) The age of the company or asset
Answer: B) The asset’s liquidity and volatility
Explanation:
Liquidity and volatility are crucial factors when selecting markets or assets for trading. High liquidity ensures ease of buying and selling, while volatility provides potential profit opportunities through price movements. Historical volume and other factors may matter, but liquidity and volatility directly affect trading effectiveness and risk management.
Question 2
Which of the following best describes why market sentiment is important in selecting trading issues?
A) It is solely based on fundamental analysis
B) It predicts macroeconomic trends
C) It provides insights into prevailing investor attitudes
D) It always leads to profitable trades
Answer: C) It provides insights into prevailing investor attitudes
Explanation:
Market sentiment reflects the collective emotions and attitudes of investors, which can drive price movements and influence market trends. By understanding sentiment, traders can anticipate shifts in market direction and adjust their strategies accordingly. It complements other analyses and helps gauge overall market behavior, even though it does not guarantee profits.
Question 3
Why is sector performance analysis important when selecting markets for investment?
A) It helps investors avoid all risks
B) It ensures all chosen assets perform identically
C) Different sectors may perform differently under various economic conditions
D) Sector performance is irrelevant to asset selection
Answer: C) Different sectors may perform differently under various economic conditions
Explanation:
Sector performance can vary based on economic cycles, policy changes, and macroeconomic factors. For example, defensive sectors like utilities may outperform during downturns, while growth sectors like technology may lead during expansions. Analyzing sector performance helps traders select assets aligned with prevailing or expected market conditions.

