Preparing for the CMT Exam requires a solid grasp of “A Stock Market Model,” encompassing the theoretical and practical aspects of market dynamics. This includes understanding market cycles, patterns, investor behaviors, and statistical modeling techniques. Proficiency in analyzing market trends and data-driven strategies is crucial for navigating complex market movements effectively.
Learning Objective
In studying “A Stock Market Model” for the CMT Level 2 Exam, you should develop a deep understanding of market modeling techniques covered in Section V: Technical Methods and Market Selection. Focus on methods such as cycle analysis, statistical and quantitative models, and market trend forecasting. Evaluate how these techniques assist in interpreting market movements, identifying potential trading opportunities, and making data-driven decisions. Analyze principles like time series analysis, support and resistance modeling, and sector rotation. Additionally, explore how these models are applied to market selection strategies and enhance your ability to assess market conditions, investor sentiment, and price action dynamics.
Market Modeling Techniques

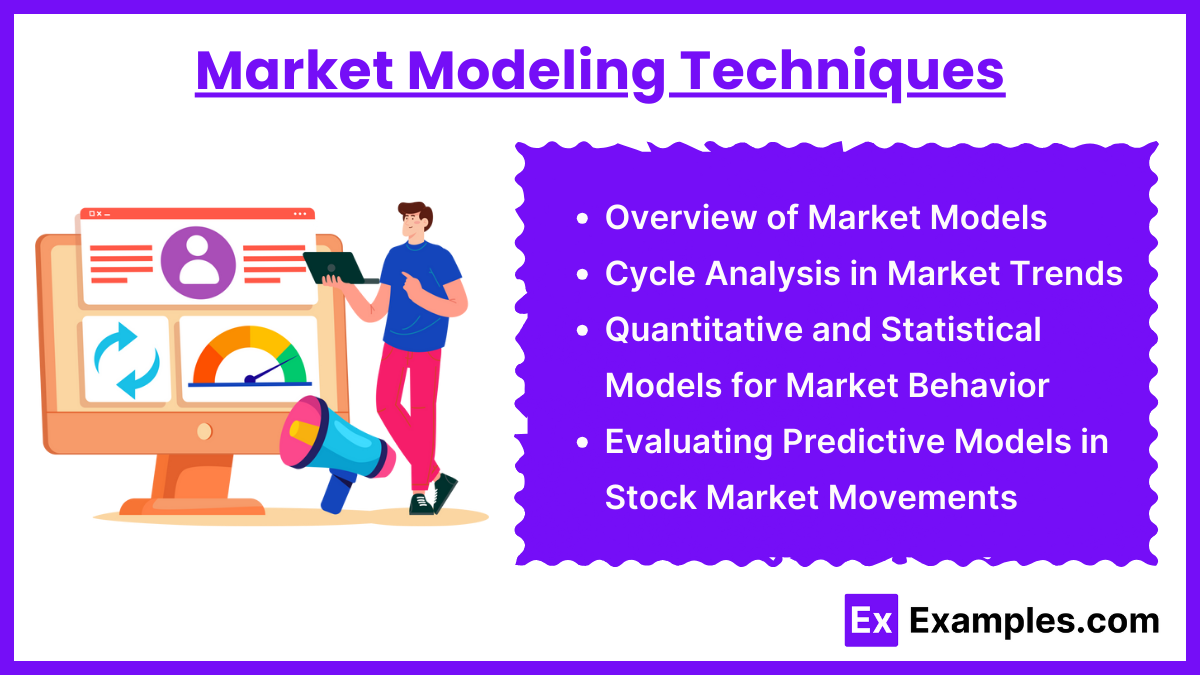
Market modeling techniques are critical tools used to analyze and predict stock market behavior by applying various statistical and quantitative approaches. These techniques aim to identify patterns, cycles, and trends that guide trading strategies and investment decisions. Here’s a breakdown of key components:
- Overview of Market Models: Market models are frameworks used to understand and forecast market movements. They can range from simple trend-following models to complex quantitative systems incorporating multiple variables. The goal is to provide a systematic way to analyze market data and predict potential future behavior.
- Cycle Analysis in Market Trends: This technique involves identifying recurring patterns or cycles in market data, such as seasonal fluctuations, economic cycles, or other repeating intervals. Understanding these cycles can help traders anticipate market reversals, continuation patterns, and optimal entry and exit points.
- Quantitative and Statistical Models for Market Behavior: Quantitative models rely on mathematical calculations, statistics, and data analysis to evaluate market movements. Techniques include regression analysis, moving averages, mean reversion models, and machine learning algorithms. These methods help identify relationships, trends, and potential signals based on historical data.
- Evaluating Predictive Models in Stock Market Movements: Predictive modeling aims to forecast future market behavior based on historical trends, current market conditions, and quantitative indicators. By testing model accuracy and making necessary adjustments, traders and analysts can enhance their decision-making process and adapt their strategies in response to changing market conditions.
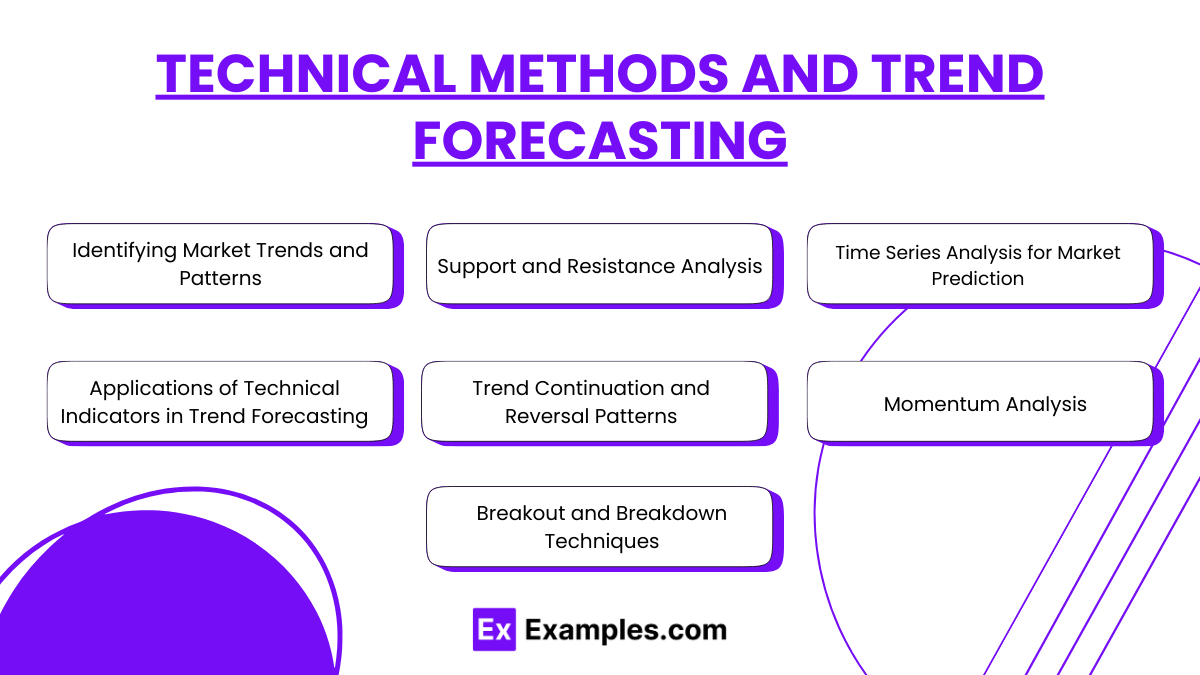
Technical Methods and Trend Forecasting

- Identifying Market Trends and Patterns: This involves analyzing historical data to determine prevailing market directions (uptrend, downtrend, or sideways movement) using tools such as moving averages, trendlines, and momentum indicators.
- Support and Resistance Analysis: Support levels are price points where a downward trend may pause due to demand concentration, while resistance levels indicate potential barriers for upward movement. Recognizing these levels helps predict price reversals and manage entry and exit points.
- Time Series Analysis for Market Prediction: This statistical technique analyzes time-based data points to identify patterns, correlations, and trends over specific periods. Techniques like exponential smoothing and autoregressive integrated moving average (ARIMA) models can predict future price movements.
- Applications of Technical Indicators in Trend Forecasting: This involves the use of indicators such as Moving Average Convergence Divergence (MACD), Relative Strength Index (RSI), Bollinger Bands, and others to identify market trends, momentum, and potential reversals.
- Trend Continuation and Reversal Patterns: Understanding chart patterns like head and shoulders, double tops/bottoms, flags, and pennants helps traders forecast the continuation or reversal of trends and make data-driven decisions.
- Momentum Analysis: This focuses on evaluating the speed and strength of market movements using momentum indicators such as RSI, Stochastic Oscillators, and Moving Averages, aiding traders in identifying overbought or oversold market conditions.
- Breakout and Breakdown Techniques: Recognizing price breakouts (above resistance) or breakdowns (below support) is crucial in trend forecasting. Breakouts often signal strong movements, while breakdowns may indicate bearish trends.
Market Selection Strategies

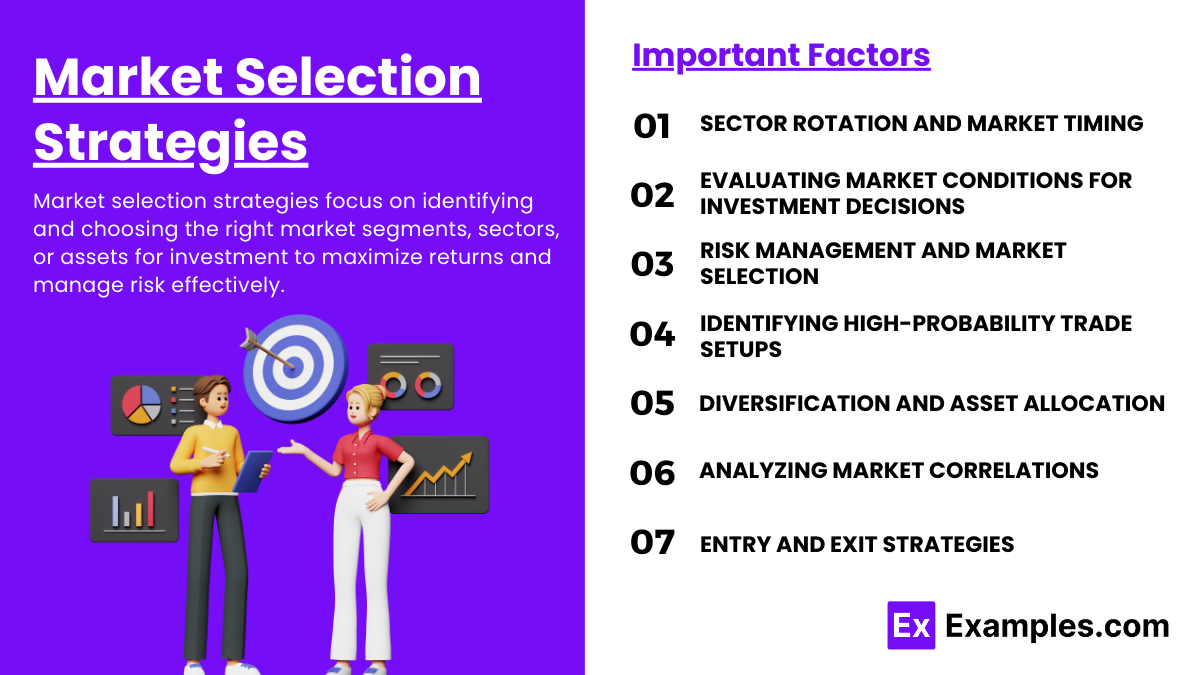
Market selection strategies focus on identifying and choosing the right market segments, sectors, or assets for investment to maximize returns and manage risk effectively. This involves using technical, fundamental, and quantitative analysis to evaluate market conditions, trends, and investment opportunities. Here’s a detailed explanation of key components:
- Sector Rotation and Market Timing: Sector rotation involves shifting investments between different sectors of the market based on economic cycles, market phases, and industry performance. For example, during economic expansion, cyclical sectors like consumer discretionary or technology might outperform, while defensive sectors like utilities may do better during recessions. Effective market timing is critical for maximizing gains and minimizing losses.
- Evaluating Market Conditions for Investment Decisions: This involves analyzing various macroeconomic indicators (such as GDP growth, inflation rates, and employment data), global market trends, and geopolitical events. By understanding these factors, traders and investors can better anticipate market movements and select investment opportunities that align with prevailing market conditions.
- Risk Management and Market Selection: Effective market selection goes hand-in-hand with risk management strategies. Techniques such as setting stop-loss levels, position sizing, and portfolio diversification help mitigate risks. Risk management ensures that potential losses are controlled while providing a safety net to preserve capital during volatile market conditions.
- Identifying High-Probability Trade Setups: This strategy involves analyzing historical data, technical indicators, chart patterns, and market trends to identify trade setups with a high probability of success. High-probability setups increase the likelihood of achieving profitable trades and are based on rigorous data analysis and testing.
- Diversification and Asset Allocation: Diversification spreads investments across multiple sectors, asset classes, or geographical regions to reduce overall risk exposure. Strategic asset allocation ensures that capital is distributed based on an investor’s risk tolerance, time horizon, and investment goals, enhancing portfolio stability and reducing market volatility impacts.
- Analyzing Market Correlations: Understanding the correlations between different markets, assets, or sectors helps investors manage portfolio risk. For example, knowing that two assets move in opposite directions can provide a hedge against potential losses. This analysis reveals complementary or inverse relationships that can be leveraged for better risk-adjusted returns.
- Entry and Exit Strategies: Effective market selection strategies require precise entry and exit timing to maximize gains and minimize losses. Entry strategies such as breakouts or pullbacks help initiate trades at optimal points, while exit strategies like trailing stop losses and target profit levels ensure profits are secured and losses are minimized.
Application and Interpretation

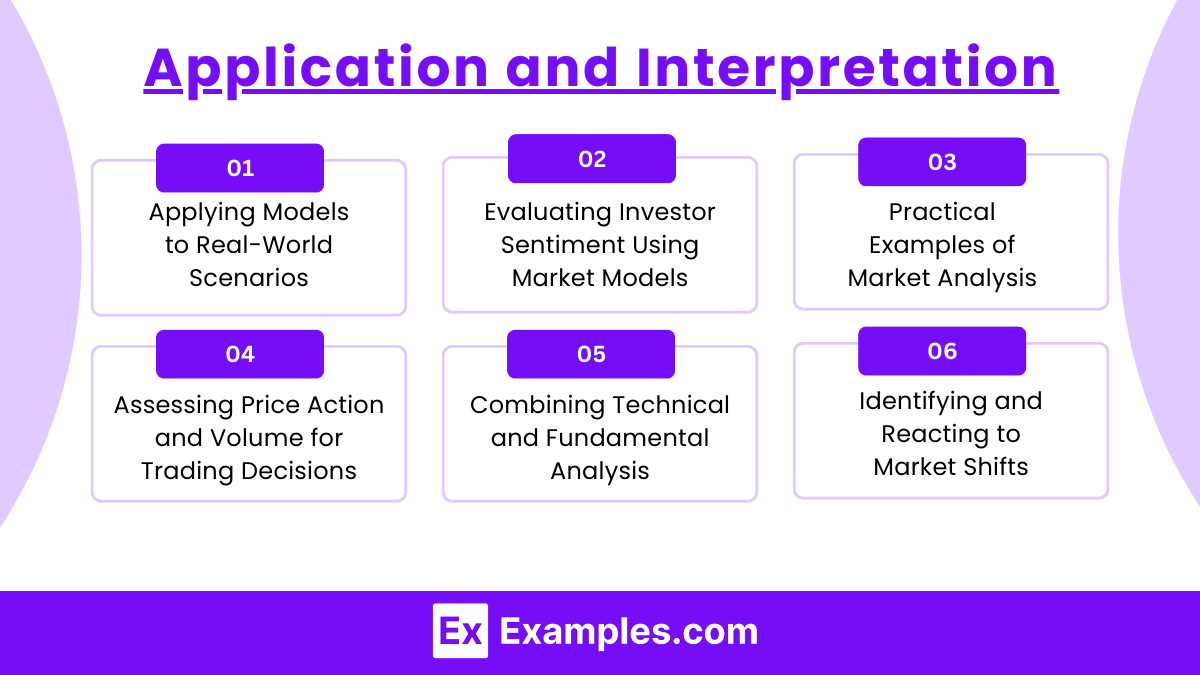
Application and interpretation of market models and technical methods are essential for effectively translating theoretical market analysis into actionable trading strategies. This involves using various models, data, and analytical techniques to understand market behavior, make informed investment decisions, and respond to real-world market dynamics. Here’s an in-depth look at this key area:
- Applying Models to Real-World Scenarios: Market models, such as trend-following or mean-reversion models, need to be applied to real-world market data for effective trading. This involves backtesting models on historical data to assess their performance and adjusting parameters based on market conditions. Successful application ensures that theoretical concepts are relevant and effective in practical trading environments.
- Evaluating Investor Sentiment Using Market Models: Understanding investor sentiment is crucial for interpreting market behavior. Sentiment indicators, such as the Volatility Index (VIX) or market sentiment surveys, provide insight into crowd behavior, fear, and greed in the market. Analyzing sentiment alongside technical models helps traders gauge market conditions and predict shifts in trends or reversals.
- Practical Examples of Market Analysis: Analyzing historical case studies or real-world examples of market movements allows traders to understand how different models performed under specific conditions, such as market crashes, bull runs, or significant economic events. These examples provide context and insights into how models can be adapted to respond to changing market dynamics.
- Assessing Price Action and Volume for Trading Decisions: Price action analysis focuses on interpreting past market data, such as price movements and candlestick patterns, without relying solely on technical indicators. Combining this with volume analysis helps traders determine market strength, identify accumulation or distribution phases, and predict potential reversals or continuations in market trends.
- Combining Technical and Fundamental Analysis: While technical analysis focuses on price trends and chart patterns, combining it with fundamental data (such as earnings reports, economic indicators, and news releases) provides a comprehensive view of market conditions. This integrated approach enables traders to validate signals, gain a holistic understanding of the market, and improve decision-making accuracy.
- Identifying and Reacting to Market Shifts: Rapid changes in market conditions, such as trend reversals, economic news releases, or geopolitical events, require quick adaptation of trading strategies. Technical models and tools help traders recognize market shifts and adjust their positions to mitigate risks and capitalize on opportunities.
- Developing Custom Models for Personalized Strategies: Traders can enhance their performance by customizing market models to align with their individual trading styles, risk tolerance, and market preferences. Custom models often blend different technical indicators, statistical analysis, and machine learning algorithms to optimize decision-making and improve trading outcomes.
Examples
Example 1: Cycle Analysis in Market Trends
Utilizing cycle analysis, traders identify recurring patterns, such as seasonal trends or economic cycles, to anticipate price movements. For instance, examining the presidential cycle theory helps forecast market behavior based on historical election periods, aiding in making informed investment decisions based on predictable cycles.
Example 2: Support and Resistance Levels
A stock market model that focuses on support and resistance levels helps identify price points where supply and demand may shift market trends. Traders use these levels to make decisions on when to enter or exit positions, minimizing risk and maximizing profit potential.
Example 3: Sentiment Analysis
Integrating sentiment indicators like the Volatility Index (VIX) allows traders to gauge market fear and greed. When sentiment turns overly optimistic or pessimistic, traders may anticipate reversals and use this data-driven approach to enhance their market timing strategies.
Example 4: Quantitative Modeling and Trend Following
By employing quantitative modeling techniques such as moving averages or exponential moving average (EMA) crossovers, traders can create trend-following models. This model systematically identifies market trends and generates buy or sell signals based on predetermined conditions.
Example 5: Sector Rotation Strategy
A stock market model based on sector rotation focuses on adjusting asset allocation based on market cycles and economic conditions. For example, during periods of economic growth, traders may favor cyclical stocks, whereas, during downturns, defensive sectors may be prioritized.
Practice Questions
Question 1:
Which of the following best describes the purpose of using cycle analysis in a stock market model?
A) To identify support and resistance levels for short-term trades
B) To understand recurring market patterns and forecast potential price movements
C) To determine correlations between different asset classes
D) To measure investor sentiment and predict market reversals
Answer: B) To understand recurring market patterns and forecast potential price movements
Explanation:
Cycle analysis focuses on identifying recurring patterns or cycles in the market, such as economic or seasonal trends, to predict future market movements. By understanding these patterns, traders can make informed decisions about when to enter or exit trades. It differs from measuring correlations between assets (C) or identifying support and resistance levels (A), and while it can be tangentially related to investor sentiment (D), its primary goal is to analyze recurring market patterns.
Question 2:
What is the main role of support and resistance levels in technical market models?
A) To measure the overall market trend direction
B) To help determine optimal entry and exit points for trades
C) To identify cycles within the broader market framework
D) To analyze fundamental factors like company earnings
Answer: B) To help determine optimal entry and exit points for trades
Explanation:
Support and resistance levels represent price points where demand and supply dynamics are expected to cause market reversals or slowdowns. They are used by traders to determine optimal entry and exit points, providing signals to enter a trade when prices approach support levels or to exit when resistance levels are tested. These levels are not designed to measure overall market trends (A), analyze cycles (C), or focus on fundamental factors like earnings (D).
Question 3:
Which of the following is a primary benefit of using sentiment analysis in a stock market model?
A) To provide precise calculations of expected returns for each stock
B) To improve market timing by gauging collective market emotions
C) To eliminate market volatility by predicting economic cycles
D) To ensure optimal sector rotation based on historical patterns
Answer: B) To improve market timing by gauging collective market emotions
Explanation:
Sentiment analysis focuses on understanding market emotions, such as fear and greed, through sentiment indicators like the Volatility Index (VIX). This helps traders improve market timing by gauging when the market is overly optimistic or pessimistic, potentially signaling trend reversals. It does not provide precise return calculations (A) or directly eliminate market volatility (C). Sector rotation (D) is unrelated to sentiment analysis, as it primarily focuses on market cycles and economic conditions.


