Preparing for the CMT Exam requires a comprehensive understanding of “Theories of Nonrandom Price Motion,” a crucial component of technical analysis. Mastery of theories such as market efficiency, random walk, and behavioral finance is essential. This knowledge provides insights into market anomalies, investor behavior, and predictive trends, critical for achieving a high CMT score.
Learning Objective
In studying “Theories of Nonrandom Price Motion” for the CMT Exam, you should learn to understand the core concepts that challenge the random walk hypothesis, such as behavioral finance and market anomalies. Analyze how psychological factors and irrational market behaviors influence price movements, deviating from theoretical efficiency. Evaluate the principles behind key theories like behavioral finance, fractal market hypothesis, and Elliott Wave Theory. Additionally, explore how these theories can be applied to real-world market analysis to predict price movements more effectively. Apply this knowledge to develop trading strategies that capitalize on patterns created by nonrandom price behaviors observed in historical market data.
Introduction to Nonrandom Price Motion
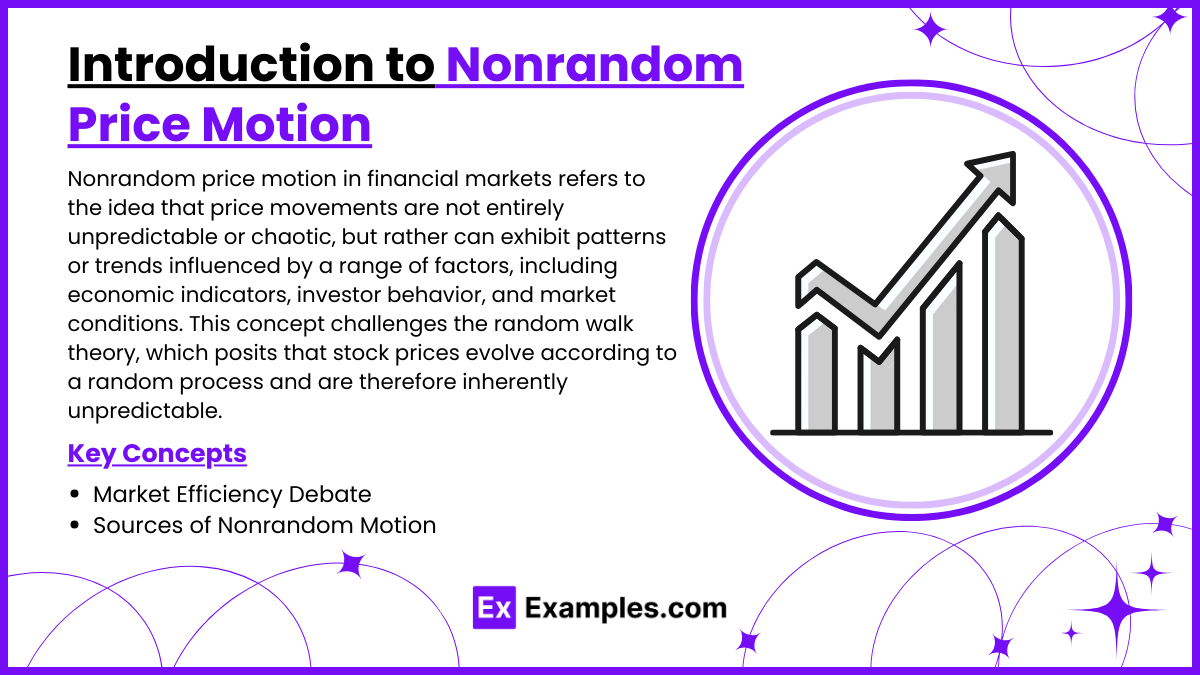
Nonrandom price motion in financial markets refers to the idea that price movements are not entirely unpredictable or chaotic, but rather can exhibit patterns or trends influenced by a range of factors, including economic indicators, investor behavior, and market conditions. This concept challenges the random walk theory, which posits that stock prices evolve according to a random process and are therefore inherently unpredictable. Understanding nonrandom price motion is essential for traders and investors who utilize technical analysis and other strategies to forecast market movements.
Key Concepts of Nonrandom Price Motion:
- Market Efficiency Debate:
- Nonrandom price motion questions the Efficient Market Hypothesis, suggesting that markets may not fully reflect all available information, allowing for predictable price patterns.
- Sources of Nonrandom Motion:
- Economic Data and News: Predictable reactions to significant news or economic indicators.
- Investor Psychology: Behavioral biases lead to anomalies like overreactions or herd behavior.
- Technical Factors: Widespread use of similar trading tools can create self-fulfilling price movements.
Behavioral Finance

Behavioral finance is a field of study that combines psychological theory with conventional economics to explain why people make irrational financial decisions. It challenges the traditional financial theory that assumes markets are efficient and that investors are always rational and utility-maximizing. Here’s an introduction to the key concepts and insights of behavioral finance:
Fundamental Concepts of Behavioral Finance:
- Irrational Behavior: Behavioral finance posits that investors often act irrationally due to cognitive biases and emotions, leading to decisions that deviate from those predicted by classical financial theories.
- Cognitive Biases: These are psychological tendencies that cause deviations from rational judgment. Key biases include:
- Overconfidence: Investors overestimate their knowledge, underestimate risks, and overstate their ability to control events.
- Anchoring: Relying too heavily on the first piece of information received (the “anchor”) when making decisions.
- Confirmation Bias: Focusing on information that confirms pre-existing beliefs and disregarding information that contradicts them.
- Loss Aversion: The tendency for investors to fear losses more than they value gains, impacting their risk assessment and decision-making.
- Heuristics: These are mental shortcuts that simplify decision-making but can lead to systematic errors. Common heuristics include:
- Representativeness: Judging the likelihood of an event by comparing it to an existing prototype in the mind.
- Availability: Estimating the likelihood of an event based on how easily an example can be recalled.
Elliott Wave Theory
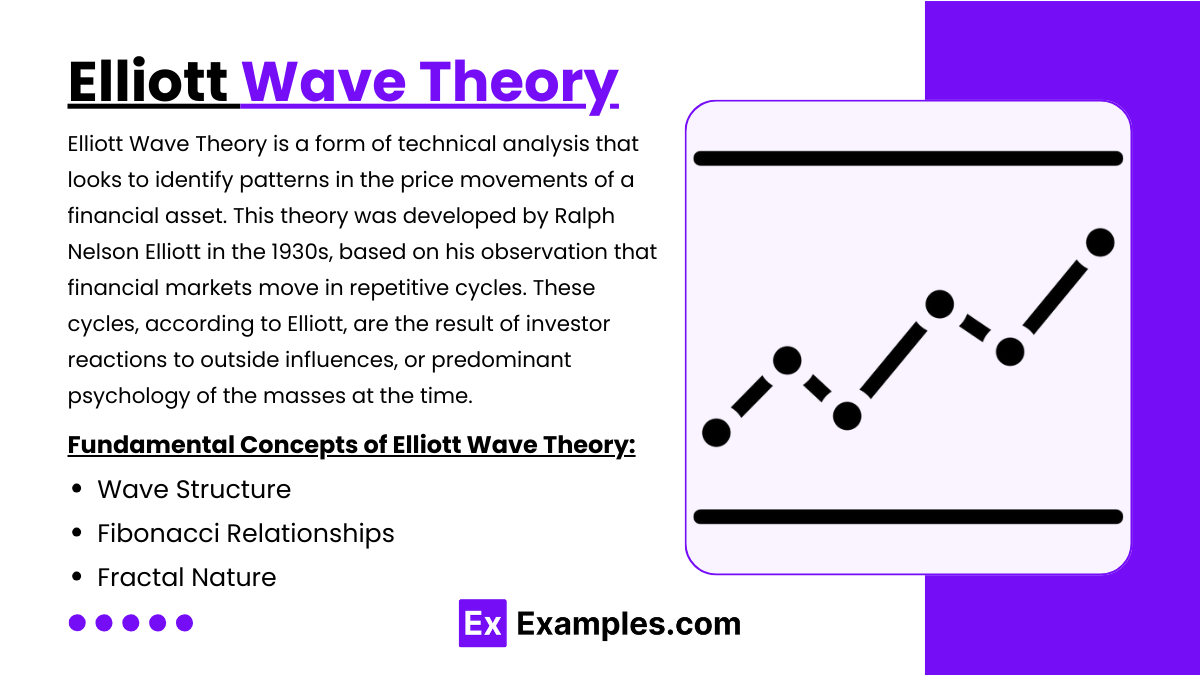
Elliott Wave Theory is a form of technical analysis that looks to identify patterns in the price movements of a financial asset. This theory was developed by Ralph Nelson Elliott in the 1930s, based on his observation that financial markets move in repetitive cycles. These cycles, according to Elliott, are the result of investor reactions to outside influences, or predominant psychology of the masses at the time. Here’s an introduction to the key concepts of Elliott Wave Theory and how it is applied in financial markets:
Fundamental Concepts of Elliott Wave Theory:
- Wave Structure: Elliott proposed that market price movements can be predicted and analyzed in a patterned, repetitive form which he described as waves. The theory states that a main trend usually has five distinct waves, with three waves in the direction of the trend and two corrections against it:
- Impulse Waves: These include waves 1, 3, and 5, which move in the direction of the main trend.
- Corrective Waves: Waves 2 and 4 move against the trend.
- Fibonacci Relationships: Elliott Wave Theory often incorporates Fibonacci ratios to determine the probable extent of the waves. For example, it is common for wave 3 to be the longest and not the shortest among waves 1, 3, and 5, and often extends to 161.8% of wave 1.
- Fractal Nature: The waves are fractal, meaning they can be broken down into smaller wave patterns that mimic the larger visible patterns. This self-similarity is found across different time scales—from minutes to decades.
Implications for Trading and Risk Management
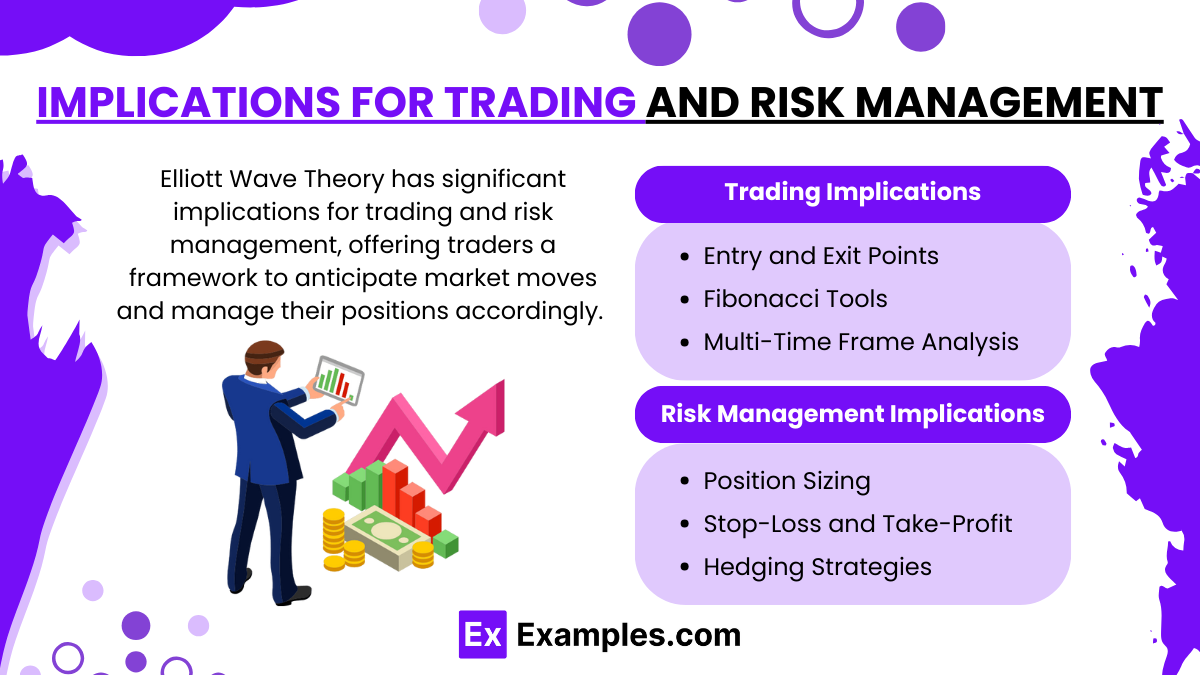
Elliott Wave Theory has significant implications for trading and risk management, offering traders a framework to anticipate market moves and manage their positions accordingly. Here’s an exploration of how Elliott Wave Theory can influence trading strategies and risk management practices:
Trading Implications
- Entry and Exit Points: Elliott Wave helps identify optimal entry and exit points, enhancing potential gains. For instance, entering at the start of impulse waves (waves 1 or 3) and exiting or taking profits at their conclusion can maximize returns.
- Fibonacci Tools: The use of Fibonacci retracement and extension levels can pinpoint potential reversal points, aiding in setting target prices and stop-loss orders based on projected wave endings.
- Multi-Time Frame Analysis: Analyzing wave patterns across different time frames allows for more precise entry and exit decisions, aligning short-term trading actions with long-term wave structures.
Risk Management Implications
- Position Sizing: By understanding where a price is within its Elliott Wave cycle, traders can adjust position sizes to match the risk level of entering near the potential end of a wave.
- Stop-Loss and Take-Profit: Strategic placement of stop-loss orders can protect against the risk of wave misinterpretation, while take-profit orders can be set to capitalize on the completion of predicted waves.
- Hedging Strategies: Options or derivatives can be used to hedge positions around critical points predicted by Elliott Wave, such as near the end of an impulse wave where reversals might occur.
Examples
Example 1: Behavioral Overreactions
Following a better-than-expected earnings announcement, a stock experiences a rapid surge in price due to overly optimistic investor sentiment, only to retract significantly in the following days as rational valuation assessments prevail. This scenario demonstrates the impact of investor psychology and market overreaction, which are core aspects of behavioral finance.
Example 2: Elliott Wave Theory in Forex
A forex trader identifies a potential five-wave uptrend pattern on the EUR/USD currency pair. By predicting the end of the fifth wave, the trader prepares to capitalize on the anticipated corrective three-wave downtrend, illustrating how Elliott Wave Theory can be applied to forecast market movements.
Example 3: January Effect
Small-cap stocks have historically shown a tendency to outperform the broader market in January. A trader uses this anomaly as a basis to buy small-cap stocks in late December and sell them at the end of January, exploiting the seasonal anomaly known as the January Effect.
Example 4: Fractal Patterns in Stock Prices
Using fractal analysis, a technical analyst identifies repeating patterns in the stock price movements of a technology firm. These fractal patterns help predict the timing of significant price changes, allowing the analyst to recommend strategic entry and exit points for traders.
Example 5: Post-Earnings Announcement Drift
A company reports earnings significantly above analyst expectations, yet the stock price does not fully adjust on the announcement day. Observing this, a trader takes a position to capitalize on the gradual price adjustment that occurs over the following weeks, exploiting the market anomaly known as post-earnings announcement drift.
Practice Questions
Question 1
Which theory would best explain why stock prices might follow predictable patterns based on investor psychology?
A. Efficient Market Hypothesis
B. Random Walk Theory
C. Behavioral Finance Theory
D. Capital Asset Pricing Model
Answer:
C. Behavioral Finance Theory
Explanation:
Behavioral Finance Theory suggests that various cognitive biases and emotional responses can lead to predictable but irrational behaviors among investors, which can create identifiable patterns in stock prices. This theory acknowledges that markets are not always efficient and that psychological factors can significantly impact trading decisions.
Question 2
What does Elliott Wave Theory primarily focus on?
A. The impact of macroeconomic data on stock prices
B. Predicting price movements based on past dividend yields
C. Identifying recurring wave patterns in market price charts
D. Calculating the intrinsic value of securities
Answer:
C. Identifying recurring wave patterns in market price charts
Explanation:
Elliott Wave Theory is used to identify recurring wave patterns in market price charts and forecast future market movements by analyzing investor sentiment and psychology manifested in waves. This theory operates under the premise that markets move in repetitive cycles, which reflect the prevailing emotions of the investing populace.
Question 3
Which of the following is an example of a market anomaly that challenges the random walk theory?
A. Continuous compounding of interest rates
B. The January effect
C. Daily dollar cost averaging
D. Long-term capital management
Answer:
B. The January effect
Explanation:
The January effect, where stocks, particularly small-cap stocks, tend to perform better in January than in other months, is a market anomaly that challenges the random walk theory, which posits that price movements are random and not influenced by predictable seasonal factors. This effect suggests that investor behavior and historical patterns can impact stock prices in a non-random way.

