Preparing for the CMT Exam requires a comprehensive understanding of “Hypothesis Tests and Confidence Intervals,” which are foundational tools in statistical analysis. Hypothesis tests involve evaluating a null hypothesis (H₀) against an alternative hypothesis (Hₐ) to assess claims about population parameters, using techniques such as t-tests, z-tests, and chi-square tests to determine statistical significance. Confidence intervals, on the other hand, provide a range of values within which a population parameter is likely to fall, offering a measure of the precision and reliability of an estimate. Together, these methods enable analysts to make data-driven decisions, validate financial strategies, and quantify uncertainty, ensuring statistical rigor in market evaluations.
Learning Objectives
In studying Hypothesis Tests and Confidence Intervals for the CMT Exam, you should learn to understand their significance in statistical analysis for market research and decision-making. Hypothesis testing involves formulating a null and alternative hypothesis, using statistical methods to evaluate market data, and determining the validity of assumptions. Confidence intervals provide a range of values within which a population parameter is expected to fall, offering a measure of precision and reliability. These tools help in identifying trends, testing strategies, and validating market models. Mastery of these concepts ensures accurate analysis, reduced errors, and improved decision-making, which are critical for success in the CMT Exam.
Key Concepts of Hypothesis Tests and Confidence Intervals
Hypothesis Testing
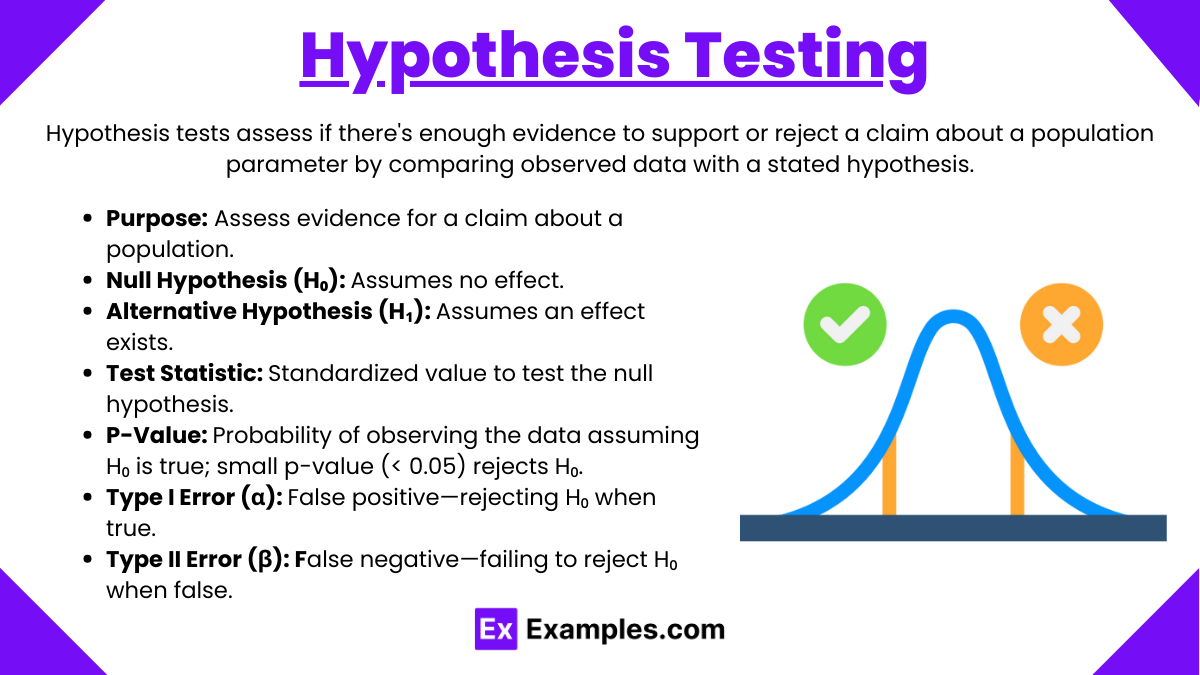
Hypothesis tests evaluate whether there is sufficient evidence to support or reject a claim about a population parameter, using a structured process to compare observed data against a stated hypothesis.
- Purpose: Used to assess whether there is enough statistical evidence to support a specific claim or hypothesis about a population parameter.
- Null Hypothesis (H₀): The assumption that there is no effect or no difference in the population.
- Alternative Hypothesis (H₁ or Ha): The hypothesis that contradicts the null hypothesis, indicating a presence of effect or difference.
- Test Statistic: A standardized value derived from sample data used to assess the evidence against the null hypothesis.
- P-Value: The probability of obtaining a test statistic as extreme as the one observed, assuming the null hypothesis is true. A small p-value (typically ≤ 0.05) leads to rejecting the null hypothesis.
- Type I Error (α): Incorrectly rejecting the null hypothesis when it is true.
- Type II Error (β): Failing to reject the null hypothesis when the alternative hypothesis is true.
Confidence Intervals (CI)
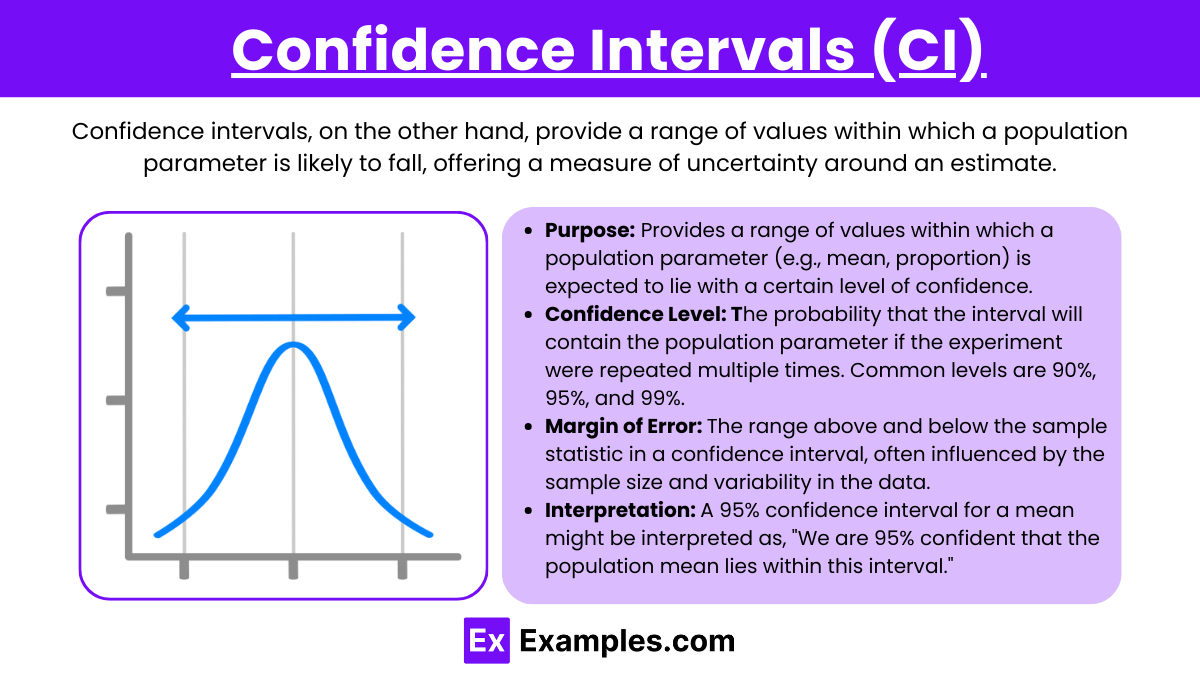
Confidence intervals, on the other hand, provide a range of values within which a population parameter is likely to fall, offering a measure of uncertainty around an estimate.
- Purpose: Provides a range of values within which a population parameter (e.g., mean, proportion) is expected to lie with a certain level of confidence.
- Confidence Level: The probability that the interval will contain the population parameter if the experiment were repeated multiple times. Common levels are 90%, 95%, and 99%.
- Margin of Error: The range above and below the sample statistic in a confidence interval, often influenced by the sample size and variability in the data.
- Interpretation: A 95% confidence interval for a mean might be interpreted as, “We are 95% confident that the population mean lies within this interval.”
Types of Hypothesis Tests and Confidence Intervals
Hypothesis tests and confidence intervals are fundamental concepts in statistical inference used to make conclusions about populations based on sample data. Here are the types of each concept:
Types of Hypothesis Tests
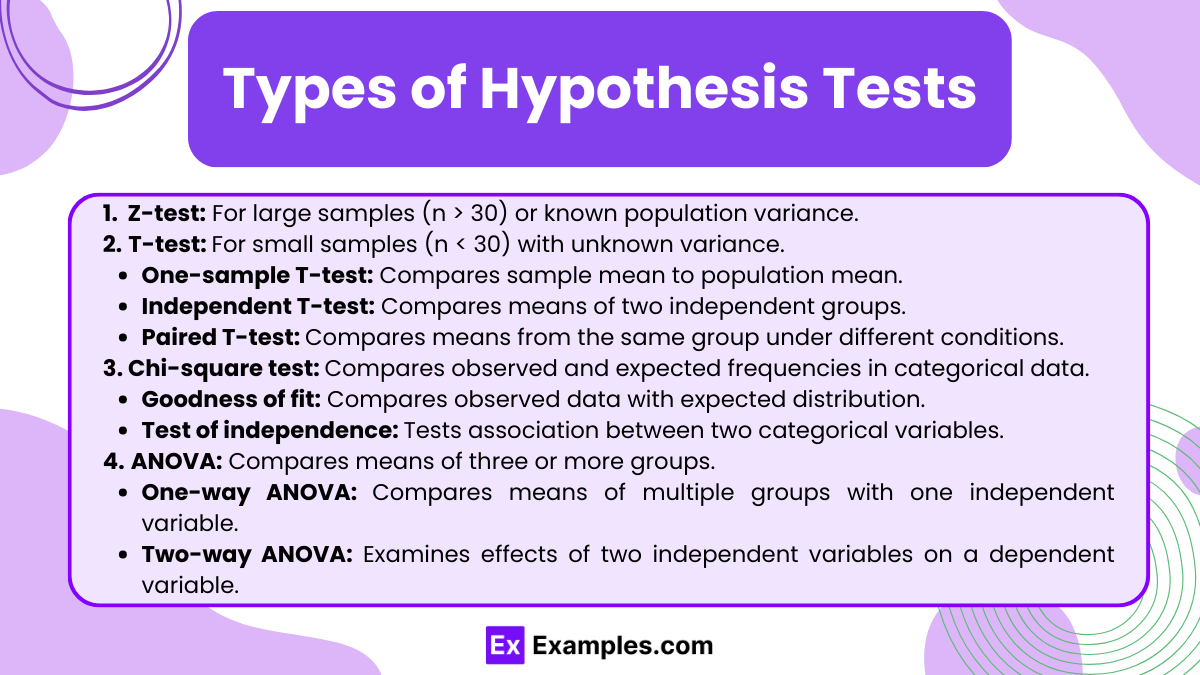
- Z-test: Used when the sample size is large (typically n > 30) or the population variance is known.
- T-test: Applied when the sample size is small (n < 30) and the population variance is unknown.
- One-sample T-test: Compares the sample mean to a known population mean.
- Independent two-sample T-test: Compares the means of two independent groups.
- Paired sample T-test: Compares means from the same group at different times or under different conditions.
- Chi-square test: Used for categorical data to assess how well observed frequencies match expected frequencies.
- Chi-square goodness of fit test: Compares observed data with an expected distribution.
- Chi-square test of independence: Determines if there is an association between two categorical variables.
- ANOVA (Analysis of Variance): Used to compare the means of three or more groups.
- One-way ANOVA: Tests the difference between means of three or more groups based on one independent variable.
- Two-way ANOVA: Examines the effect of two independent variables and their interaction on a dependent variable.
Types of Confidence Intervals
- Confidence Interval for a Mean: Estimates the range of values for a population mean, using either a Z or T distribution depending on sample size and variance knowledge.
- Confidence Interval for a Proportion: Used to estimate the range for a population proportion, typically applied in survey or polling data.
- Confidence Interval for the Difference Between Two Means: Used when comparing two groups, calculating the range of possible values for the difference in population means.
- Confidence Interval for the Difference Between Two Proportions: Similar to the above, but used to compare proportions between two independent groups.
- Confidence Interval for a Regression Coefficient: Estimates the range for the value of a regression coefficient in a linear regression model.
Applications of Hypothesis Tests and Confidence Intervals
Hypothesis tests and confidence intervals are fundamental tools in statistics, widely used in various fields for decision-making and analyzing data. Here are some key applications:
1. Medical Research
- Hypothesis Test: In clinical trials, hypothesis tests are used to determine whether a new drug is effective. A null hypothesis (e.g., the drug has no effect) is tested against an alternative hypothesis (the drug has a significant effect).
- Confidence Interval: Confidence intervals are used to estimate the range of values for a treatment’s effect. For example, researchers might report a 95% confidence interval for the difference in recovery times between two treatments.
2. Quality Control
- Hypothesis Test: Manufacturers often use hypothesis tests to determine whether their products meet a certain standard. For instance, they may test if the average weight of a product deviates from the specified target weight.
- Confidence Interval: Quality analysts use confidence intervals to estimate the average performance or defect rate in a production process, providing a range of values with a specified level of confidence.
3. Marketing
- Hypothesis Test: Companies use hypothesis testing to assess the effectiveness of a new marketing campaign. For example, they might test whether a campaign significantly increases sales compared to the previous period.
- Confidence Interval: Marketers use confidence intervals to estimate customer satisfaction scores or the expected sales increase, providing a range for planning purposes.
4. Social Sciences
- Hypothesis Test: Researchers in psychology, sociology, and economics use hypothesis tests to validate theories or claims. For example, a sociologist might test whether a certain intervention leads to a significant change in behavior.
- Confidence Interval: Confidence intervals help estimate population parameters, such as the average income in a region or the proportion of people exhibiting a particular behavior, giving a range of likely values based on sample data.
5. Business and Finance
- Hypothesis Test: Financial analysts use hypothesis tests to determine if there are significant changes in stock prices after an announcement or event. They test whether observed price movements are statistically significant or just random fluctuations.
- Confidence Interval: In portfolio management, confidence intervals are used to estimate the range of potential returns on investments, helping investors understand the level of uncertainty in projected returns.
6. Education
- Hypothesis Test: Educators and administrators use hypothesis testing to evaluate the effectiveness of educational programs or interventions, such as testing whether a new teaching method improves student test scores compared to the traditional method.
- Confidence Interval: Confidence intervals are used to estimate the average score or performance of students, helping schools or universities understand the level of uncertainty in assessment results.
7. Environmental Studies
- Hypothesis Test: Environmental scientists use hypothesis tests to determine whether a pollution control measure has significantly reduced contamination levels in a water body or air quality.
- Confidence Interval: Environmental studies use confidence intervals to estimate average pollution levels over time, helping policymakers understand the variability and trends in environmental quality.
8. Elections and Polling
- Hypothesis Test: Political analysts use hypothesis tests to determine whether the margin of victory in an election is statistically significant, i.e., whether the winner’s lead is large enough to be deemed unlikely to be the result of random chance.
- Confidence Interval: Pollsters use confidence intervals to estimate the likely outcome of an election or public opinion survey, providing a range of possible outcomes with a specified confidence level.
Examples
Example 1. Evaluating the Effectiveness of a New Drug
In clinical trials, researchers use hypothesis tests and confidence intervals to assess the effectiveness of a new drug compared to a placebo. A hypothesis test may be conducted to evaluate whether the mean recovery rate of patients using the new drug is significantly different from those using the placebo. A confidence interval can then be used to estimate the range of potential effects the drug might have, providing a measure of precision for the estimated treatment effect.
Example 2. Comparing Customer Satisfaction Scores
A company may use hypothesis testing to compare customer satisfaction scores between two product lines. The null hypothesis might state that the average satisfaction scores are the same for both product lines, while the alternative hypothesis suggests that the scores differ. By calculating a confidence interval for the difference in average scores, the company can determine if the difference observed is statistically significant and evaluate the uncertainty surrounding the estimate.
Example 3. Determining the Impact of Advertising on Sales
A retailer might use hypothesis tests and confidence intervals to evaluate the effectiveness of a new advertising campaign on sales performance. A hypothesis test can assess whether the mean sales before and after the campaign differ significantly. Confidence intervals would then help estimate the potential range of increase in sales, giving the business insight into the effectiveness of the campaign, while accounting for sampling error.
Example 4. Assessing Employee Productivity Improvements
In a company, management might use hypothesis testing to determine whether an employee training program has led to a statistically significant improvement in productivity. A null hypothesis could state that there is no difference in productivity before and after the training, while the alternative would suggest an improvement. A confidence interval would be used to estimate the average productivity gain from the training, with a specified level of confidence.
Example 5. Predicting the Average Income of Graduates
A university might conduct a survey of its graduates to estimate the average income one year after graduation. Using hypothesis testing, the university could test whether the average income of its graduates is greater than a specific benchmark. Confidence intervals would provide a range of possible values for the average income, allowing the university to communicate the uncertainty of the estimate when reporting it to potential students and stakeholders.
Practice Questions
Question 1
What is the main difference between a hypothesis test and a confidence interval?
A) A hypothesis test is used to estimate population parameters, while a confidence interval is used to test population parameters.
B) A hypothesis test provides a range of values for the population parameter, while a confidence interval tests the significance of a sample statistic.
C) A hypothesis test tests a claim about a population parameter, while a confidence interval provides a range of plausible values for the population parameter.
D) A hypothesis test is used for categorical data, while a confidence interval is used for quantitative data.
Correct Answer: C) A hypothesis test tests a claim about a population parameter, while a confidence interval provides a range of plausible values for the population parameter.
Explanation:
- A hypothesis test is designed to test a specific claim or hypothesis about a population parameter, typically using sample data to either accept or reject the null hypothesis.
- A confidence interval, on the other hand, provides an estimated range of values for a population parameter, based on sample data. It gives a range of plausible values for the parameter with a certain level of confidence (e.g., 95% confidence interval).
Question 2
If the p-value from a hypothesis test is less than the significance level (α), what should be the conclusion?
A) Fail to reject the null hypothesis.
B) Reject the null hypothesis.
C) The sample mean is significantly different from the population mean.
D) The confidence interval includes the population mean.
Correct Answer: B) Reject the null hypothesis.
Explanation:
- The p-value is the probability of obtaining a test statistic at least as extreme as the one observed in the sample, assuming the null hypothesis is true. If the p-value is less than the significance level (α), it indicates that the observed data is unlikely under the null hypothesis, leading to the rejection of the null hypothesis.
- If the p-value is smaller than α (typically 0.05), we have enough evidence to reject the null hypothesis in favor of the alternative hypothesis.
Question 3
A 95% confidence interval for the mean of a population is calculated to be (10, 15). Which of the following statements is correct?
A) We are 95% confident that the population mean is between 10 and 15.
B) There is a 95% probability that the population mean is between 10 and 15.
C) The population mean is definitely between 10 and 15 with 95% certainty.
D) We are 95% confident that the sample mean is between 10 and 15.
Correct Answer: A) We are 95% confident that the population mean is between 10 and 15.
Explanation:
- A 95% confidence interval means that if we were to take many samples and construct a confidence interval from each sample, approximately 95% of those intervals would contain the true population mean.
- The interval (10, 15) is an estimate for where the true population mean is likely to lie, with a 95% level of confidence. It does not imply that there is a 95% probability that the population mean is within that interval, as the true mean is a fixed value and not subject to probability. The interval provides a range of plausible values, not a guarantee.

