Intermarket indicators analyze the relationships between asset classes—stocks, bonds, commodities, and currencies—to provide insights into market trends, economic conditions, and investor sentiment. By examining these interactions, intermarket analysis helps identify correlations, divergences, and patterns that may signal shifts in market direction. A rise in one asset class often impacts others, as economic forces and investor preferences shift. Understanding intermarket indicators enables technical analysts to anticipate changes, refine portfolio strategies, and better manage risk by interpreting signals across multiple interconnected markets.
Learning Objectives
In studying “Intermarket Indicators” for the CMT Exam, you should learn to analyze the interconnectedness of asset classes such as equities, bonds, commodities, and currencies. Understand how intermarket indicators, including the equity-bond ratio, yield spreads, commodity indexes, and the U.S. Dollar Index, reveal economic trends and shifts in market sentiment. Evaluate how these indicators help interpret inflation, economic cycles, and risk-on or risk-off environments. Apply these insights to assess divergences and correlations across asset classes, enabling a deeper understanding of market dynamics and guiding investment and trading decisions through informed technical analysis.
Intermarket Indicators : Overview
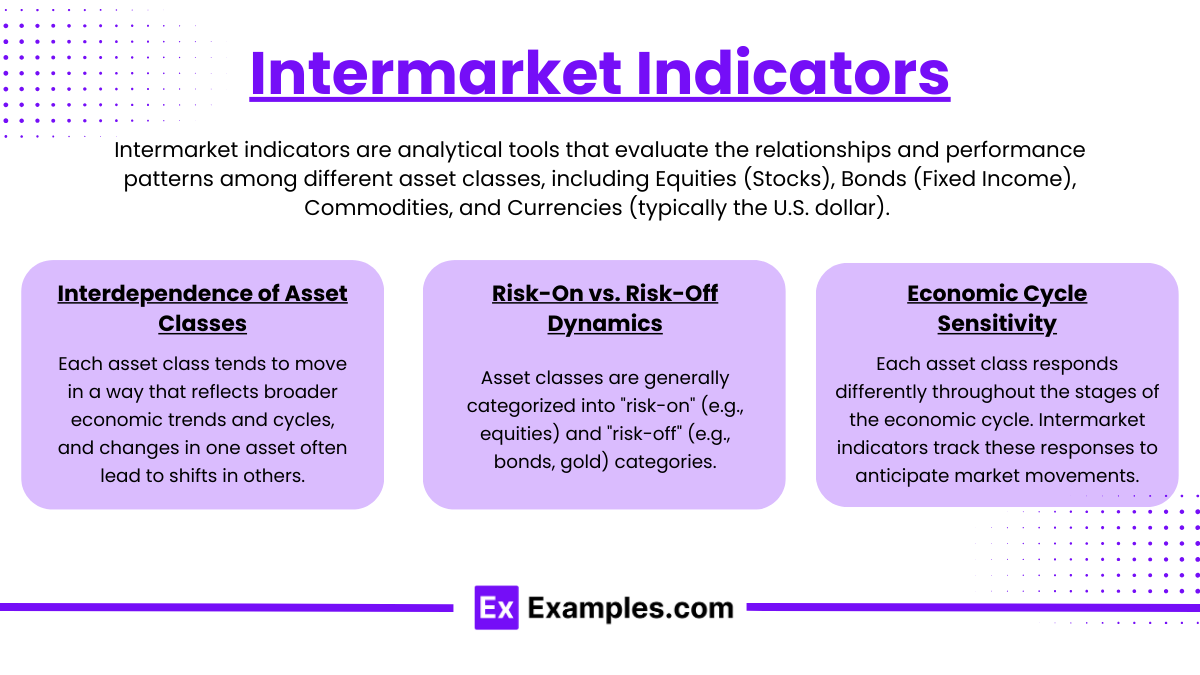
Intermarket indicators are analytical tools that evaluate the relationships and performance patterns among different asset classes, including Equities (Stocks), Bonds (Fixed Income), Commodities, and Currencies (typically the U.S. dollar). The core principle behind these indicators is the interdependence of asset classes. No market operates in isolation; instead, they influence one another based on economic conditions, interest rates, inflation expectations, and global economic sentiment.
Core Principles of Intermarket Indicators
- Interdependence of Asset Classes: Each asset class tends to move in a way that reflects broader economic trends and cycles, and changes in one asset often lead to shifts in others.
- Risk-On vs. Risk-Off Dynamics:
- Asset classes are generally categorized into “risk-on” (e.g., equities) and “risk-off” (e.g., bonds, gold) categories.
- In risk-on environments, investors typically favor growth-oriented assets like stocks, whereas in risk-off conditions, they turn to safer assets like bonds or gold. Intermarket indicators help detect these shifts in risk appetite.
- Economic Cycle Sensitivity: Each asset class responds differently throughout the stages of the economic cycle. Intermarket indicators track these responses to anticipate market movements.
Specific Intermarket Indicators
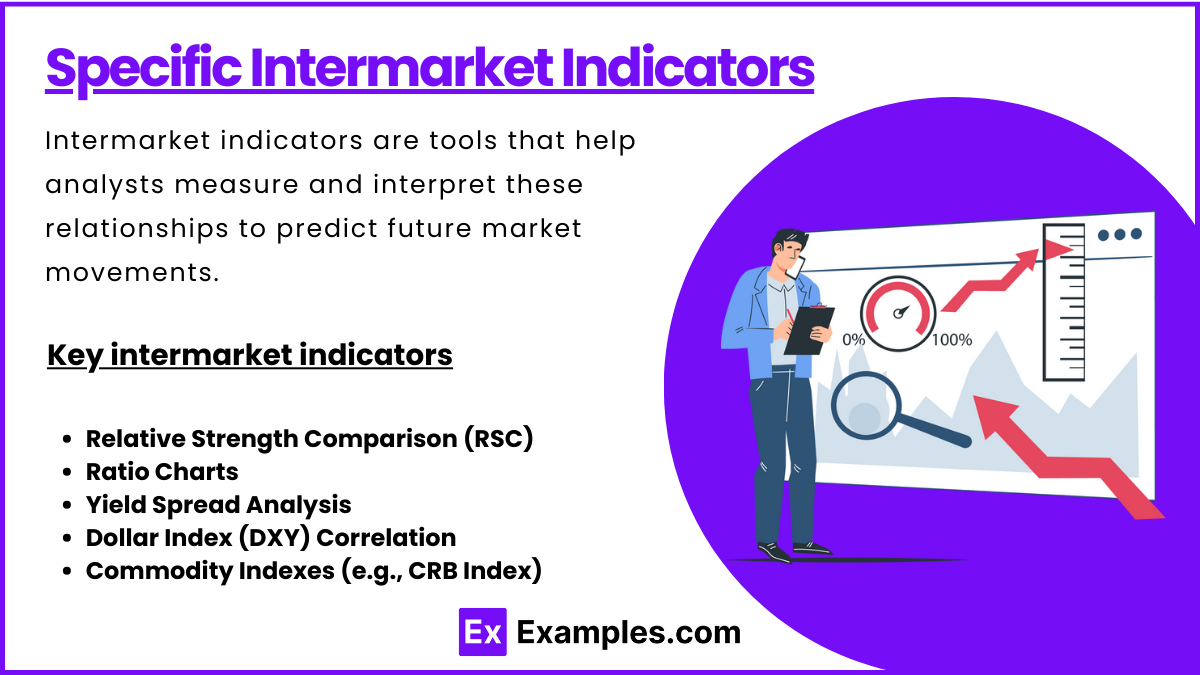
Intermarket indicators are tools that help analysts measure and interpret these relationships to predict future market movements. Key intermarket indicators include:
- Relative Strength Comparison (RSC):
- RSC compares the strength of one asset class or market with another over time. For instance, an RSC between stocks and bonds might reveal the relative outperformance of equities, indicating a preference for risk-taking by investors.
- When one asset class shows strength relative to another, it often signals shifts in risk tolerance or economic expectations.
- Ratio Charts:
- Ratio charts display the performance of one asset relative to another (e.g., stocks vs. bonds). Rising ratios indicate the outperformance of the numerator asset over the denominator.
- A common example is the S&P 500-to-gold ratio, which compares stock market performance to gold prices. A rising ratio may indicate risk-on sentiment, whereas a falling ratio might signal a flight to safety.
- Yield Spread Analysis:
- The difference (spread) between yields on different types of bonds, such as corporate and government bonds, can signal economic expectations.
- Narrowing spreads (where corporate bond yields approach government bond yields) suggest market confidence, while widening spreads often signal economic trouble, as investors demand a higher return for riskier corporate bonds.
- Dollar Index (DXY) Correlation:
- The U.S. Dollar Index (DXY) is a valuable intermarket indicator. Its performance against other currencies influences commodities, with a stronger dollar generally leading to weaker commodity prices.
- Monitoring the DXY against equities or commodities can help predict possible reversals or continuations based on currency strength.
- Commodity Indexes (e.g., CRB Index):
- Commodity indexes track the performance of a basket of major commodities, including oil, metals, and agricultural products. Rising commodity indexes often signal inflationary pressures, affecting bond yields and stock performance.
- Commodity trends can give clues about economic health, as rising commodity prices might suggest strong demand (signaling growth) or supply constraints (leading to inflation).
Key Intermarket Relationships
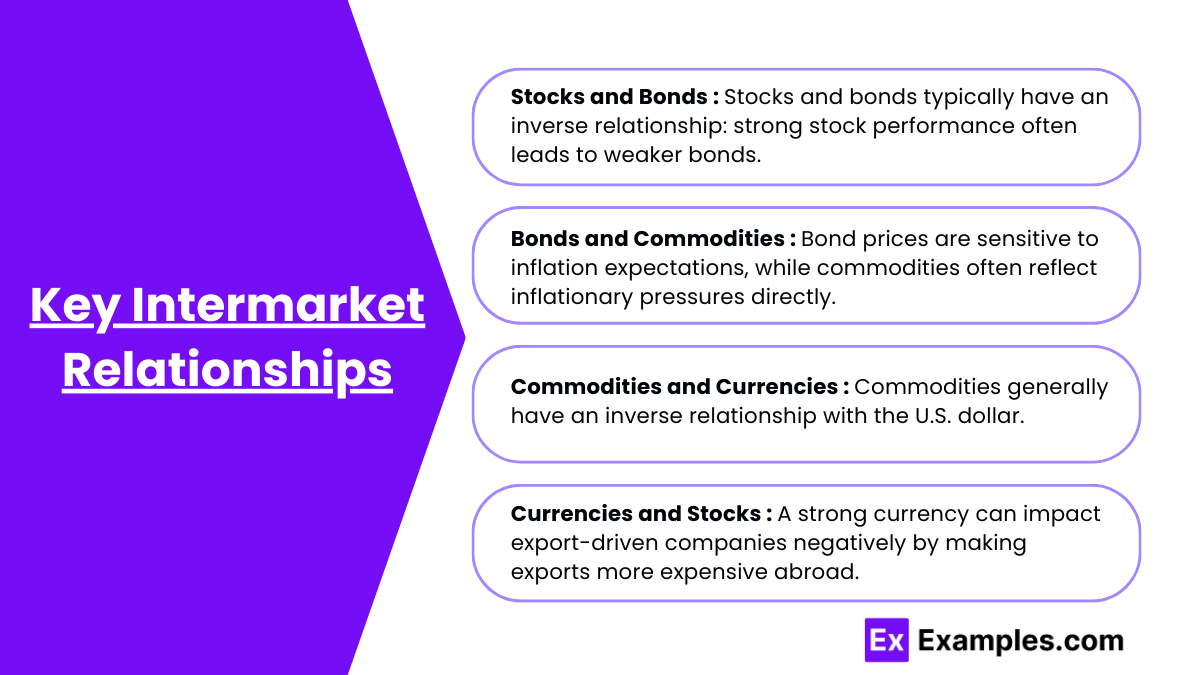
- Stocks and Bonds:
- Generally, there’s an inverse relationship between stocks and bonds. When stock markets perform well, indicating economic strength, bonds often underperform, and vice versa. In times of economic uncertainty, investors may move from equities to bonds, seeking safer, more stable returns.
- Rising bond yields (falling bond prices) can signal potential inflationary pressures, which might lead to a slowdown in the stock market due to rising costs and interest rates.
- Bonds and Commodities:
- Bond prices are sensitive to inflation expectations, while commodities often reflect inflationary pressures directly. Rising commodity prices may signal rising inflation, often leading to declining bond prices (increasing bond yields) as the central bank may raise rates to curb inflation.
- When commodity prices are low, inflationary pressures are subdued, which can lead to stable or rising bond prices.
- Commodities and Currencies (U.S. Dollar):
- Commodities generally have an inverse relationship with the U.S. dollar. When the dollar is strong, commodities priced in dollars become more expensive in other currencies, typically reducing global demand and lowering commodity prices.
- A weaker dollar makes commodities cheaper globally, which can boost commodity prices. This relationship is especially important for commodities like oil and gold.
- Currencies and Stocks:
- A strong currency can impact export-driven companies negatively by making exports more expensive abroad. Conversely, a weaker currency boosts exports, potentially benefiting export-focused companies.
- Currency trends can also reflect economic stability, as a declining currency may signal economic issues, driving investors toward safer assets, while a rising currency suggests economic health.
Practical Applications in Intermarket Analysis
- Anticipating Market Cycles:
- Intermarket relationships can help analysts anticipate different phases of the business cycle. For instance, if bonds begin to outperform stocks, it may signal an economic slowdown.
- In early stages of recovery, stocks often outperform, followed by a rise in commodities and a subsequent decline in bonds due to inflation concerns.
- Confirming Technical Patterns:
- Using intermarket indicators alongside traditional technical analysis tools (like moving averages or MACD) provides stronger signals. For example, if a stock market rally is accompanied by a declining bond market and a steady dollar, it supports a sustained risk-on environment.
- Cross-Market Divergences:
- Divergences between markets can signal potential reversals. For instance, if equities rise but commodities fall, it may indicate that the equity rally lacks support from economic fundamentals.
- Risk Management:
- Intermarket analysis is crucial for risk management. Understanding these relationships helps predict market volatility and potential downturns, allowing investors to adjust allocations across asset classes for optimal risk control.
Examples
Example 1. Equity-Bond Ratio
The equity-bond ratio compares the performance of equities (stocks) to bonds (fixed income) by creating a ratio between a stock index, such as the S&P 500, and a bond index or Treasury yield. This ratio is useful for assessing risk appetite and economic sentiment. A rising equity-bond ratio indicates that equities are outperforming bonds, signaling a “risk-on” environment where investors are confident in economic growth. Conversely, a declining ratio suggests a preference for bonds, often in response to economic caution or a shift toward a “risk-off” sentiment. This ratio can help anticipate shifts in market conditions, as investors may rotate into bonds when economic concerns arise, and back into equities when optimism prevails.
Example 2. Dollar Index (DXY) and Commodity Prices
The U.S. Dollar Index (DXY), which measures the value of the U.S. dollar against a basket of major currencies, often has an inverse relationship with commodities. Since commodities are generally priced in dollars, a stronger dollar makes them more expensive for foreign buyers, often reducing demand and driving prices down. Conversely, a weaker dollar makes commodities cheaper on the global market, boosting demand and driving prices up. This relationship between the dollar and commodities is particularly evident with assets like oil and gold, where a declining DXY often signals inflationary pressures and commodity strength, while a strong DXY signals deflationary tendencies. Monitoring this interaction can provide insights into inflation trends and global economic conditions.
Example 3. Yield Spread (Treasury Yield Curve)
The yield spread, or yield curve, particularly between the 10-year and 2-year U.S. Treasury yields, is a significant intermarket indicator of economic expectations. When the yield curve is steep (the difference between long-term and short-term yields is high), it suggests economic growth expectations, as investors demand higher returns for long-term investments. However, when the yield curve flattens or inverts (short-term rates are higher than long-term rates), it often signals a recession or economic slowdown. This spread is a leading indicator for economic health and market sentiment. A steepening yield curve may support equity market growth, while an inverted curve often precedes a downturn, prompting a shift toward bonds or other safe-haven assets.
Example 4. Gold-to-Oil Ratio
The gold-to-oil ratio compares the price of gold (a traditional safe-haven asset) to the price of oil (an economically sensitive commodity). This ratio can signal investor sentiment and expectations for economic stability. A high gold-to-oil ratio often indicates economic uncertainty or deflationary pressures, as investors flock to gold for safety. On the other hand, a low gold-to-oil ratio suggests economic growth and inflationary pressures, as demand for oil (and therefore industrial activity) is strong. Analysts use this ratio to gauge the likelihood of inflation or recession and to predict shifts in risk appetite across asset classes. A rising gold-to-oil ratio can prompt cautious positioning, while a declining ratio might support a pro-growth investment approach.
Example 5. Stock Market Sector Rotation
Sector rotation analysis within equities examines which sectors are outperforming or underperforming in relation to each other, often aligning with different phases of the economic cycle. For example, during early recovery phases, cyclical sectors like technology and consumer discretionary tend to outperform, reflecting renewed economic growth and consumer spending. In contrast, defensive sectors like healthcare and utilities may lead during a downturn, as investors seek stability. By analyzing sector rotation, technical analysts can gauge economic trends and investor sentiment. When growth sectors lead, it suggests optimism and risk-taking; when defensive sectors take over, it may indicate caution or economic slowdown, often supported by bond strength and weakening commodities.
Practice Questions
Question 1
Which of the following scenarios most likely indicates an upcoming economic slowdown?
A) Rising equity prices, falling bond prices, and a strong U.S. dollar
B) Declining equity prices, rising bond prices, and a weak U.S. dollar
C) Rising equity prices, rising bond prices, and a weak U.S. dollar
D) Declining equity prices, declining bond prices, and a strong U.S. dollar
Answer: B) Declining equity prices, rising bond prices, and a weak U.S. dollar
Explanation: An economic slowdown is often characterized by a “risk-off” sentiment where investors seek safer assets. In this scenario:
- Declining equity prices indicate that investors are moving out of stocks, which is typical when growth expectations are low.
- Rising bond prices (which result in falling yields) suggest increased demand for safer, fixed-income assets, as bonds are typically less volatile and offer stability.
- A weak U.S. dollar often accompanies expectations of lower interest rates, which the central bank may implement to stimulate the economy in response to a slowdown.
Together, these indicators suggest that the market anticipates slower growth, hence moving away from equities and favoring bonds.
Question 2
Which intermarket indicator would an analyst monitor to assess inflationary pressures in the economy?
A) Equity-to-Bond Ratio
B) Gold-to-Oil Ratio
C) U.S. Dollar Index (DXY)
D) Bond Yield Spread
Answer: B) Gold-to-Oil Ratio
Explanation: The Gold-to-Oil Ratio is an effective intermarket indicator for assessing inflationary pressures. Here’s why:
- Gold is often seen as a store of value, especially during inflationary or uncertain periods.
- Oil, on the other hand, is closely tied to economic demand and industrial activity, with rising oil prices indicating higher production costs, which can lead to inflation.
- A declining Gold-to-Oil Ratio suggests rising oil prices relative to gold, which often signals that inflation is picking up, as energy and production costs increase. Conversely, a rising Gold-to-Oil Ratio may indicate deflationary pressures, with low industrial demand and stable or rising gold prices.
While other indicators, like the U.S. Dollar Index, may indirectly reflect inflation expectations, the Gold-to-Oil Ratio specifically highlights inflationary or deflationary trends in industrial demand versus safe-haven assets.
Question 3
In intermarket analysis, which of the following asset behaviors most commonly signals a “risk-on” environment?
A) Rising bond prices, declining equity prices, and a strong U.S. dollar
B) Declining bond prices, rising equity prices, and a weak U.S. dollar
C) Rising bond prices, rising commodity prices, and a weak U.S. dollar
D) Rising equity prices, rising bond prices, and a strong U.S. dollar
Answer: B) Declining bond prices, rising equity prices, and a weak U.S. dollar
Explanation: A “risk-on” environment is one where investors have an appetite for higher-risk, higher-reward assets like stocks. This scenario is typically characterized by:
- Declining bond prices (or rising bond yields), as investors move capital from safer, low-yield assets into equities, anticipating higher returns.
- Rising equity prices, which reflect optimism about economic growth and profitability.
- A weak U.S. dollar, which can encourage risk-taking and often reflects lower interest rates, making borrowing cheaper and supporting corporate profitability and market expansion.
In contrast:
- Option A describes a “risk-off” environment, with rising bond prices (suggesting safe-haven demand) and declining equities.
- Option C mixes indicators and doesn’t strongly reflect a typical risk-on environment, as rising bond prices indicate a more cautious approach.
- Option D is less likely in a risk-on scenario since both rising bond and equity prices are rare under growth-oriented, inflationary conditions, and a strong dollar generally pressures equities and commodities.
Thus, the combination in Option B most accurately reflects a risk-on environment.

