
Charting Species Ancestry Through Phylogenetic Trees and Cladograms

In the AP Biology , understanding phylogenetic trees and cladograms is crucial for charting species ancestry. These tools illustrate evolutionary relationships by depicting how species diverged from common ancestors over time. Phylogenetic trees show these connections based on genetic and morphological data, while cladograms highlight shared derived characteristics. Mastering these diagrams helps students grasp the mechanisms of evolution, recognize patterns of descent, and interpret the evolutionary history of diverse organisms.
Learning Objective
By studying phylogenetic trees and cladograms, you will learn to interpret and construct these diagrams to understand evolutionary relationships. You will identify common ancestors, analyze shared derived characteristics, and distinguish between monophyletic, paraphyletic, and polyphyletic groups. By mastering these skills, you will accurately chart species ancestry, recognize evolutionary patterns, and apply these concepts to various biological examples, enhancing your comprehension of evolutionary processes for the AP Biology exam.
Understanding Phylogenetic Trees and Cladograms
Definitions
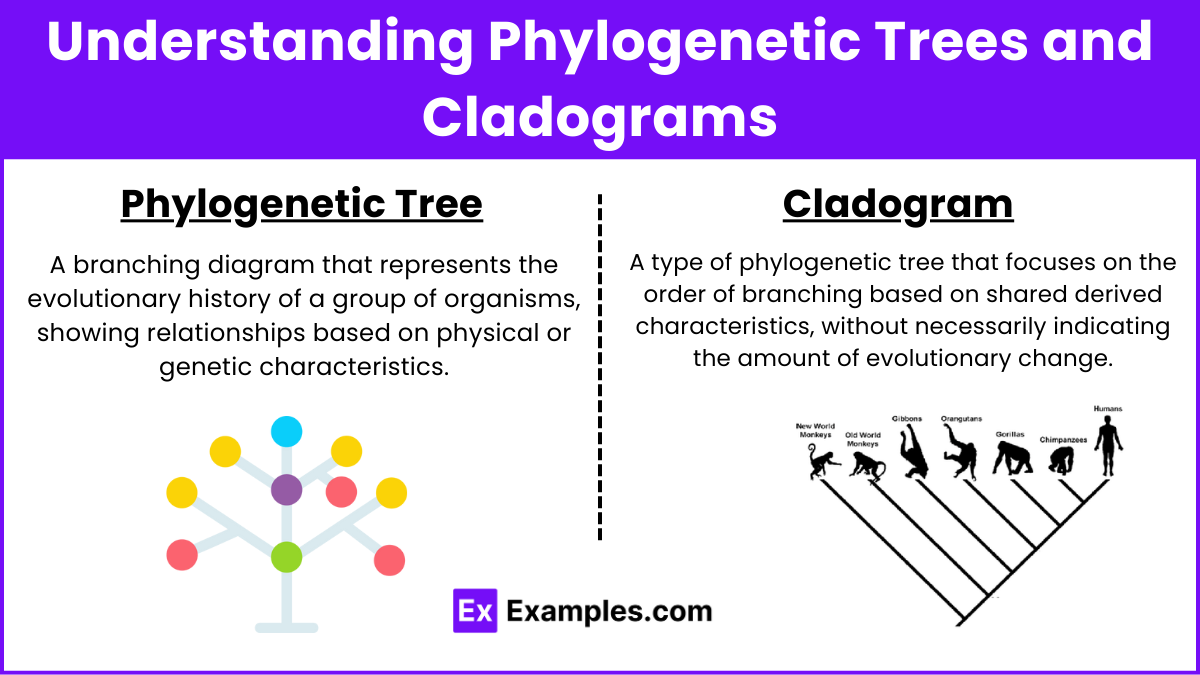
Phylogenetic Tree: A branching diagram that represents the evolutionary history of a group of organisms, showing relationships based on physical or genetic characteristics.
Cladogram: A type of phylogenetic tree that focuses on the order of branching based on shared derived characteristics, without necessarily indicating the amount of evolutionary change.
Components
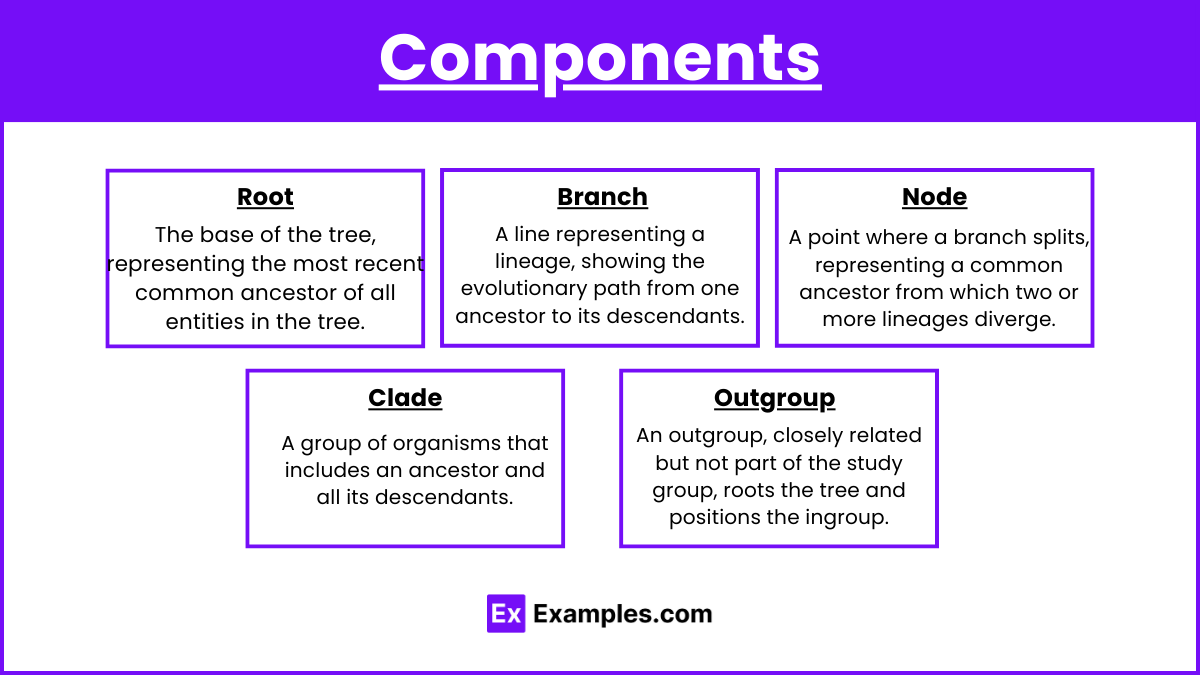
Root: The base of the tree, representing the most recent common ancestor of all entities in the tree.
Branch: A line representing a lineage, showing the evolutionary path from one ancestor to its descendants.
Node: A point where a branch splits, representing a common ancestor from which two or more lineages diverge.
Clade: A group of organisms that includes an ancestor and all its descendants.
Outgroup: A species or group that is closely related to but not part of the group being studied, used to root the tree and determine the relative positions of the ingroup.
Interpreting Phylogenetic Trees and Cladograms
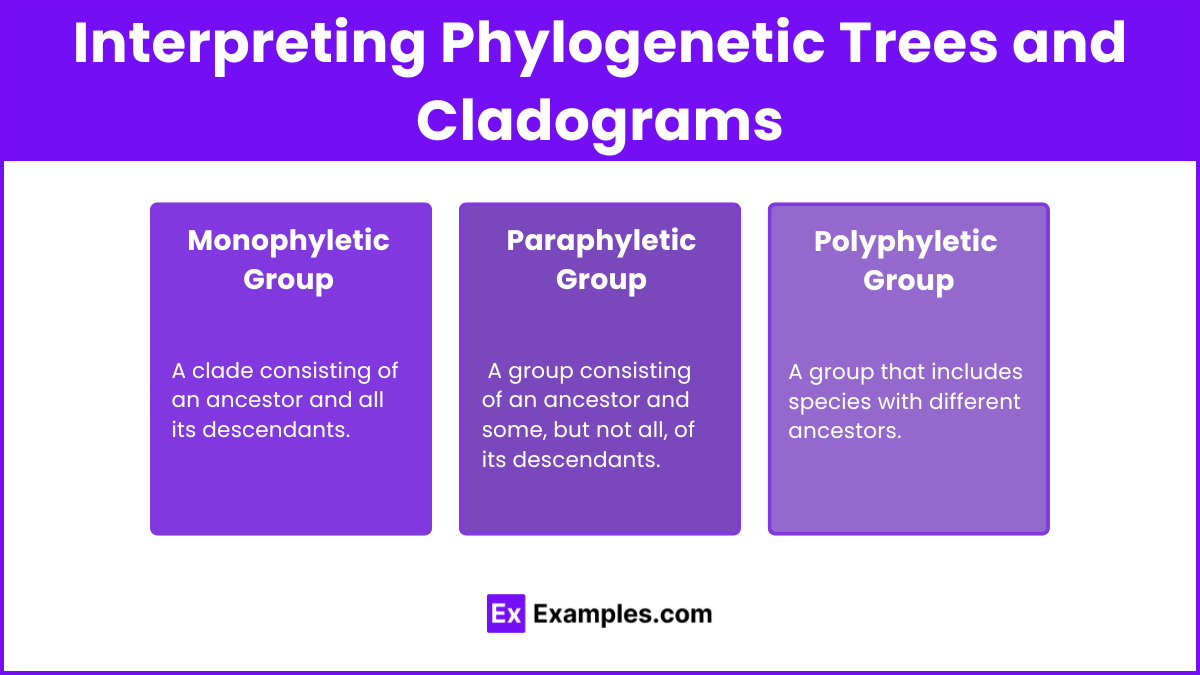
Monophyletic Group: A clade consisting of an ancestor and all its descendants.
Paraphyletic Group: A group consisting of an ancestor and some, but not all, of its descendants.
Polyphyletic Group: A group that includes species with different ancestors.
Building Trees
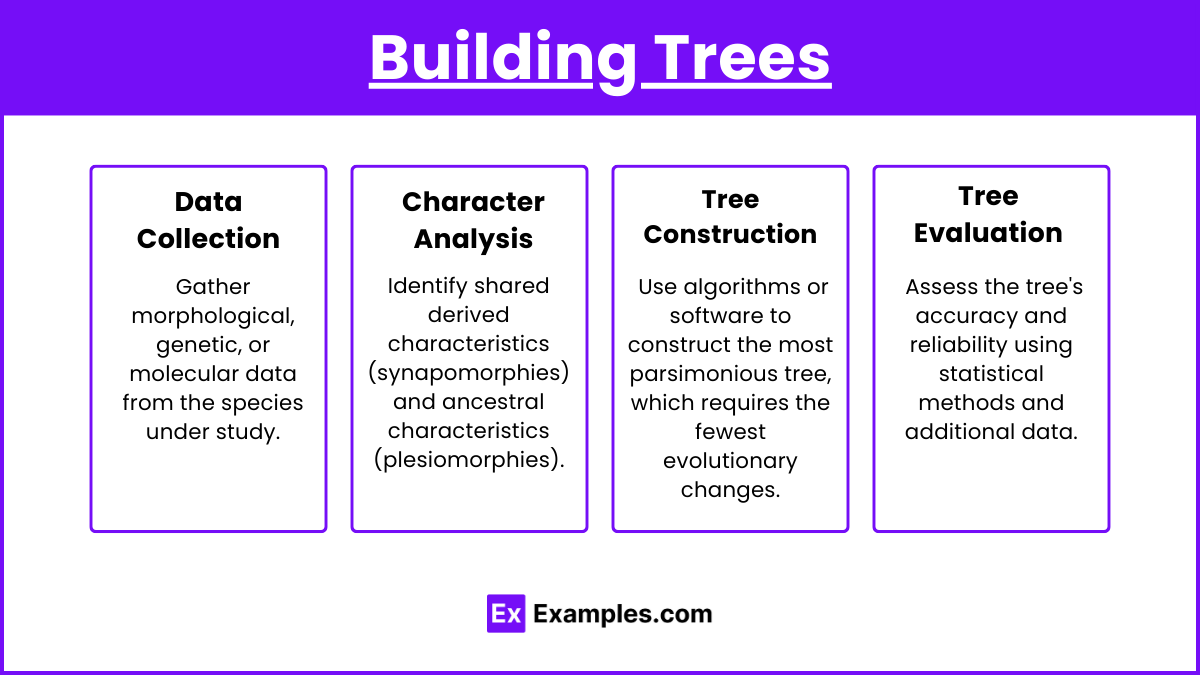
Data Collection: Gather morphological, genetic, or molecular data from the species under study.
Character Analysis: Identify shared derived characteristics (synapomorphies) and ancestral characteristics (plesiomorphies).
Tree Construction: Use algorithms or software to construct the most parsimonious tree, which requires the fewest evolutionary changes.
Tree Evaluation: Assess the tree's accuracy and reliability using statistical methods and additional data.
Methods for Constructing Trees
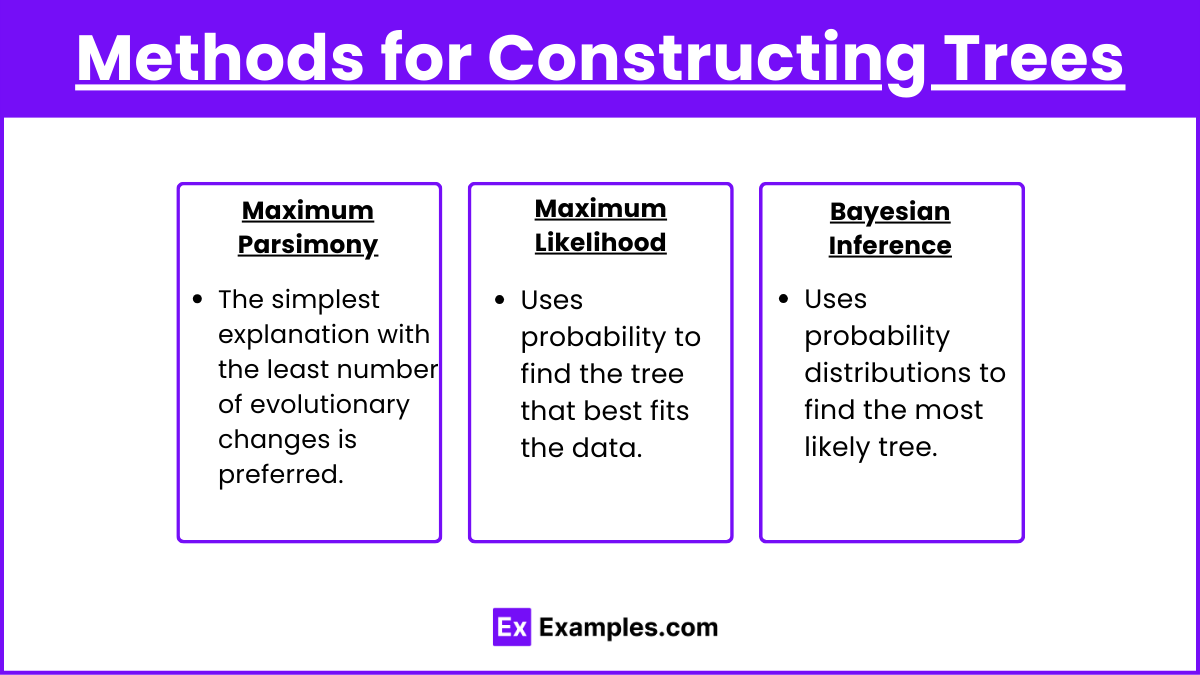
Maximum Parsimony: The simplest explanation with the least number of evolutionary changes is preferred.
Maximum Likelihood: Uses probability to find the tree that best fits the data.
Bayesian Inference: Uses probability distributions to find the most likely tree.
Examples
Example 1: Vertebrate Phylogeny
A phylogenetic tree of vertebrates shows relationships among fish, amphibians, reptiles, birds, and mammals, highlighting the divergence from a common ancestor and the development of key traits such as amniotic eggs and feathers.
Example 2: Evolution of Primates
A cladogram of primates illustrates the relationships between lemurs, monkeys, apes, and humans, showing shared traits like opposable thumbs and larger brains, indicating their evolutionary paths.
Example 3: Plant Evolution
A phylogenetic tree of plants demonstrates the divergence of major groups such as mosses, ferns, gymnosperms, and angiosperms, showing how key adaptations like vascular tissues and seeds evolved.
Example 4: Insect Evolution
A cladogram of insects can illustrate the diversification of major groups like beetles, flies, and butterflies, highlighting the development of wings, metamorphosis, and other adaptations.
Example 5: Molecular Evidence in Vertebrates
A phylogenetic tree based on DNA sequencing can show the evolutionary relationships among vertebrates like sharks, ray-finned fish, amphibians, reptiles, birds, and mammals, providing molecular evidence for their common ancestry.
Multiple Choice Questions
Question 1: Which component of a phylogenetic tree represents the most recent common ancestor of all entities in the tree?
A. Node
B. Branch
C. Root
D. Clade
Answer: C. Root
Explanation: The root is the base of the phylogenetic tree, representing the most recent common ancestor from which all entities in the tree have descended.
Question 2: What is the primary focus of a cladogram?
A. Showing the amount of evolutionary change
B. Indicating geographic distribution of species
C. Displaying the order of branching based on shared derived characteristics
D. Representing genetic similarities
Answer: C. Displaying the order of branching based on shared derived characteristics
Explanation: A cladogram focuses on the order of branching and relationships based on shared derived characteristics (synapomorphies), without indicating the amount of evolutionary change.
Question 3: Which of the following methods is used to construct a phylogenetic tree by finding the simplest explanation with the least number of evolutionary changes?
A. Maximum Likelihood
B. Bayesian Inference
C. Maximum Parsimony
D. Comparative Anatomy
Answer: C. Maximum Parsimony
Explanation: Maximum parsimony is a method used to construct phylogenetic trees by selecting the tree that requires the fewest evolutionary changes, providing the simplest explanation.