

Sketching Graphs of Functions and Their Derivatives


 , is always negative, indicating that the function is decreasing on its domain. The second derivative,
  , indicates concavity; f(x) is concave up when x > 0 and concave down when x < 0. There are no critical points, but the function’s behavior near the asymptotes is crucial.
 (where n is an integer), corresponding to the maxima and minima of the sine wave. The second derivative, f′′(x) = −sin(x), shows where the graph is concave up or down. Points of inflection occur where f′′(x) = 0, at x = nπ, where the concavity changes.
 , which of the following describes the behavior of its second derivative g′′(x)?

 , g(x) is concave up everywhere on its domain (which excludes x = 0 because the function is undefined there). Therefore, the correct answer is a).
 (where n is an integer). Therefore, the correct answer is d).
In AP Calculus AB and BC, understanding the relationship between a function and its derivative is crucial for analyzing and sketching graphs. The graph of a function provides insight into its behavior, such as increasing or decreasing intervals, while the graph of its derivative reveals the rate of change and critical points. Mastering the skill of sketching these graphs helps in identifying local maxima, minima, and points of inflection, essential for solving complex calculus problems with precision and accuracy.
Free AP Calculus AB Practice Test
Free AP Calculus BC Practice Test
Learning Objectives
When studying "Sketching Graphs of Functions and Their Derivatives" for the AP Calculus AB and BC exams, you should focus on understanding how to analyze and interpret the behavior of functions and their derivatives. Key objectives include identifying critical points, inflection points, and intervals of increase or decrease; understanding the relationship between a function and its first and second derivatives; and using this information to accurately sketch the graph of the original function and predict its shape, concavity, and behavior.
Sketching Graphs of Functions and Their Derivatives for AP Calculus AB and BC
Sketching graphs of functions and their derivatives is a critical skill in both AP Calculus AB and BC. This topic involves understanding how the graph of a function relates to the graph of its first and second derivatives. Mastering this concept is essential for solving problems involving curve sketching, optimization, and analyzing the behavior of functions.
Key Concepts of Sketching Graphs of Functions and Their Derivatives
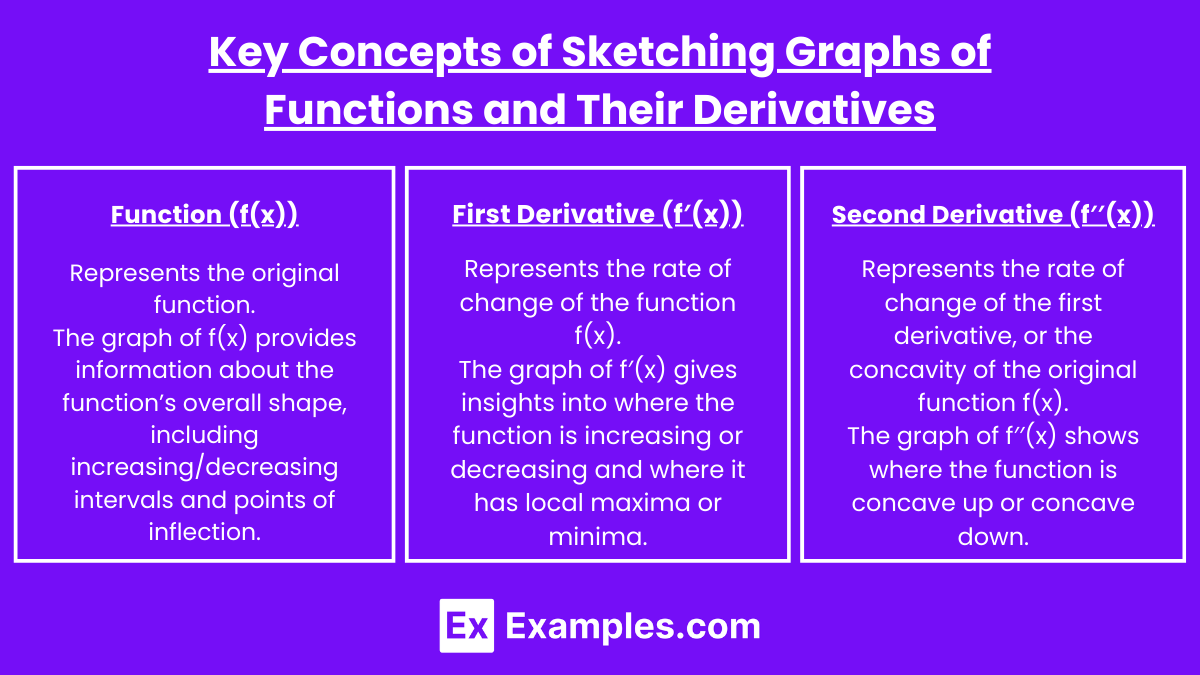
Function (f(x)):
Represents the original function.
The graph of f(x) provides information about the function’s overall shape, including increasing/decreasing intervals and points of inflection.
First Derivative (f′(x)):
Represents the rate of change of the function f(x).
The graph of f′(x) gives insights into where the function is increasing or decreasing and where it has local maxima or minima.
Critical Points: Where f′(x) = 0 or f′(x) is undefined. These are potential locations for local extrema.
Second Derivative (f′′(x)):
Represents the rate of change of the first derivative, or the concavity of the original function f(x).
The graph of f′′(x) shows where the function is concave up or concave down.
Points of Inflection: Where f′′(x) = 0 or changes sign, indicating a change in concavity.
Steps for Sketching Graphs

Step 1: Analyze the Function f(x)
Domain and Range: Determine the domain (all possible x-values) and range (all possible y-values) of the function.
Intercepts: Find the x-intercepts and y-intercepts by solving f(x) = 0 and evaluating f(0), respectively.
Asymptotes: Identify any vertical or horizontal asymptotes by analyzing the limits as x approaches certain values or infinity.
Step 2: Analyze the First Derivative f′(x)
Sign of f′(x): Determine where f′(x) > 0 (increasing intervals) and where f′(x) < 0 (decreasing intervals).
Critical Points: Find where f′(x) = 0 or is undefined, and classify these points as potential local maxima or minima.
Sketch f′(x): Based on the increasing and decreasing intervals, sketch the graph of f′(x). A positive slope in f(x) translates to f′(x) being above the x-axis, and a negative slope translates to f′(x) being below the x-axis.
Step 3: Analyze the Second Derivative f′′(x)
Sign of f′′(x): Determine where f′′(x) > 0 (concave up) and where f′′(x) < 0 (concave down).
Points of Inflection: Find where f′′(x) = 0 or changes sign, indicating points of inflection on the graph of f(x).
Sketch f′′(x): Based on concavity, sketch the graph of f′′(x). Positive concavity indicates f′(x) is increasing, and negative concavity indicates f′(x) is decreasing.
Tips for AP Calculus Exams

Critical Points and Points of Inflection: Be able to identify and interpret them, as they are commonly tested.
Sign Charts: Use sign charts for f′(x) and f′′(x) to organize your analysis of intervals of increase/decrease and concavity.
Graph Matching: Practice matching the graph of f(x) with its derivatives, as these types of questions frequently appear on the exam.
Concavity and Inflection Points: Be prepared to discuss concavity and identify points of inflection using the second derivative.
Examples
Example 1: Quadratic Function f(x) = x2−4x+3
The graph of this quadratic function is a parabola opening upwards. The first derivative, f′(x) = 2x−4, is a linear function that determines the slope of the parabola. The critical point, found by setting f′(x)=0, occurs at x = 2, where the parabola reaches its minimum. The second derivative, f′′(x) = 2, is constant and positive, indicating that the function is always concave up.
Example 2: Cubic Function f(x) = x3−3x
This cubic function has a more complex graph with inflection points. The first derivative, f′(x) = 3x2−3, is a quadratic function that helps identify where the function increases or decreases. The critical points are found at x = ±1, where the function changes direction, creating a local maximum and minimum. The second derivative, f′′(x) = 6x, changes sign at x = 0, indicating a point of inflection where the concavity of the function changes.
Example 3: Rational Function
The graph of this function is a hyperbola with vertical and horizontal asymptotes. The first derivative, , is always negative, indicating that the function is decreasing on its domain. The second derivative, , indicates concavity; f(x) is concave up when x > 0 and concave down when x < 0. There are no critical points, but the function’s behavior near the asymptotes is crucial.
Example 4: Exponential Function f(x) = ex
The graph of this exponential function is always increasing and has a horizontal asymptote at y = 0. The first derivative, f′(x) = ex, is identical to the function, confirming that the slope is always positive and increasing. The second derivative, f′′(x) = ex, also matches the function, indicating that the graph is always concave up with no points of inflection.
Example 5: Trigonometric Function f(x) = sin(x)
The sine function oscillates between -1 and 1. The first derivative, f′(x) = cos(x), indicates where the function is increasing or decreasing. The critical points occur where cos(x) = 0, at (where n is an integer), corresponding to the maxima and minima of the sine wave. The second derivative, f′′(x) = −sin(x), shows where the graph is concave up or down. Points of inflection occur where f′′(x) = 0, at x = nπ, where the concavity changes.
Multiple Choice Questions
Question 1
Given the function f(x) = x3−6x2+9x+1, which of the following statements is true about its first derivative f′(x)?
a) f′(x) has a local maximum at x = 2.
b) f′(x) is always increasing.
c) The critical points of f(x) occur at x = 1 and x = 3.
d) f′(x) = 0 at x = 1.5 and x = 2.5.
Answer: c) The critical points of f(x) occur at x = 1 and x = 3.
Explanation: To find the critical points of f(x), we first compute its derivative:
f′(x) = 3x2−12x+9
Next, we set f′(x) = 0 to find the critical points:
3x2−12x+9 = 0
This simplifies to:
x2−4x+3 = 0
Factoring gives: (x−1) (x−3) = 0
So, the critical points are x = 1 and x = 3. These are the points where the slope of the function f(x) is zero, indicating potential local maxima or minima. Therefore, the correct answer is c).
Question 2
For the function , which of the following describes the behavior of its second derivative g′′(x)?
a) g′′(x) is always positive, indicating g(x) is concave up for all x.
b) g′′(x) is always negative, indicating g(x) is concave down for all x.
c) g′′(x) has a point of inflection at x = 0.
d) g′′(x) is zero when x = 1.
Answer: a) g′′(x) is always positive, indicating g(x) is concave up for all x.
Explanation: First, let's find the second derivative of :
Now, differentiate g′(x) to get the second derivative:
Since 6/x4 is always positive for all , g(x) is concave up everywhere on its domain (which excludes x = 0 because the function is undefined there). Therefore, the correct answer is a).
Question 3
Consider the function h(x) = sin(x). What is the relationship between the graph of h(x) and its first derivative h′(x)?
a) h(x) is increasing when h′(x) = 0.
b) h(x) reaches a maximum when h′(x) = 1.
c) h(x) has inflection points where h′(x) = 0.
d) h(x) has local maxima where h′(x) = 0 and changes from positive to negative.
Answer: d) h(x) has local maxima where h′(x) = 0 and changes from positive to negative.
Explanation: For h(x) = sin(x), the first derivative is: h′(x) = cos(x)
The function sin(x) reaches local maxima where cos(x)=0 and the derivative changes from positive to negative (indicating a peak in the sine wave). This occurs at (where n is an integer). Therefore, the correct answer is d).