
Mass Spectroscopy of Elements

Learning Objectives
Mastering mass spectroscopy of elements for the AP Chemistry involves understanding the fundamental principles and components of mass spectrometers, including ionization, acceleration, deflection, and detection of ions. Comprehend the different ionization techniques (such as electron ionization and electrospray ionization) and mass analyzers (like quadrupole and time-of-flight analyzers). Develop proficiency in interpreting mass spectra, identifying molecular ion peaks, base peaks, and fragmentation patterns. Recognize the various applications of mass spectroscopy in elemental and isotopic analysis, structural elucidation, and quantitative analysis. Regularly engaging with sample spectra and becoming familiar with common fragmentation patterns will enhance comprehension and analytical skills in this essential topic.
Introduction to Mass Spectroscopy
Mass spectroscopy is a powerful analytical technique used to identify the composition and structure of elements and compounds. It works by ionizing the sample, accelerating the ions through an electric field, and then deflecting them using a magnetic field based on their mass-to-charge ratio. By detecting and measuring these ions, we can determine the molecular weight and structure of the substance.
What is Mass Spectroscopy of Elements?
Mass Spectroscopy of Elements is an analytical technique used to determine the mass-to-charge ratio (m/z) of ions. This process involves ionizing chemical compounds to produce charged particles (ions) and then measuring their mass-to-charge ratios. The resulting data helps identify the elemental composition and isotopic distribution of a sample.
Types of Mass Spectroscopy of Element
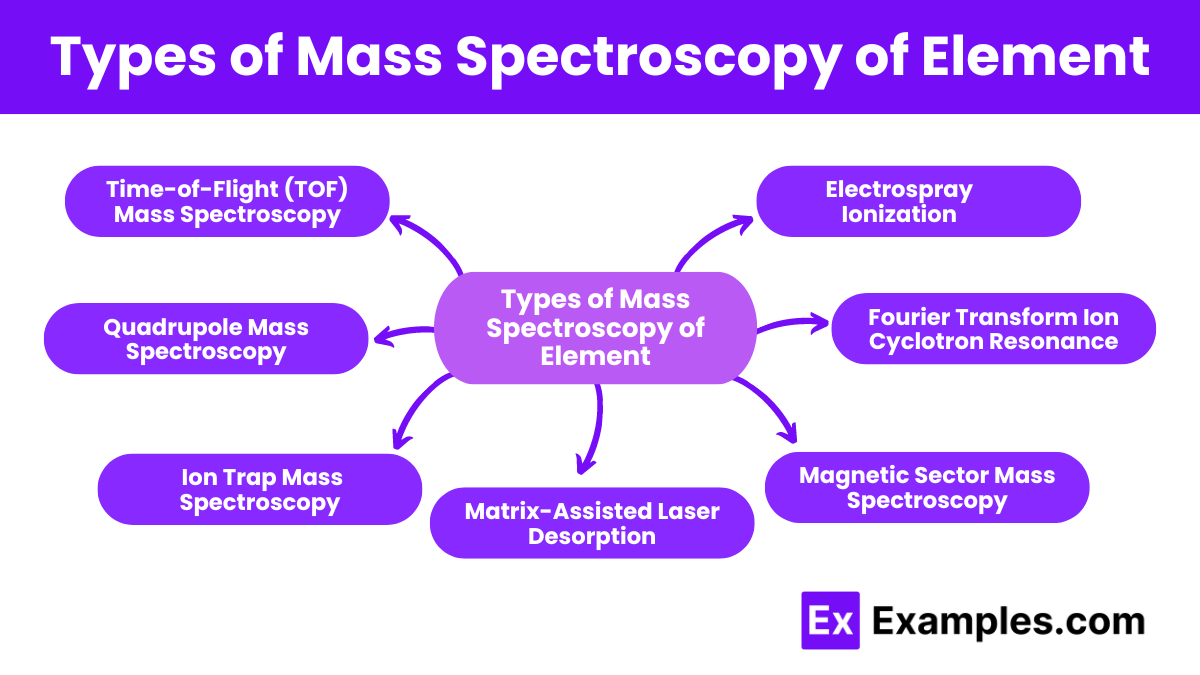
1. Time-of-Flight (TOF) Mass Spectroscopy
Ions are accelerated by an electric field and travel through a drift tube. The time it takes for the ions to reach the detector is measured, allowing for the determination of the mass-to-charge ratio.
2. Quadrupole Mass Spectroscopy
Uses four parallel rods with alternating electrical fields to filter ions based on their mass-to-charge ratio. Only ions with a specific m/z ratio pass through the quadrupole to the detector at a given time.
3. Ion Trap Mass Spectroscopy
Ions are trapped in a small space using electric and magnetic fields. The ions are then sequentially ejected and detected based on their mass-to-charge ratio.
4. Magnetic Sector Mass Spectroscopy
Ions are accelerated through an electric field and then deflected by a magnetic field. The degree of deflection depends on the mass-to-charge ratio of the ions.
5. Fourier Transform Ion Cyclotron Resonance (FT-ICR) Mass Spectroscopy
Ions are trapped in a magnetic field and subjected to a radiofrequency electric field. The cyclotron frequency of the ions is measured, which is inversely proportional to their mass-to-charge ratio.
6. Electrospray Ionization (ESI) Mass Spectroscopy
Produces ions by applying a high voltage to a liquid sample, creating a fine spray of charged droplets. The solvent evaporates, leaving charged ions that are then analyzed by a mass spectrometer.
7. Matrix-Assisted Laser Desorption/Ionization (MALDI) Mass Spectroscopy
The sample is mixed with a matrix material and irradiated with a laser. The matrix absorbs the laser energy and helps ionize the sample molecules without fragmenting them.
Basic Principles of Mass Spectroscopy
- Ionization: The sample is ionized, usually by removing one or more electrons, resulting in the formation of positive ions.
- Acceleration: The ions are accelerated by an electric field to a high speed.
- Deflection: The ions are deflected by a magnetic field according to their mass-to-charge ratio (m/z).
- Detection: The ions hit a detector, generating a signal that is recorded as a mass spectrum.
Steps in Mass Spectrometry
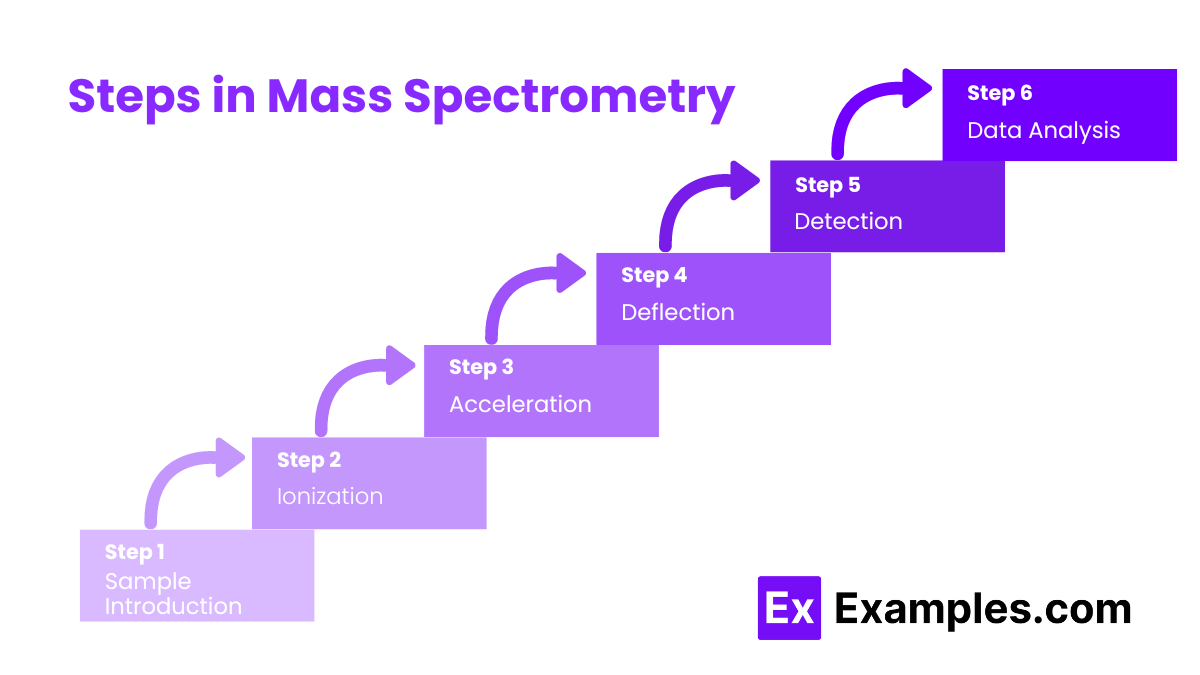
1. Sample Introduction
The sample is introduced into the mass spectrometer. It is often vaporized if it is not already in the gas phase. This ensures that the sample can be efficiently ionized.
2. Ionization
The sample molecules are ionized, usually by removing one or more electrons. Common ionization methods include:
- Electron Ionization (EI): High-energy electrons collide with the sample molecules, knocking off electrons and creating positive ions.
- Electrospray Ionization (ESI): A high voltage is applied to a liquid sample, creating a fine spray of charged droplets. The solvent evaporates, leaving behind charged ions.
- Matrix-Assisted Laser Desorption/Ionization (MALDI): The sample is mixed with a matrix material and irradiated with a laser, causing the sample to ionize without significant fragmentation.
3. Acceleration
The ions are accelerated by an electric field to ensure they all have the same kinetic energy. This allows the ions to be manipulated and analyzed based on their mass-to-charge ratios.
4. Deflection
The ions are deflected by a magnetic or electric field. The extent of deflection depends on the mass-to-charge ratio (m/z) of the ions:
- Lighter ions (lower m/z) are deflected more than heavier ions (higher m/z).
- This step separates the ions based on their m/z ratios.
5. Detection
The deflected ions hit a detector, such as a Faraday cup or an electron multiplier. The detector measures the number of ions at each m/z ratio, generating a signal that is recorded as a mass spectrum.
6. Data Analysis
The mass spectrum is analyzed to determine the mass-to-charge ratios of the ions. Peaks in the mass spectrum correspond to ions of different masses. The height of each peak indicates the relative abundance of each ion.
Interpretation of Mass Spectrum
- Identify the Peaks: Each peak represents ions with a specific mass-to-charge ratio (m/z). The x-axis shows m/z values; the y-axis shows relative abundances.
- Determine the Molecular Ion Peak: This peak (M⁺) corresponds to the intact molecule with one electron removed, indicating the molecular mass of the compound.
- Look for Isotopic Peaks: These peaks arise from naturally occurring isotopes. For example, chlorine has isotopes ³⁵Cl and ³⁷Cl, which produce peaks at different m/z values.
- Identify the Base Peak: The tallest peak in the spectrum, representing the most abundant ion. Its relative abundance is set to 100%, with other peaks measured relative to it.
- Analyze Fragmentation Patterns: Fragmentation occurs when the molecular ion breaks into smaller ions. Common fragmentations include loss of small neutral molecules like H₂O, CO₂, or NH₃, and cleavage of bonds to form characteristic ions.
- Calculate Relative Abundances: The height of each peak reflects the relative abundance of the corresponding ion. By comparing the heights, you determine the relative amounts of different ions.
Applications of Mass Spectroscopy
- Isotopic Analysis: Determines the relative abundance of isotopes in a sample.
- Molecular Identification: Identifies and characterizes organic and inorganic compounds.
- Structural Elucidation: Provides information on the molecular structure and functional groups.
- Proteomics: Analyzes proteins and peptides in biological samples.
- Drug Testing: Identifies and quantifies drugs and their metabolites.
- Environmental Monitoring: Detects and quantifies pollutants and contaminants.
Examples of Mass Spectroscopy of Elements
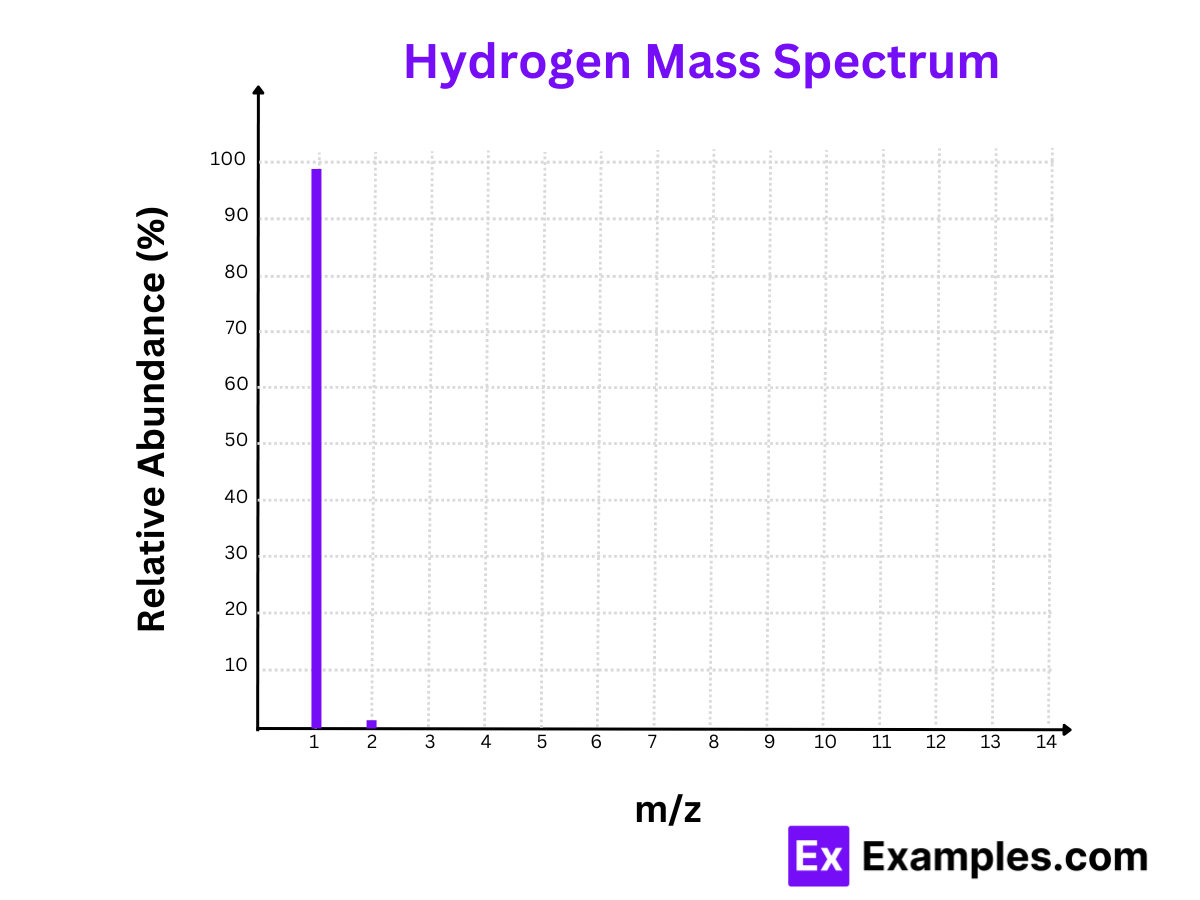
1. Hydrogen (H)
Isotopes:
- Protium (¹H)
- Deuterium (²H)
Mass Spectrum:
- Peaks at m/z = 1 and m/z = 2
Relative Abundances:
- Protium (¹H): 99.985%
- Deuterium (²H): 0.015%
Calculation:
- Protium (¹H): The m/z value is 1. Since hydrogen’s charge is +1, the mass is 1.
- Deuterium (²H): The m/z value is 2. Since deuterium’s charge is +1, the mass is 2.
The mass spectrum of hydrogen highlights the predominant presence of Protium, making up nearly 100% of hydrogen in nature.
Graph
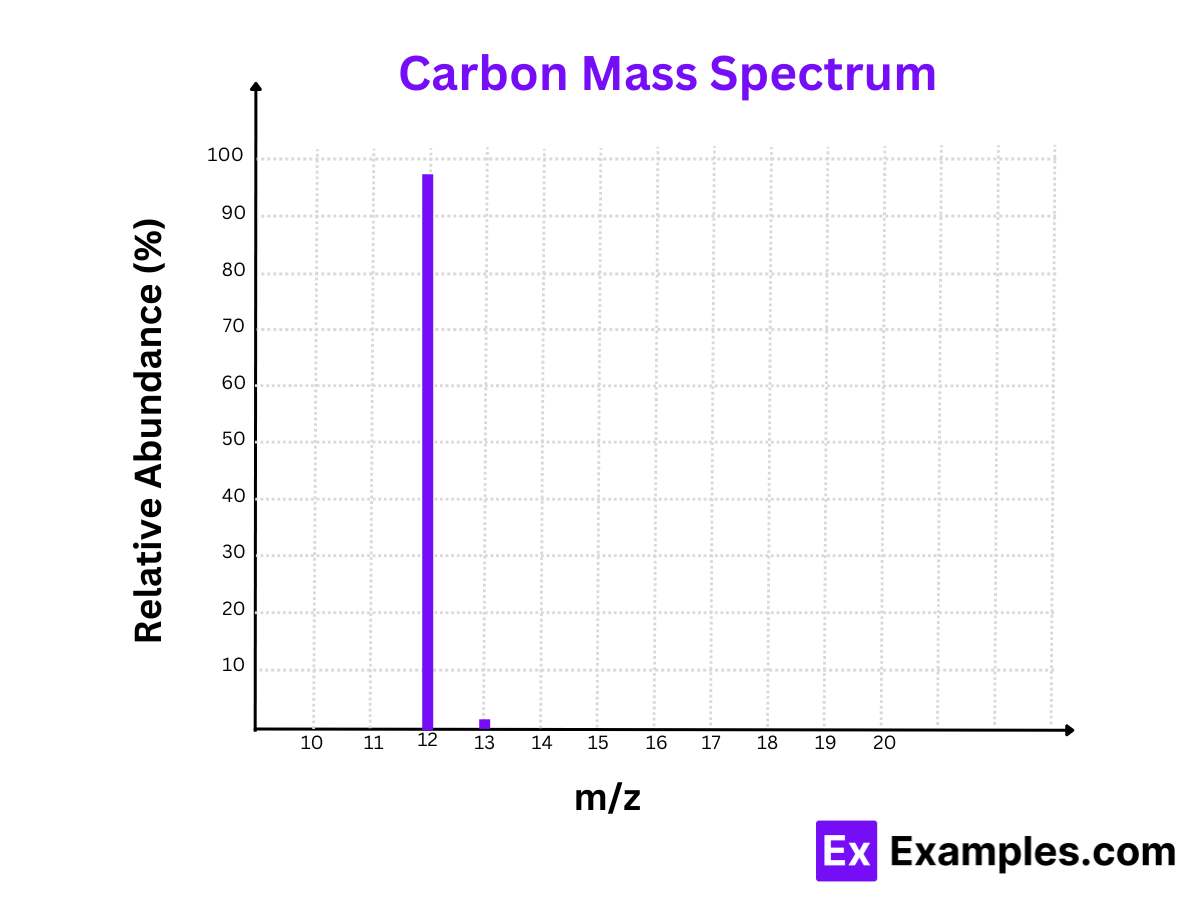
2. Carbon (C)
Isotopes:
- Carbon-12 (¹²C)
- Carbon-13 (¹³C)
Mass Spectrum:
- Peaks at m/z = 12 and m/z = 13
Relative Abundances:
- Carbon-12 (¹²C): 98.93%
- Carbon-13 (¹³C): 1.07%
Calculation:
- Carbon-12 (¹²C): The m/z value is 12. Since carbon’s charge is +1, the mass is 12.
- Carbon-13 (¹³C): The m/z value is 13. Since carbon’s charge is +1, the mass is 13.
The mass spectrum of carbon demonstrates that Carbon-12 is the most abundant isotope, vital for organic compounds.
Graph
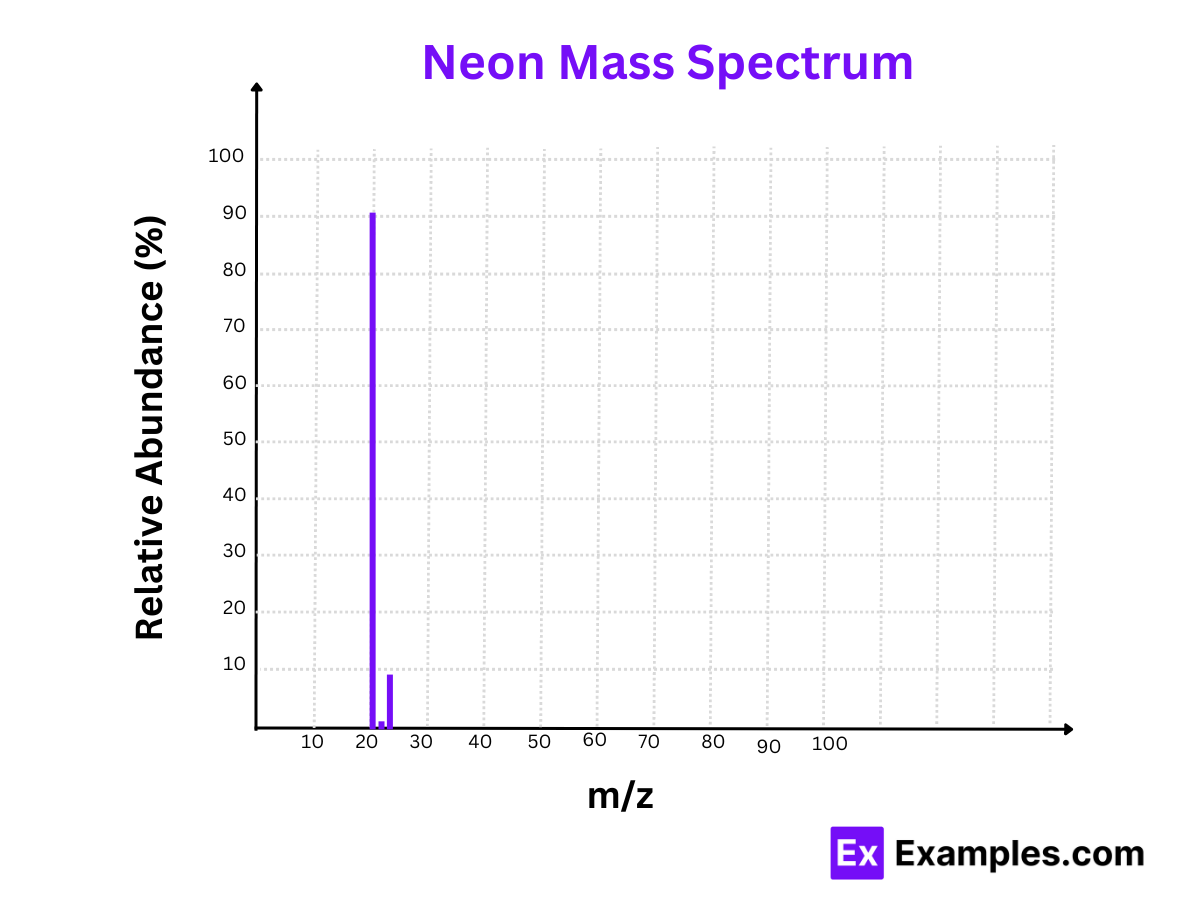
3. Neon (Ne)
Isotopes:
- Neon-20 (²⁰Ne)
- Neon-21 (²¹Ne)
- Neon-22 (²²Ne)
Mass Spectrum:
- Peaks at m/z = 20, m/z = 21, and m/z = 22
Relative Abundances:
- Neon-20 (²⁰Ne): 90.48%
- Neon-21 (²¹Ne): 0.27%
- Neon-22 (²²Ne): 9.25%
The mass spectrum of neon shows Neon-20 as the most prevalent isotope, making up over 90% of naturally occurring neon.
Graph
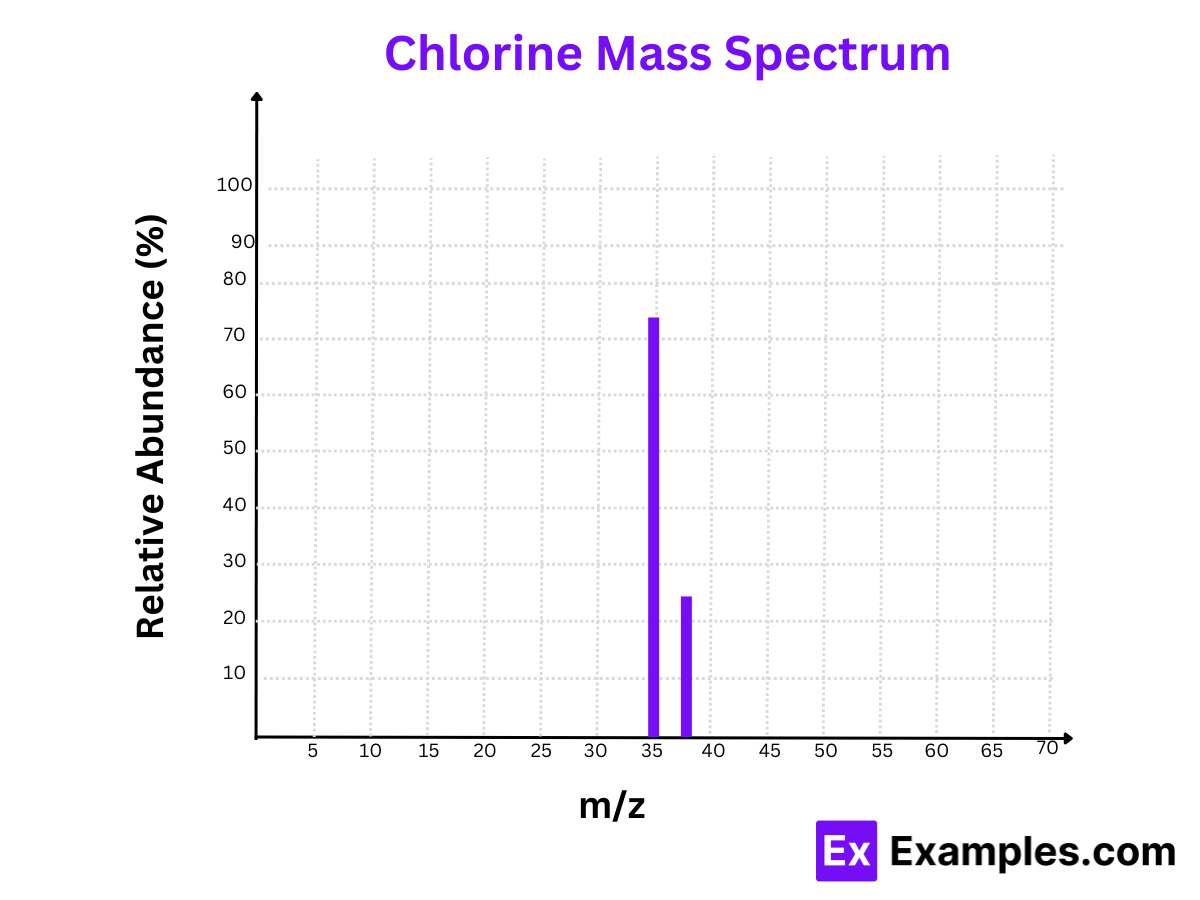
4. Chlorine (Cl)
Isotopes:
- Chlorine-35 (³⁵Cl)
- Chlorine-37 (³⁷Cl)
Mass Spectrum:
- Peaks at m/z = 35 and m/z = 37
Relative Abundances:
- Chlorine-35 (³⁵Cl): 75.77%
- Chlorine-37 (³⁷Cl): 24.23%
Calculation:
- Chlorine-35 (³⁵Cl): The m/z value is 35. Since chlorine’s charge is +1, the mass is 35.
- Chlorine-37 (³⁷Cl): The m/z value is 37. Since chlorine’s charge is +1, the mass is 37.
The mass spectrum of chlorine reveals the significant presence of both Chlorine-35 and Chlorine-37, important for chemical reactions and compounds.
Graph
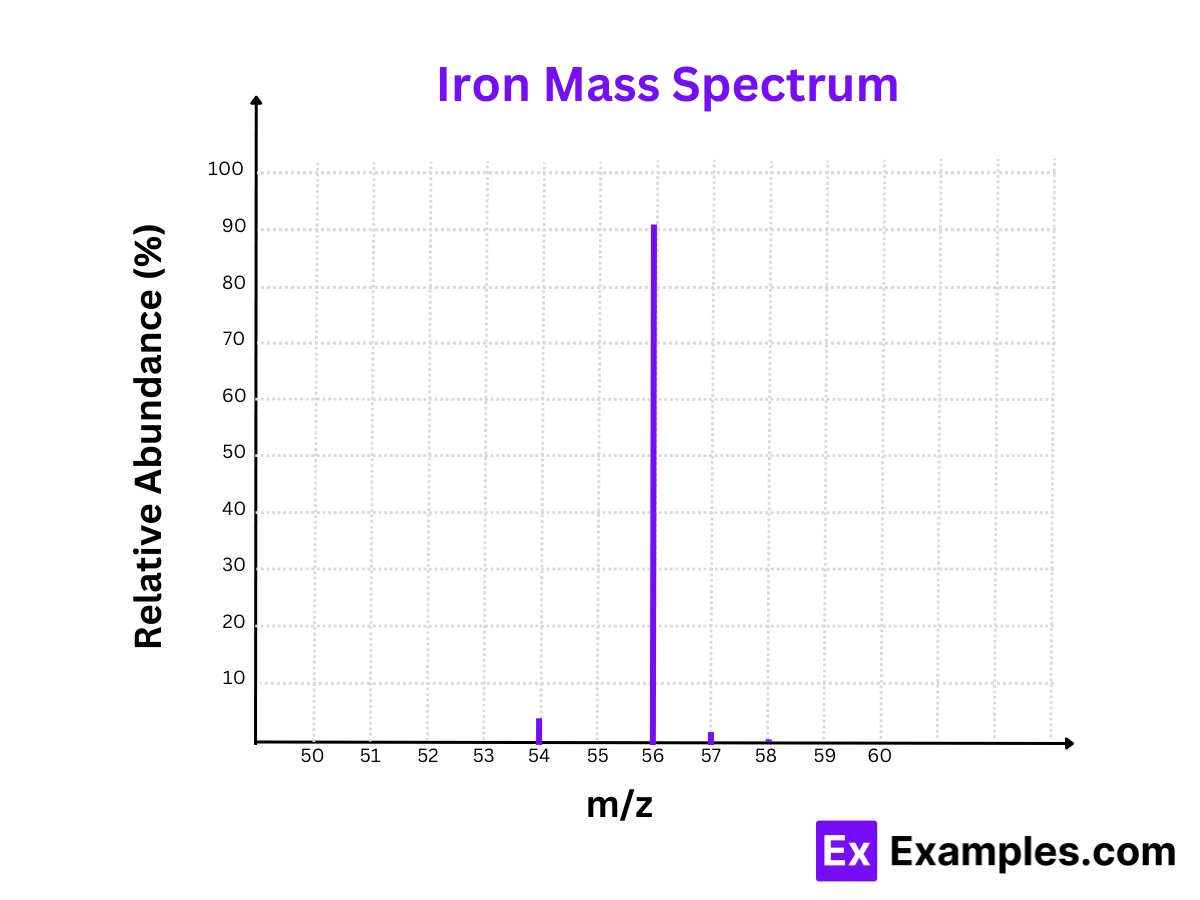
5. Iron (Fe)
Isotopes:
- Iron-54 (⁵⁴Fe)
- Iron-56 (⁵⁶Fe)
- Iron-57 (⁵⁷Fe)
- Iron-58 (⁵⁸Fe)
Mass Spectrum:
- Peaks at m/z = 54, m/z = 56, m/z = 57, and m/z = 58
Relative Abundances:
- Iron-54 (⁵⁴Fe): 5.84%
- Iron-56 (⁵⁶Fe): 91.75%
- Iron-57 (⁵⁷Fe): 2.12%
- Iron-58 (⁵⁸Fe): 0.28%
Calculation:
- Iron-54 (⁵⁴Fe): The m/z value is 54. Since iron’s charge is +1, the mass is 54.
- Iron-56 (⁵⁶Fe): The m/z value is 56. Since iron’s charge is +1, the mass is 56.
- Iron-57 (⁵⁷Fe): The m/z value is 57. Since iron’s charge is +1, the mass is 57.
- Iron-58 (⁵⁸Fe): The m/z value is 58. Since iron’s charge is +1, the mass is 58.
The mass spectrum of iron highlights Iron-56 as the most abundant isotope, essential for steel production and biological functions.
Graph