
Multistep Reaction Energy Profile

Learning Objectives
By studying the multistep reaction energy profile for the AP Chemistry exam, you should aim to understand the structure and components of energy profile diagrams, including reactants, products, intermediates, and transition states. Learn to identify and calculate activation energies (Eₐ) and enthalpy changes (ΔH) for each step in a reaction. Recognize the significance of intermediates and transition states in the reaction mechanism. Develop the ability to draw and interpret complex energy profile diagrams. Finally, understand the impact of catalysts, temperature, and concentration on multistep reactions, and be able to apply these concepts to real-world chemical reactions.
Free AP Chemistry Practice Test
Introduction
A multistep reaction energy profile is a graphical representation that illustrates the energy changes occurring throughout a reaction involving multiple elementary steps. Each step in the reaction sequence is depicted with its own activation energy barrier and transition state, highlighting the progress of reactants transforming into intermediates and ultimately into products. This profile provides critical insights into the kinetics and mechanism of the reaction, showing the relative stability of intermediates and the energy required to overcome each transition state. Understanding these profiles helps chemists optimize reaction conditions and develop efficient catalytic processes.
What is Multistep Reaction?

A multistep reaction involves a series of elementary steps, each with its own transition state and intermediate products, leading to the overall reaction. Unlike single-step reactions, multistep reactions exhibit a more complex energy profile, displaying multiple peaks and valleys.
Energy Profile Diagram
An energy profile diagram visually represents the energy changes that occur during a chemical reaction. It is an essential tool for understanding the kinetics and mechanisms of multistep reactions. Here, we'll outline the components and construction of an energy profile diagram, particularly focusing on a multistep reaction.
Components of an Energy Profile Diagram
Reactants and Products: The starting materials and the final products of the reaction.
Intermediates: Species formed in the middle of the reaction pathway.
Transition States: High-energy states that the reactants pass through to form intermediates or products.
Activation Energy (Ea): The energy required to reach the transition state from the reactants or intermediates.
ΔH (Enthalpy Change): The overall change in energy from reactants to products.
Example of a Multistep Reaction
Consider the reaction: A → B → C
Step 1: A → B (Ea1)
Step 2: B → C (Ea2)
Constructing the Energy Profile Diagram
Start with Reactants: Begin at the energy level of the reactants (A).
First Transition State: Draw a peak to represent the transition state for the first step (A to B). The height of this peak corresponds to the activation energy (Ea1).
Intermediate: After the first transition state, drop down to the energy level of the intermediate (B).
Second Transition State: Draw another peak to represent the transition state for the second step (B to C). The height of this peak corresponds to the activation energy (Ea2).
Products: Finally, drop down to the energy level of the products (C).
Example Energy Profile Diagram
Here's an illustrative example of how the energy profile diagram would look for the reaction A → B → C:
Reactants (A): Start at the initial energy level.
Transition State 1: A peak indicating the energy needed to overcome the first activation barrier (Ea1).
Intermediate (B): A valley representing the intermediate species.
Transition State 2: A second peak indicating the energy needed to overcome the second activation barrier (Ea2).
Products (C): The final energy level representing the products.
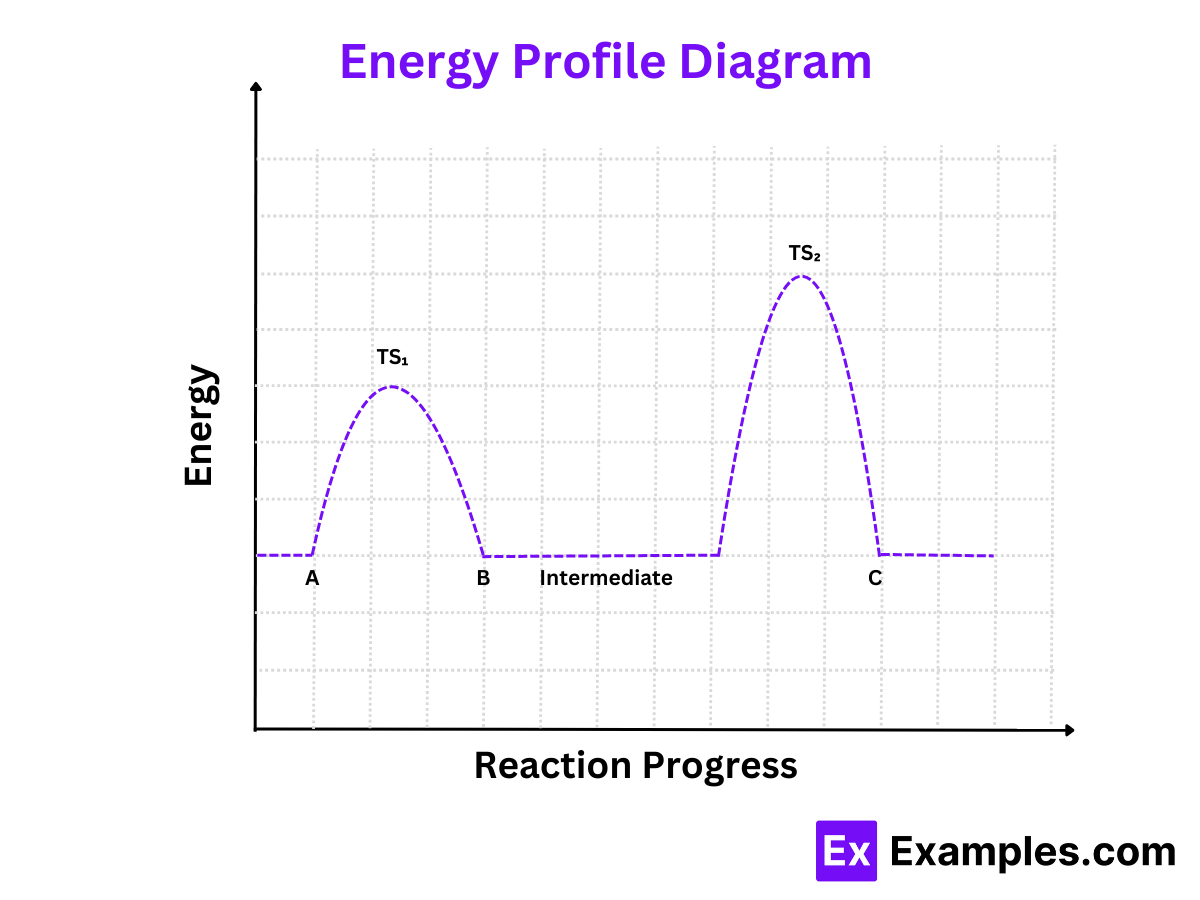
TS1: Transition State 1 (between A and B)
TS2: Transition State 2 (between B and C)
Intermediate: The valley between TS₁ and TS₂
Interpretation
Activation Energies (Ea₁ and Ea₂): The heights of the peaks (TS1 and TS2) relative to the starting points of each step.
Intermediates: The valleys between the peaks, representing species that are not as stable as reactants or products but more stable than transition states.
Overall Enthalpy Change (ΔH): The difference in energy between the reactants (A) and the products (C). If the products are lower in energy than the reactants, the reaction is exothermic. If higher, it is endothermic.
Drawing a Multistep Reaction Energy Profile
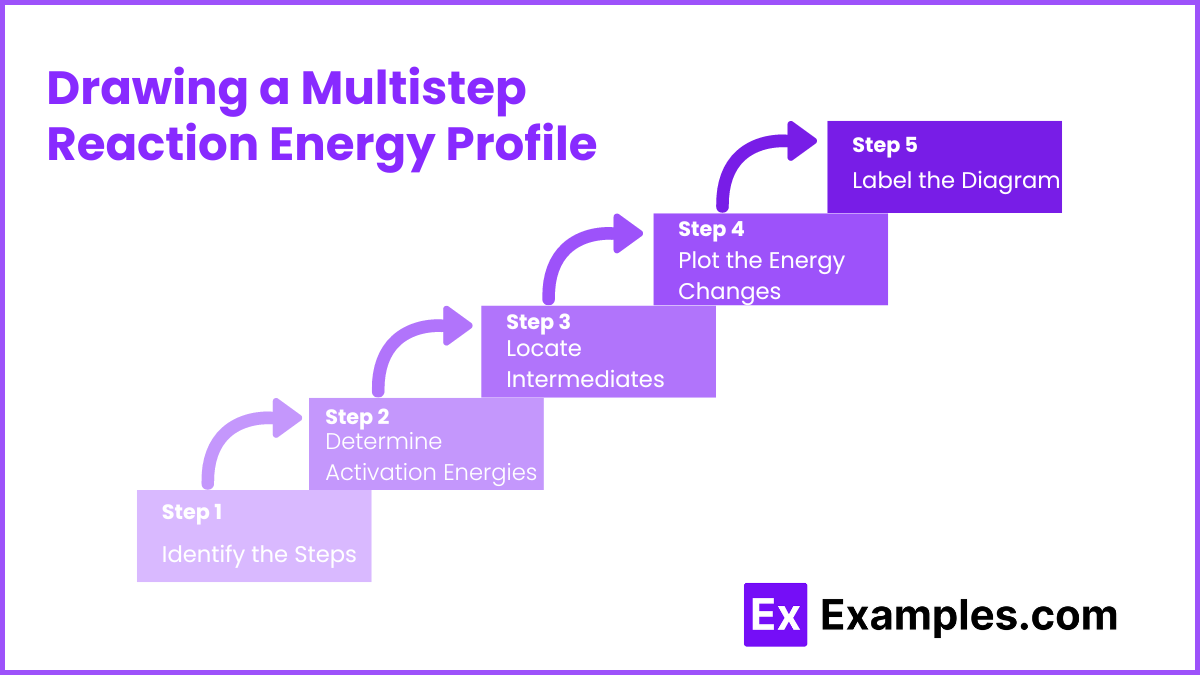
Identify the Steps: Break down the overall reaction into its elementary steps.
Determine Activation Energies: For each step, determine the activation energy (Ea).
Locate Intermediates: Identify the intermediates formed between steps.
Plot the Energy Changes:
Start with the energy level of the reactants.
For each step, plot a peak for the transition state and a valley for the intermediate. Continue until you reach the energy level of the products.
Label the Diagram: Clearly mark the reactants, products, intermediates, transition states, activation energies (Ea), and enthalpy changes (ΔH).
Intermediates and Transition States
Intermediates
Formation: Intermediates are species that form during the reaction but do not appear in the overall balanced equation. They exist temporarily as the reaction progresses from reactants to products.
Stability: Intermediates are more stable than transition states but less stable than the reactants and products. They typically reside in the valleys of an energy profile diagram, representing local minima in the energy landscape.
Detection: Intermediates can sometimes be isolated or detected experimentally, often using spectroscopic methods. Their relative stability compared to transition states allows for this detection.
Transition States
Characteristics: Transition states represent the highest energy points along the reaction pathway. They are critical configurations where bonds are partially broken and formed. These states are fleeting and cannot be isolated.
Energy: Transition states require the most energy to form. The energy needed to reach a transition state from the reactants or intermediates is known as the activation energy (Ea). Peaks in the energy profile diagram represent these transition states.
Identification: Transition states are identified through computational chemistry methods and inferred from reaction kinetics. They are crucial for understanding the energy barriers that must be overcome for the reaction to proceed.
Factors Affecting Multistep Reaction Profiles
Catalysts: Lower activation energy (Ea) for each step, provide an alternative pathway, increase reaction rate without being consumed.
Temperature: Increases kinetic energy of molecules, more molecules overcome activation barriers, enhances collision frequency and energy.
Concentration: Higher reactant concentrations increase collision likelihood, greater collision frequency, affects formation rate of intermediates and transition states.
Pressure: For gas reactions, higher pressure increases reaction rate, reduces volume, increases concentration of gas molecules, more frequent collisions.
Solvent: Stabilizes or destabilizes intermediates and transition states, polar solvents stabilize charged intermediates, solvent viscosity affects diffusion rate of reactants.
Surface Area: For heterogeneous reactions, increasing surface area of solid reactants or catalysts increases reaction rate, more sites for reactions, enhanced contact between reactants.
Nature of Reactants: Chemical nature and reactivity influence energy profile, stronger bonds require more energy to break, reactants with lower bond energies have lower activation barriers.
Presence of Inhibitors: Increase activation energy by interfering with reactants or catalysts, block active sites, react with intermediates, slow reaction rate by raising energy barriers.
Reaction Pathway: Mechanism of reaction affects energy profile, more complex pathways have multiple high-energy transition states, simpler pathways have lower overall activation energies.
Example Reaction: The Chlorination of Methane
The chlorination of methane is a classic example of a multistep reaction involving free radicals. This reaction proceeds through several steps, each with its own intermediates and transition states.
Reaction Steps
Initiation:
Equation: Cl₂ → 2Cl•
Description: The chlorine molecule dissociates into two chlorine radicals in the presence of ultraviolet light or heat.
Transition State: High-energy state as the Cl - Cl bond breaks.
Activation Energy (Ea1): Energy required to break the Cl - Cl bond.
Propagation:
Step 1:
Equation: Cl• + CH₄ → CH₃• + HCl
Description: A chlorine radical reacts with methane, producing a methyl radical and hydrogen chloride.
Transition State: High-energy state during the bond formation and breaking process.
Activation Energy (Ea2): Energy required for this reaction step.
Intermediate: Methyl radical (CH₃•).
Step 2:
Equation: CH₃• + Cl₂ → CH₃Cl + Cl•
Description: The methyl radical reacts with another chlorine molecule to form chloromethane and regenerate a chlorine radical.
Transition State: High-energy state during this bond formation and breaking process.
Activation Energy (Ea3): Energy required for this reaction step.
Termination:
Equations:
Cl• + Cl• → Cl₂
CH₃• + Cl• → CH₃Cl
CH₃• + CH₃• → C₂H₆
Description: Radicals combine to form stable molecules, terminating the chain reaction.
Transition States: Various high-energy states during the termination steps.
Activation Energy (Ea4, Ea5, Ea6): Energies required for these termination steps.
Energy Profile Diagram for Chlorination of Methane
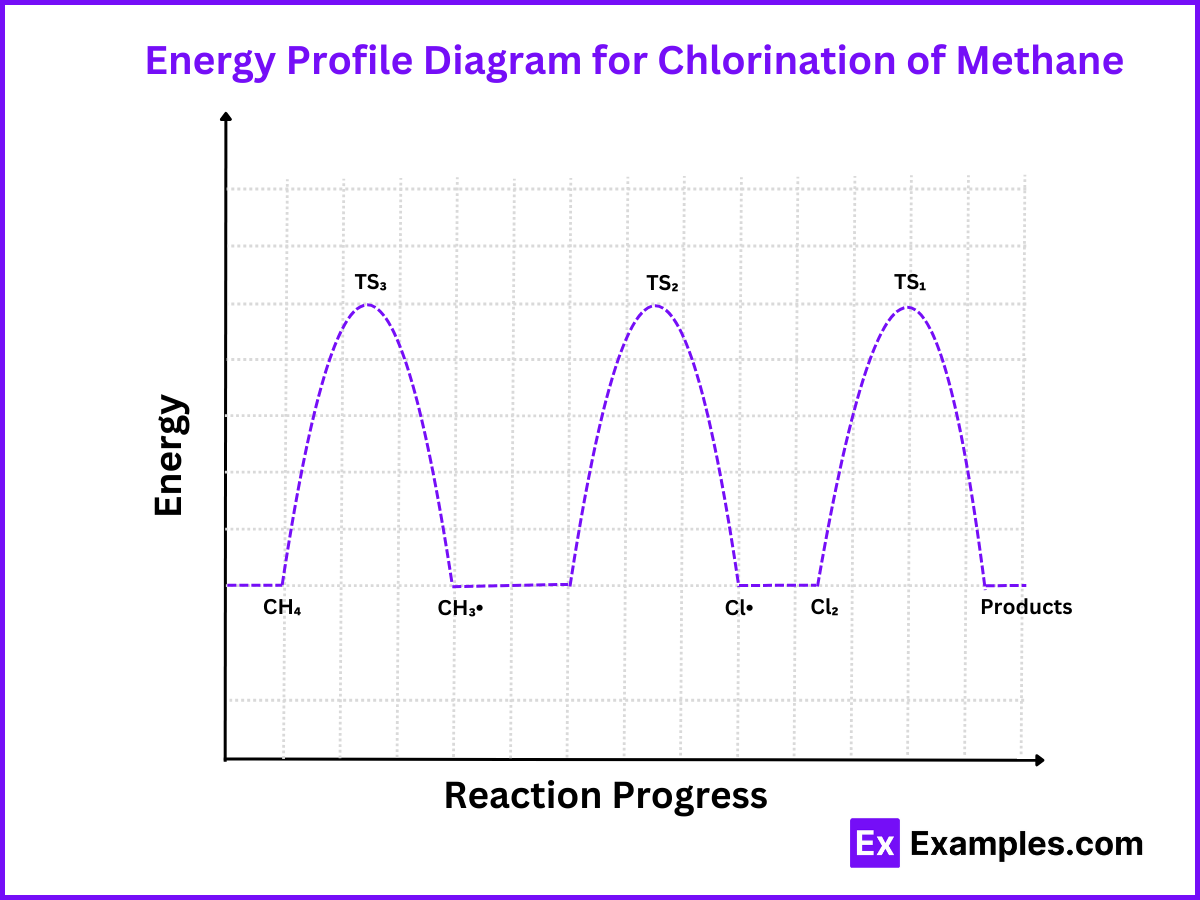
Components of the Energy Profile
Reactants (CH₄ and Cl₂): Start at the initial energy level.
Transition State 1 (TS₁): Peak indicating the energy needed to break Cl₂ into two Cl radicals (Ea₁).
Intermediate (Cl•): Valley representing the chlorine radicals.
Transition State 2 (TS₂): Peak indicating the energy needed for the reaction between Cl radical and methane to form methyl radical and HCl (Ea2).
Intermediate (CH₃•): Valley representing the methyl radical.
Transition State 3 (TS₃): Peak indicating the energy needed for the reaction between the methyl radical and Cl2 to form chloromethane and regenerate a Cl radical (Ea3).
Products (CH₃Cl and HCl): Final energy level representing the stable products.
Interpretation
Activation Energies (Ea₁, Ea₂, Ea₃): Heights of the peaks (TS₁, TS₂, TS₃) relative to the starting points of each step.
Intermediates (Cl•, CH₃•): Valleys between the peaks, representing species that are not as stable as reactants or products but more stable than transition states.
Overall Enthalpy Change (ΔH): Difference in energy between the reactants and products. The reaction is typically exothermic, with the products being lower in energy than the reactants.