Extracting information from data is the process of analyzing large datasets to uncover patterns, trends, and insights that guide decision-making. In AP Computer Science Principles, this involves using algorithms, statistical methods, and data visualization to transform raw data into meaningful information. Key steps include data collection, cleaning, transformation, and interpretation. Understanding these processes is crucial for identifying relationships within data and solving real-world problems, from business strategies to scientific research, while also addressing ethical concerns related to privacy and bias.
Learning Objectives
For the topic “Extracting Information From Data” in AP Computer Science Principles, students should learn how to collect, clean, and transform data to extract meaningful information. This includes understanding key techniques like data visualization, statistical analysis, and algorithms used to identify patterns and relationships in data. Students must also develop skills to interpret the results accurately and ethically, considering privacy and bias concerns. By mastering these concepts, students can make informed decisions based on data and solve real-world problems effectively.
Extracting Information From Data in AP Computer Science Principles
Overview of Data Extraction
Data extraction refers to the process of retrieving specific information from large datasets. This process involves identifying patterns, relationships, and trends in raw data to turn it into meaningful and actionable insights. In the context of the AP Computer Science Principles Exam, understanding data extraction is crucial because it forms the basis for how decisions are made using technology, algorithms, and computing systems.
Importance of Data Extraction
Extracting information from data is essential in many fields, including science, business, and medicine. Large amounts of data, also known as big data, can be difficult to analyze manually. Automated systems and algorithms help process and extract valuable insights that can guide decision-making. Data extraction enables organizations to identify trends, make predictions, and optimize performance.
Steps in Extracting Information from Data
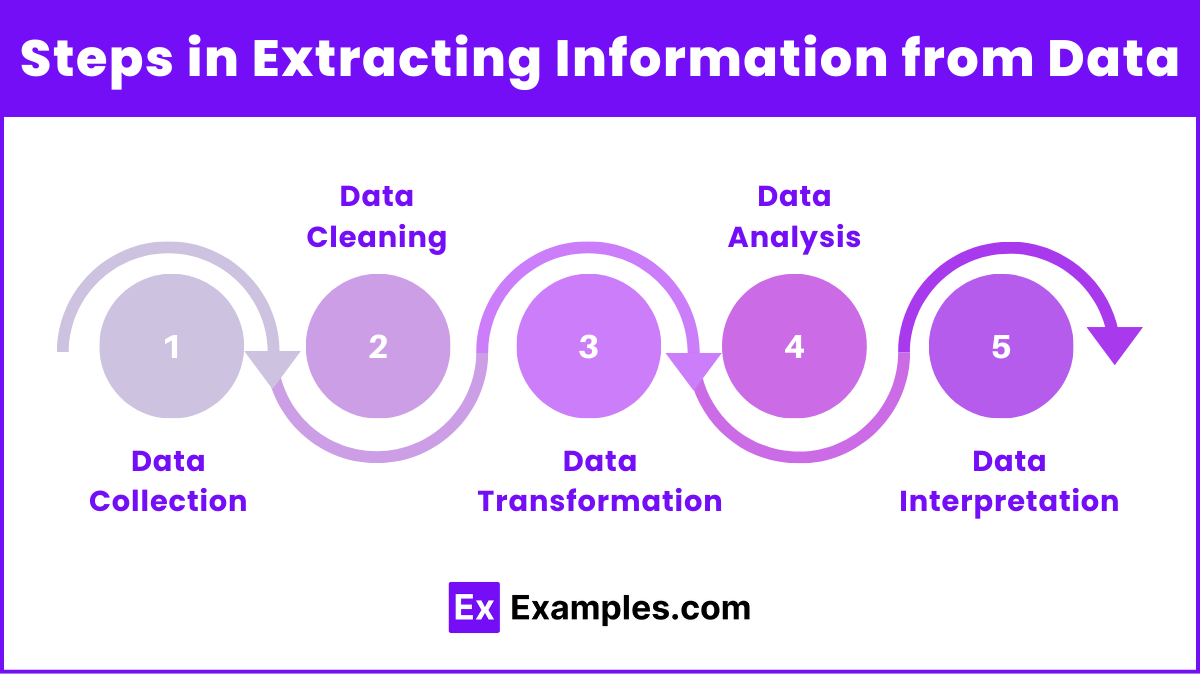
- Data Collection: Data must first be gathered from various sources, such as surveys, databases, sensors, or web scraping.
- Data Cleaning: Raw data often contains errors, inconsistencies, or incomplete values, so it needs to be cleaned. This involves removing duplicates, correcting errors, and handling missing data.
- Data Transformation: The data may need to be transformed into a more useful format, like converting text into numbers or categorizing information.
- Data Analysis: The cleaned data is then analyzed using algorithms, statistical methods, and visualization tools to uncover patterns, correlations, and trends.
- Data Interpretation: Once the analysis is complete, the results must be interpreted to provide actionable insights or answers to specific questions.
Application of Data Extraction
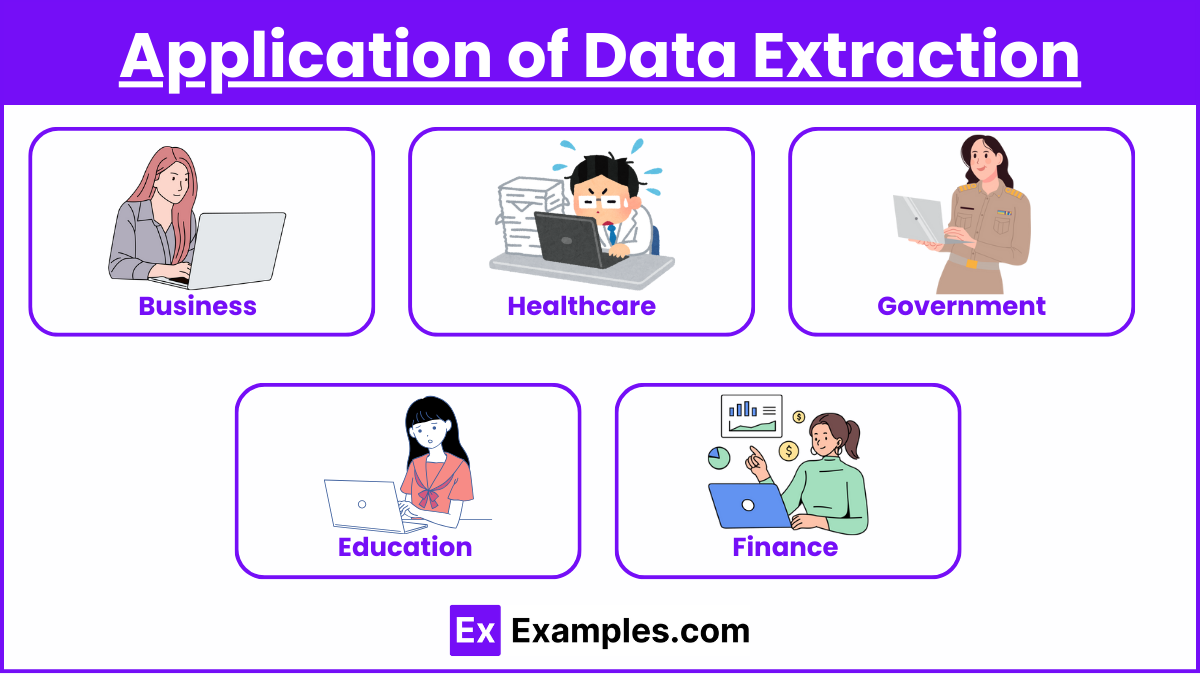
- Business: Companies extract data from customer interactions to improve products and services, tailor marketing campaigns, and enhance customer experience.
- Healthcare: Doctors use data from medical records to identify health trends and provide better care for patients.
- Government: Data from surveys and censuses can help governments plan infrastructure and allocate resources efficiently.
- Education : Schools and universities analyze student performance data to identify learning gaps, tailor instruction to meet individual needs, and improve overall teaching strategies. Data from online learning platforms is also used to enhance the digital learning experience and optimize course content.
- Finance : Financial institutions use data extraction to detect fraudulent activities by analyzing transaction patterns. Banks and investment firms also rely on data to assess risk, predict market trends, and make informed decisions on loans, investments, and asset management.
Tools and Techniques
Tools and Techniques refer to the various methods, software, and processes used to gather, analyze, and present data in meaningful ways. These tools can include both manual and automated systems that facilitate data manipulation, storage, and interpretation. Techniques often involve statistical analysis, algorithms, and machine learning models that help extract insights from raw data. Together, tools and techniques are essential for efficiently processing vast amounts of information, enabling users to make data-driven decisions and derive actionable insights from complex datasets.
- Data Visualization: Tools like graphs, charts, and dashboards are used to present data in an easy-to-understand format.
- Algorithms and Models: Algorithms such as clustering, regression, and classification help identify patterns in data.
- Spreadsheets and Databases: Programs like Excel and database management systems (DBMS) enable structured data storage and analysis.
- Data Mining: This process uses various statistical and machine learning techniques to discover patterns and relationships within large datasets.
Examples
Example 1: Retail Sales Analysis
A retail company collects data from millions of transactions every day. By analyzing this data, the company can identify which products sell best during certain times of the year, what items are often purchased together, and which customer segments are most likely to buy specific products. This helps the company optimize inventory management, tailor promotions, and make data-driven decisions to increase sales and improve customer satisfaction.
Example 2: Weather Prediction
Meteorological organizations gather vast amounts of data from satellites, weather stations, and ocean buoys. This data includes temperature, humidity, wind speed, and atmospheric pressure. By applying algorithms to this data, weather scientists can identify patterns that indicate future weather conditions, such as the likelihood of storms or temperature changes. This information is essential for providing accurate weather forecasts that help people prepare for extreme weather events.
Example 3: Healthcare Diagnostics
Hospitals and medical institutions collect patient data from various sources, such as electronic health records, lab results, and medical imaging. By analyzing this data, healthcare professionals can identify patterns that assist in diagnosing diseases earlier. For example, algorithms can analyze medical images to detect abnormalities, while patient history data can be used to predict the risk of developing certain conditions, allowing doctors to offer preventive care and personalized treatment plans.
Example 4: Social Media Trend Analysis
Social media platforms like Twitter and Facebook generate massive amounts of data daily. Companies and researchers can analyze this data to understand public sentiment and identify trends. For instance, by tracking the frequency and content of certain hashtags or keywords, organizations can extract insights about how users feel about a brand, product, or event. This information is valuable for marketing campaigns and can help shape communication strategies to align with public interest.
Example 5: Traffic Optimization
Cities collect real-time data from traffic cameras, GPS systems in vehicles, and traffic sensors on roads. By analyzing this data, traffic management systems can identify patterns in congestion and predict peak traffic hours. The data helps city planners optimize traffic light timings, reroute vehicles to less congested areas, and improve road infrastructure. These insights can reduce traffic jams, lower emissions, and enhance overall road safety and efficiency.
Multiple Choice Questions
Question 1
What is the primary purpose of data cleaning in the process of extracting information from data?
A) To gather more data from various sources
B) To remove errors and inconsistencies in the data
C) To visualize data using graphs and charts
D) To sort data alphabetically for easier access
Answer: B) To remove errors and inconsistencies in the data
Explanation: Data cleaning is a critical step in preparing raw data for analysis. The purpose of this step is to remove errors, inconsistencies, and irrelevant data that might distort analysis. By cleaning the data, you ensure that the information used in subsequent steps (like analysis and visualization) is accurate and reliable. Data cleaning includes removing duplicates, filling missing values, and correcting inaccuracies.
Question 2
Which of the following tools is commonly used to visualize data for better understanding and analysis?
A) Data Mining
B) Regression Analysis
C) Charts and Graphs
D) Clustering Algorithms
Answer: C) Charts and Graphs
Explanation: Data visualization tools, such as charts, graphs, and dashboards, are used to present data in a visually understandable format. These tools allow users to easily identify patterns, trends, and relationships within the data. While data mining, regression analysis, and clustering algorithms help in the analysis process, charts and graphs are specifically designed for visualization, making it easier to extract insights and share findings with others.
Question 3
What is the ethical concern that arises most commonly when extracting information from large datasets?
A) The use of incorrect algorithms
B) The cost of data storage
C) Violating individuals’ privacy by using their personal data without consent
D) Inconsistent data cleaning processes
Answer: C) Violating individuals’ privacy by using their personal data without consent
Explanation: One of the most significant ethical concerns in data extraction is the potential violation of privacy. When organizations collect and analyze personal data, they must ensure that individuals’ privacy is protected and that the data is used ethically. This includes obtaining consent for data collection and ensuring that the data is anonymized when appropriate. Mishandling data can lead to privacy breaches and misuse, making this a critical consideration in any data extraction process.

