
Age Structure Diagrams

Age structure diagrams are vital tools in ecology for visualizing the distribution of different age groups within a population, offering insights into growth trends and demographic challenges. These diagrams help ecologists understand how populations within an ecosystem might change over time, affecting biodiversity and the sustainability of natural resources. By examining age structures, scientists can predict future population dynamics and their potential impacts on the biosphere, ultimately aiding in the development of strategies for conservation and resource management.
Learning Objective
Age Structure Diagrams illustrate the distribution of organisms within populations across different age groups. Learning objectives include interpreting diagram shapes (pyramidal, columnar, inverted), analyzing implications for flora and fauna conservation, and predicting demographic trends. Students will understand how these diagrams reflect climate changes impact on population dynamics, such as aging populations or youth bulges. Mastery involves linking age structures to resource demands, environmental pressures, and conservation strategies, crucial for evaluating ecological resilience and human impacts on ecosystems in the AP Environmental Studies exam.
Key Concepts
- Definition and Purpose
- Age structure diagrams display the number or percentage of individuals in different age categories, typically divided by gender.
- They help illustrate the growth patterns and predict future demographic changes in a population.
- Structure of Age Diagrams
- X-Axis: Represents the population size or percentage of the total population.
- Y-Axis: Represents age categories, typically in five-year increments.
- Left Side: Usually shows the male population.
- Right Side: Usually shows the female population.
- Types of Age Structure Diagrams
- Expansive (Pyramid Shape): Wide base, indicating a high proportion of young individuals, suggestive of high birth rates and potential for rapid population growth. Common in developing countries.
- Constrictive (Inverted Pyramid): Narrow base, indicating a lower number of young individuals, suggestive of low birth rates and an aging population. Common in developed countries.
- Stationary (Rectangular): Roughly equal numbers of individuals across age groups, indicating low birth and death rates, and stable population growth. Common in developed countries.
Population Dynamics
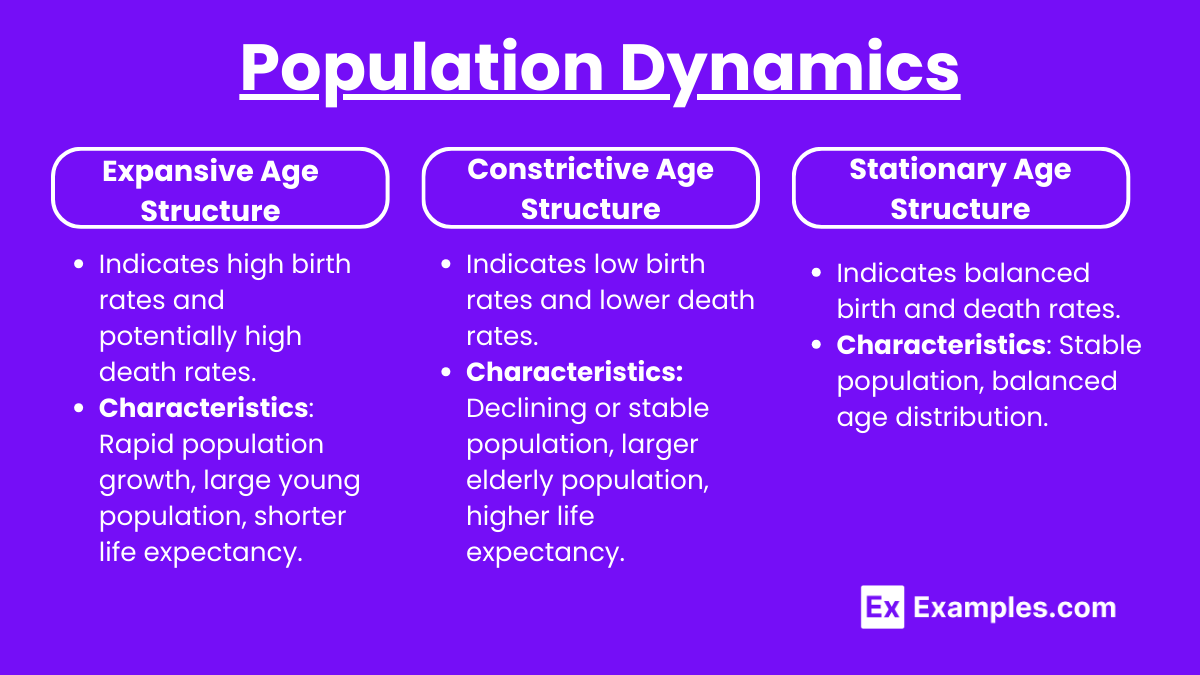
- Expansive Age Structure
- Indicates high birth rates and potentially high death rates.
- Characteristics: Rapid population growth, large young population, shorter life expectancy.
- Implications: Increased demand for education, healthcare, and jobs for the young population; potential for rapid economic growth if resources are managed well.
- Constrictive Age Structure
- Indicates low birth rates and lower death rates.
- Characteristics: Declining or stable population, larger elderly population, higher life expectancy.
- Implications: Increased demand for elderly care, potential labor shortages, higher dependency ratio.
- Stationary Age Structure
- Indicates balanced birth and death rates.
- Characteristics: Stable population, balanced age distribution.
- Implications: Stable demand for resources and services, easier to manage economic growth and resource allocation.
Factors Influencing Age Structure
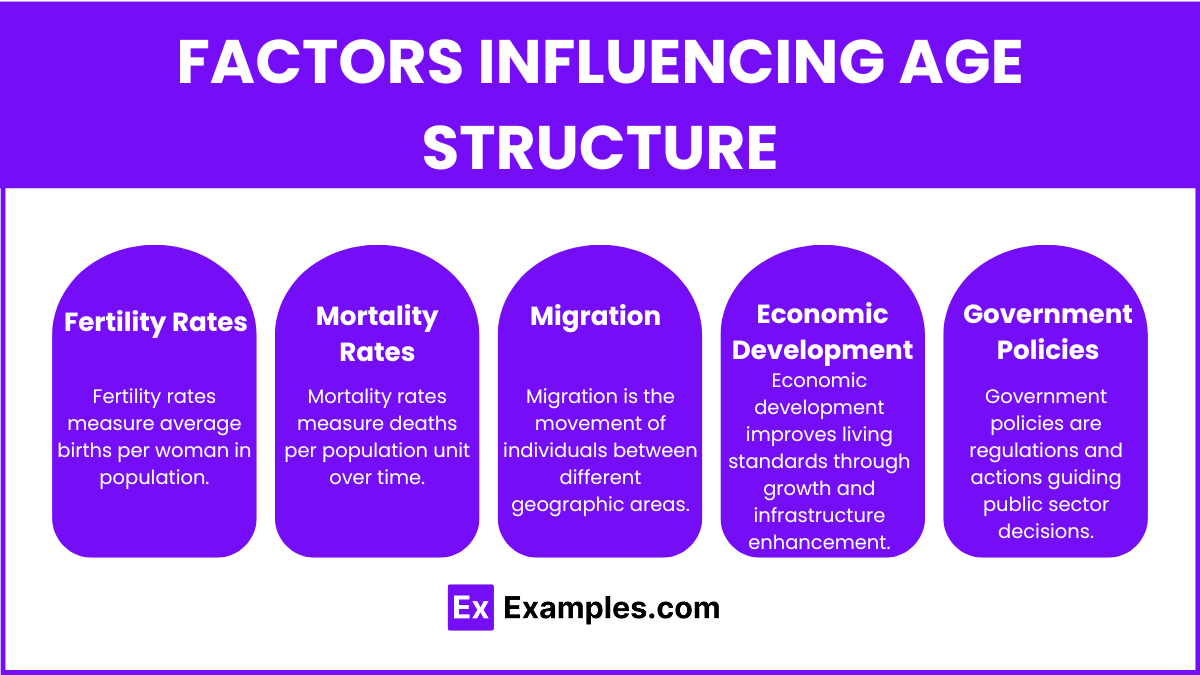
- Fertility Rates
- High fertility rates lead to expansive age structures.
- Low fertility rates contribute to constrictive age structures.
- Mortality Rates
- High mortality rates can create expansive structures due to a high proportion of young individuals.
- Low mortality rates contribute to stationary or constrictive structures due to higher life expectancy.
- Migration
- Influx of young migrants can widen the base of the age structure.
- Emigration of young individuals can narrow the base, leading to a constrictive structure.
- Economic Development
- Developing countries typically have expansive age structures due to higher birth rates and lower access to healthcare.
- Developed countries typically have constrictive or stationary age structures due to lower birth rates and higher access to healthcare.
- Government Policies
- Policies promoting or limiting birth rates can significantly alter age structures.
- Examples: China’s One-Child Policy led to a constrictive structure; pro-natalist policies in some European countries aim to counteract declining birth rates.
Case Studies
- Nigeria (Expansive Structure)
- High fertility rates and a large young population.
- Challenges: High demand for education and employment, strain on healthcare systems, potential for rapid population growth.
- Japan (Constrictive Structure)
- Low fertility rates and a large elderly population.
- Challenges: Labor shortages, high dependency ratio, increased need for elderly care.
- United States (Stationary Structure)
- Balanced age distribution due to moderate birth and death rates.
- Challenges: Managing resources and services for a stable population, ensuring sustainable economic growth.