
Survivorship curves

Survivorship curves are graphical representations that illustrate the number of individuals in a population that survive to different ages. These curves are crucial for understanding the dynamics of an ecosystem and the intricate balance within ecology. They reveal patterns of mortality and survival, which are essential for assessing the health and sustainability of biodiversity. Different types of survivorship curves—Type I, II, and III—highlight various survival strategies among species, ranging from organisms with high survival rates until old age to those with high mortality rates early in life. The analysis of these curves helps ecologists predict the future of flora and organisms within a given ecosystem, informing conservation strategies and efforts to maintain ecological balance.
Free AP Environmental Science Practice Test
Learning Objectives
The learning objectives for survivorship curves involve understanding the three main types (Type I, Type II, and Type III) and their implications for population dynamics and life history strategies. Students should analyze factors influencing survivorship patterns, such as environmental conditions, predation, and species-specific traits. Key objectives include interpreting survivorship data to predict population growth or decline, comparing survivorship curves across different species and environments, and assessing how human activities impact survivorship rates. Additionally, students will explore the ecological significance of survivorship curves in conservation biology, ecosystem management, and understanding the resilience of populations to natural and anthropogenic disturbances.
Definition
Survivorship curves are graphical representations that show the number of individuals of a species or population that survive to different ages. These curves are crucial for understanding population dynamics, life history strategies, and the ecological characteristics of species. There are three main types of survivorship curves: Type I, Type II, and Type III.
Key Concepts
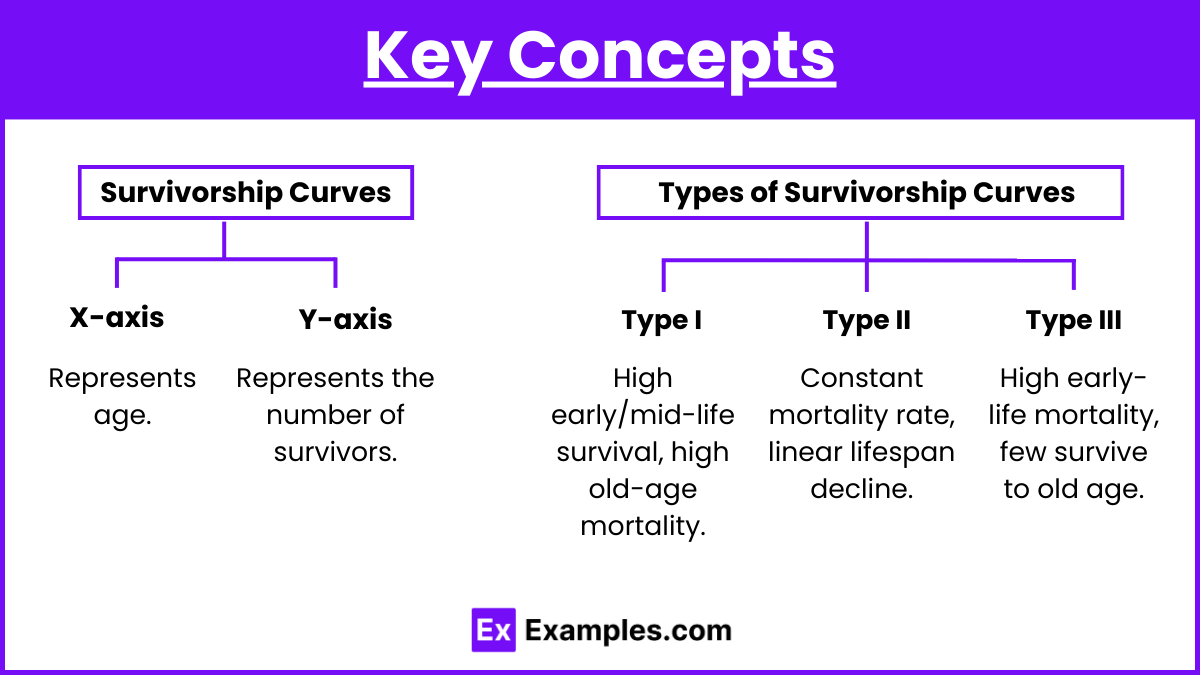
Survivorship Curves:
X-axis: Represents age.
Y-axis: Represents the number of survivors (often on a logarithmic scale).
Types of Survivorship Curves:
Type I: High survival rates during early and middle life, followed by a high mortality rate in older age groups.
Type II: Constant mortality rate throughout the lifespan, resulting in a linear decline.
Type III: High mortality rates in early life, with few individuals surviving to older age groups.
Detailed Breakdown
Type I Survivorship Curve:
Characteristics:
Low infant mortality.
High parental care and investment in offspring.
Most individuals survive to old age, and mortality increases sharply in older age.
Examples: Humans, large mammals (e.g., elephants, whales).
Life History Strategy: K-selected species, which produce fewer offspring but invest significantly in their care.
Type II Survivorship Curve:
Characteristics:
Constant probability of dying at any age.
Steady decline in survivors over time.
Examples: Birds, some reptiles, and rodents.
Life History Strategy: Species with relatively balanced reproductive and survival strategies.
Type III Survivorship Curve:
Characteristics:
High mortality rates for young individuals.
Low survival rates initially, but those that survive the early period live longer.
Little or no parental care.
Examples: Many fish, insects, plants (e.g., oak trees with acorns).
Life History Strategy: r-selected species, which produce many offspring with low survival rates per individual.
Factors Influencing Survivorship Curves
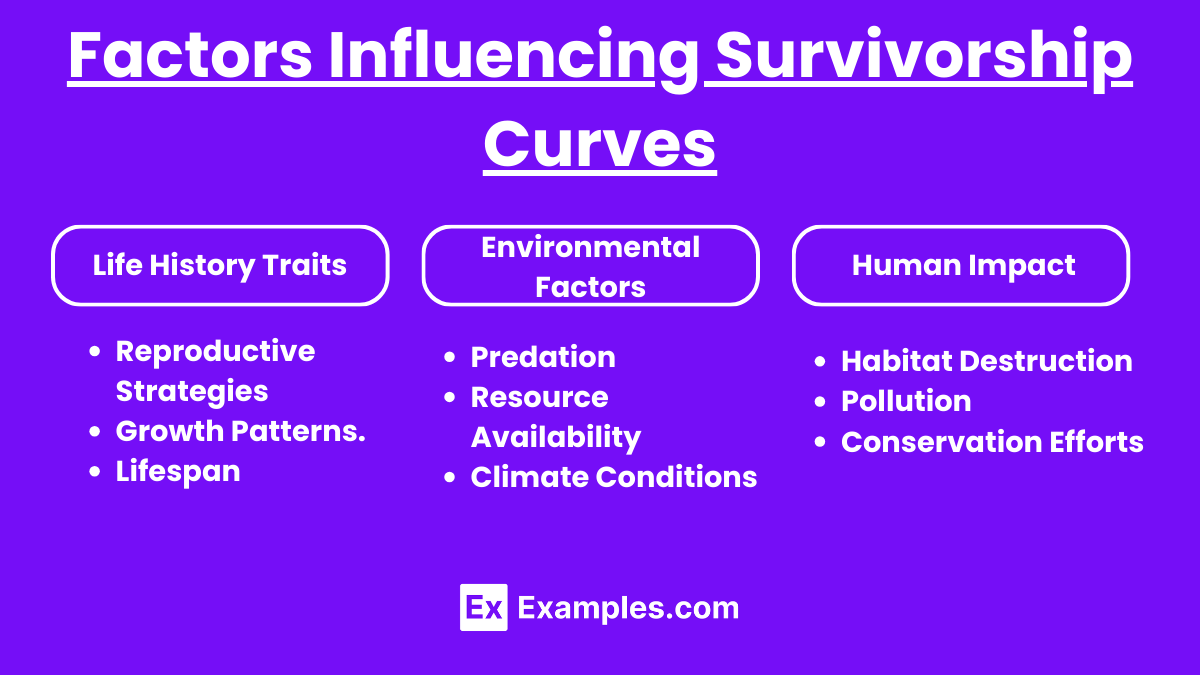
Life History Traits:
Reproductive Strategies: Number of offspring, parental care, and reproductive timing.
Growth Patterns: Rapid growth vs. slow growth.
Lifespan: Longevity and stages of life cycle.
Environmental Factors:
Predation: High predation rates can shape survivorship patterns.
Resource Availability: Abundance and distribution of food, water, and shelter.
Climate Conditions: Temperature, precipitation, and other climatic factors affecting survival rates.
Human Impact:
Habitat Destruction: Leads to changes in mortality rates and population structures.
Pollution: Can cause increased mortality in sensitive life stages.
Conservation Efforts: Protection and management strategies influencing survival rates.
Implications of Survivorship Curves
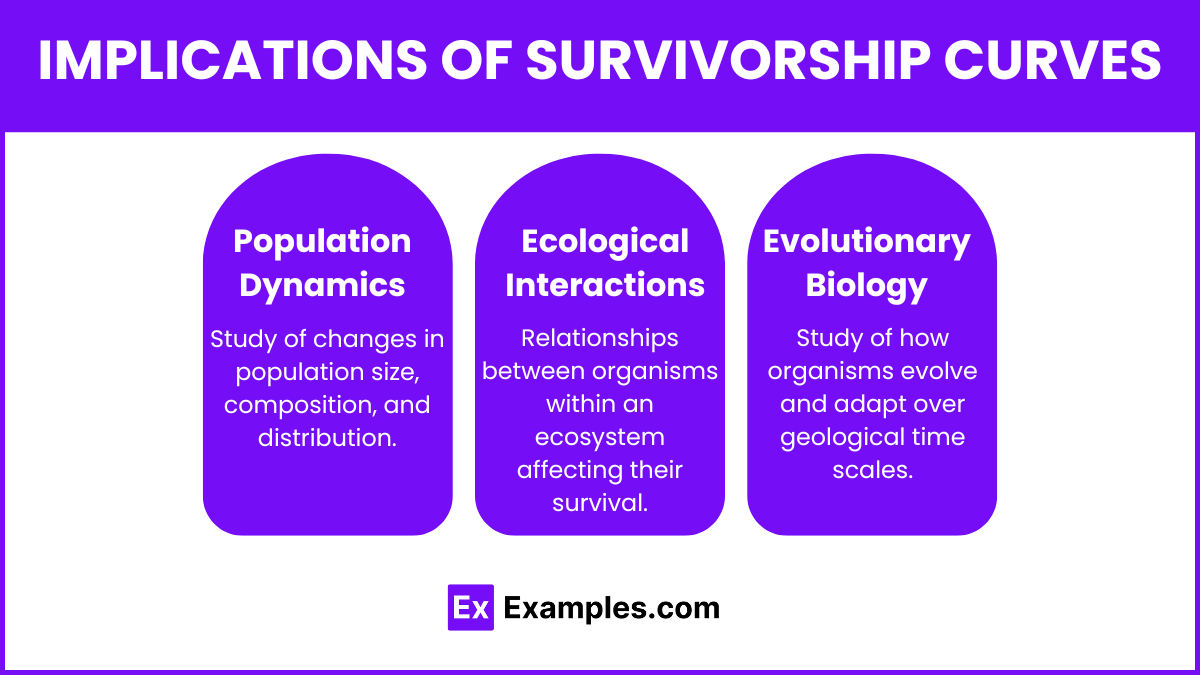
Population Dynamics:
Understanding age-specific survival rates helps in predicting population growth and decline.
Informs management practices for endangered species and conservation efforts.
Ecological Interactions:
Provides insight into predator-prey relationships and competition.
Helps in understanding the role of species within an ecosystem and their interactions with other species.
Evolutionary Biology:
Highlights evolutionary strategies and adaptations related to survival and reproduction.
Explains how different species adapt to their environments through life history traits.
Examples of Survivorship Curves in Nature
Type I Example:
Humans: High survival rates in childhood and adulthood, significant mortality increase in old age due to diseases and aging.
Type II Example:
Songbirds: Experience consistent mortality rates throughout their lives due to predation, accidents, and environmental hazards.
Type III Example:
Sea Turtles: High mortality rates for hatchlings due to predation and harsh environmental conditions, with better survival rates for those that reach maturity.