
The flow of energy in an ecosystem and the 10% rule

The flow of energy in an ecosystem and the 10% rule govern how energy moves through biological systems. Starting with primary producers like plants and algae, which convert sunlight into chemical energy through photosynthesis, energy flows through trophic levels—from herbivores consuming plants to carnivores preying on herbivores. The 10% rule dictates that only approximately 10% of energy is passed on to each successive trophic level, with the remainder lost as heat during metabolic processes. This principle underscores the importance of primary producers in capturing and converting energy efficiently, while limiting the biomass and energy available to higher trophic levels. Understanding these dynamics is crucial for analyzing ecosystem stability, food web interactions, and human impacts on natural environments.
Learning Objectives
Learn about the flow of energy in ecosystems, starting with primary production by autotrophs through photosynthesis or chemosynthesis. Understand how energy moves through trophic levels, from primary producers to herbivores, carnivores, and potentially apex predators, with each transfer involving energy loss primarily as metabolic heat. Explore the 10% rule, which states that only about 10% of energy is transferred between trophic levels due to inefficiencies in energy capture and assimilation. Analyze ecological pyramids to visualize energy flow and biomass distribution in ecosystems. Consider the implications of energy flow dynamics for ecosystem stability, biodiversity conservation, and the impacts of human activities such as resource extraction and habitat alteration.
Energy Transfer
10% Rule: In ecosystems, only about 10% of energy is transferred from one trophic level to the next. For example, if a plant captures 100 units of energy, only 10 units transfer to the herbivore, and just 1 unit to the carnivore. This loss is due to metabolic processes.
Energy Loss as Heat: Most energy consumed by organisms is used for respiration, growth, movement, and reproduction, resulting in heat loss. Thus, higher trophic levels have less energy and support fewer individuals.
Ecological Pyramid
Representation of Energy Transfer and Biomass
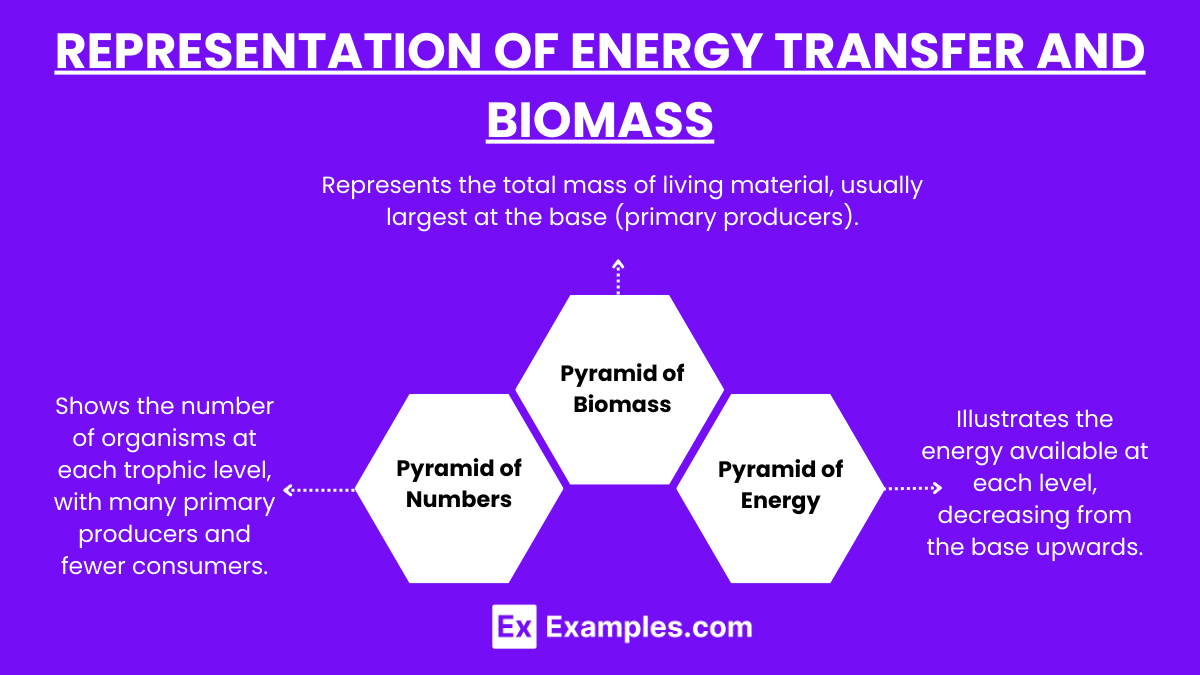
- Pyramid of Numbers: Shows the number of organisms at each trophic level, with many primary producers and fewer consumers.
- Pyramid of Biomass: Represents the total mass of living material, usually largest at the base (primary producers).
- Pyramid of Energy: Illustrates the energy available at each level, decreasing from the base upwards.
Impacts and Interactions
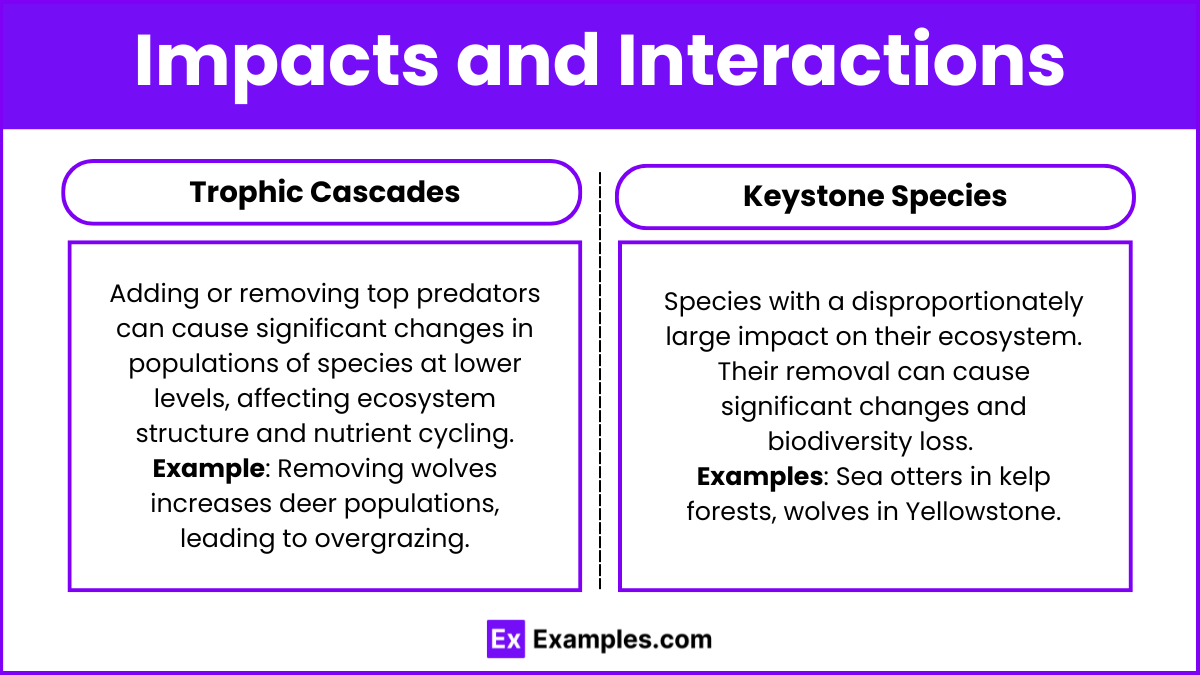
Trophic Cascades: Adding or removing top predators can cause significant changes in populations of species at lower levels, affecting ecosystem structure and nutrient cycling. Example: removing wolves increases deer populations, leading to overgrazing.
Keystone Species: Species with a disproportionately large impact on their ecosystem. Their removal can cause significant changes and biodiversity loss. Examples: sea otters in kelp forests, wolves in Yellowstone.
Human Impact
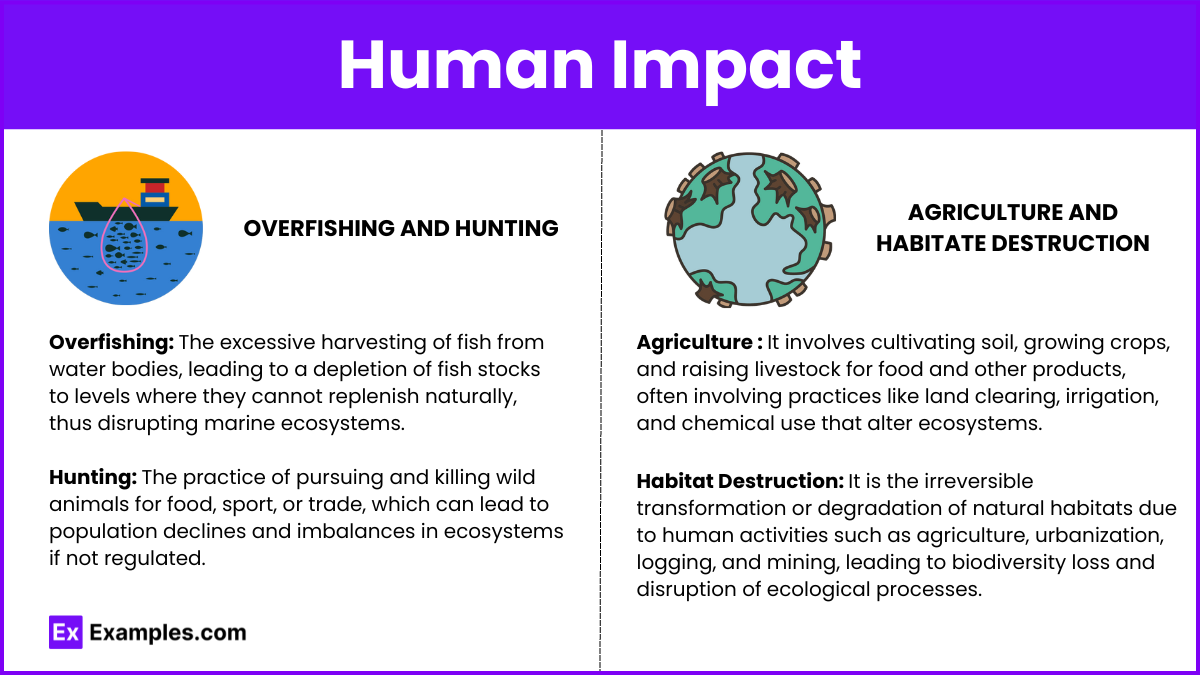
Overfishing and Hunting: These activities disrupt trophic structures by removing key species, causing a cascade of effects throughout the food web.
Agriculture and Habitat Destruction: Converting habitats into agricultural land disrupts food webs, reduces native species populations, and can introduce new species, altering dynamics.
Case Studies
Yellowstone Wolves: Reintroducing wolves controlled the elk population, allowing vegetation to recover and benefiting other species, restoring ecosystem balance.
Marine Ecosystems: Overfishing reduces predator populations, affecting prey species and leading to overgrowth of algae, disrupting the marine food web and ecosystem services.