

Aggregate Demand

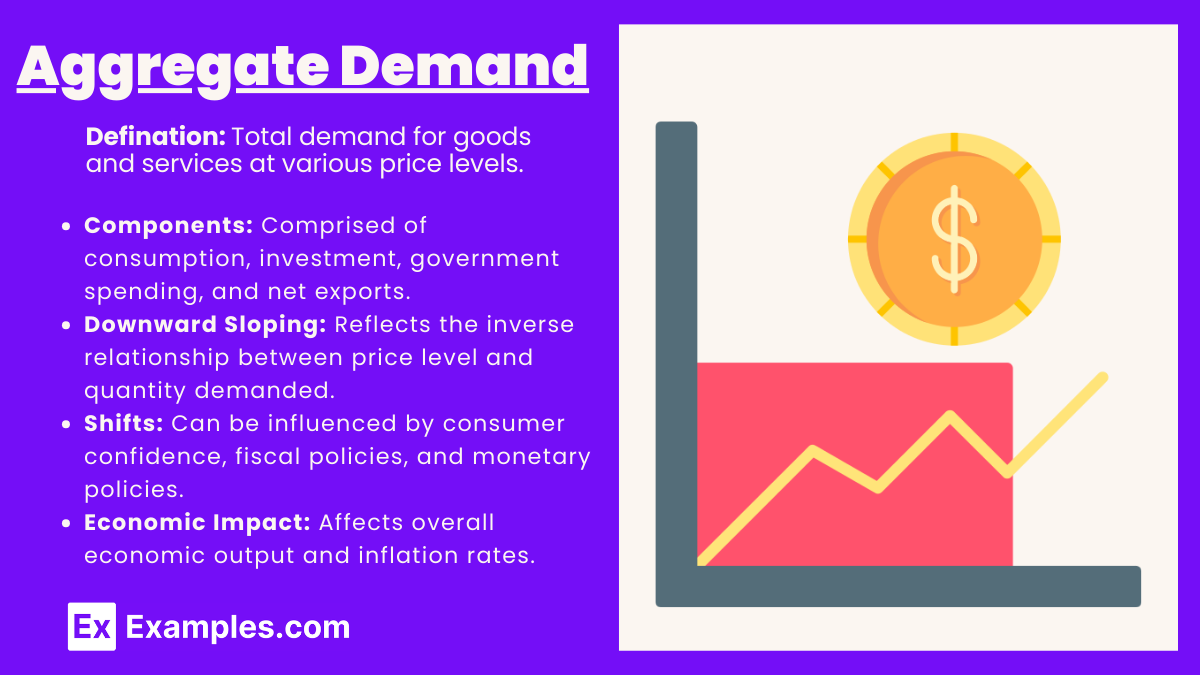
Aggregate Demand (AD) represents the total quantity of goods and services demanded across all sectors of the economy at various price levels. It is composed of consumption, investment, government spending, and net exports. Key AP Macroeconomics concepts, such as the downward-sloping AD curve, are influenced by wealth, interest rate, and foreign trade effects. Shifts in AD can significantly impact economic output and inflation.
Learning Objectives
Understand the components of Aggregate Demand and their interactions. Analyze the factors that cause shifts in the Aggregate Demand curve, including fiscal and monetary policies. Evaluate the impact of changes in Aggregate Demand on macroeconomic equilibrium, inflation, and economic output. Apply these concepts to real-world scenarios and interpret AD shifts in graphs effectively.
Aggregate Demand (AD)
Definition:
Aggregate Demand is the total quantity of goods and services demanded across all levels of the economy at a given price level in a given time period. It is represented by the equation:
[ AD = C + I + G + (X – M) ]
Where:
- C = Consumption expenditure by households
- I = Investment expenditure by businesses
- G = Government spending
- X = Exports
- M = Imports
Components of Aggregate Demand
1. Consumption (C):
- Represents the total spending by households on goods and services.
- Influenced by factors such as disposable income, consumer confidence, interest rates, and wealth.
2. Investment (I):
- Refers to spending by businesses on capital goods that will be used for future production.
- Influenced by interest rates, business expectations, and technological advancements.
3. Government Spending (G):
- Includes all government expenditures on goods and services.
- Does not include transfer payments (like social security), as these do not directly purchase goods/services.
4. Net Exports (X – M):
- The difference between what a country exports (X) and what it imports (M).
- A positive net export indicates a trade surplus, while a negative value indicates a trade deficit.
The Aggregate Demand Curve
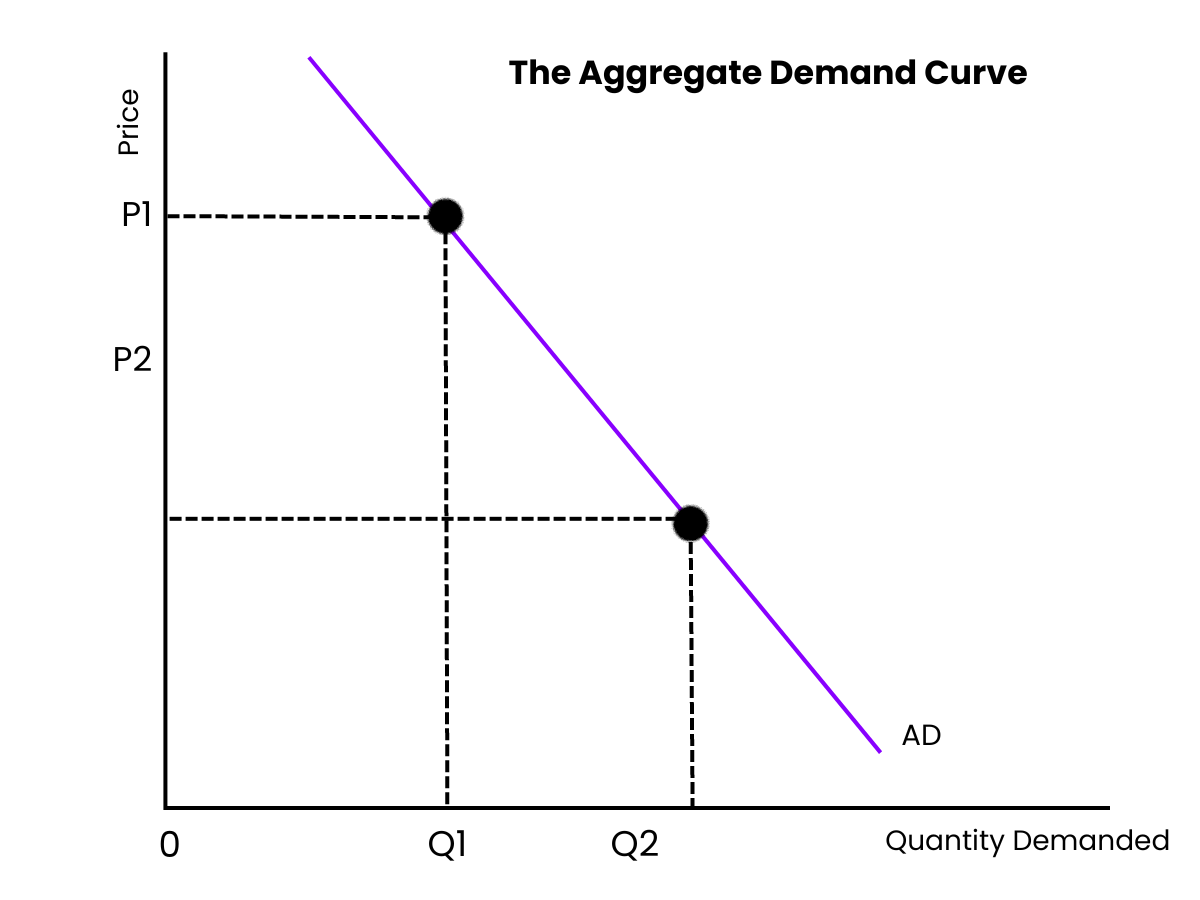
- Downward Sloping: The AD curve is typically downward sloping due to the following reasons:
- Wealth Effect: As the price level decreases, the real value of money increases, leading to higher consumption.
- Interest Rate Effect: Lower price levels reduce interest rates, stimulating investment.
- Foreign Trade Effect: Lower domestic prices make exports cheaper and imports more expensive, increasing net exports.
Shifts in Aggregate Demand
Aggregate Demand can shift due to various factors:
- Changes in Consumer Confidence: A rise in confidence can increase consumption, shifting AD to the right.
- Changes in Fiscal Policy:
- Increased Government Spending: Shifts AD right.
- Tax Cuts: Increases disposable income, shifting AD right.
- Changes in Monetary Policy:
- Lower Interest Rates: Encourage borrowing and spending, shifting AD right.
- Changes in Investment Demand: Business optimism can increase investment, shifting AD right.
- Changes in Net Exports: Economic conditions in trading partners can affect exports, shifting AD right or left.
Macroeconomic Equilibrium
- AD and AS Intersection: Equilibrium occurs where Aggregate Demand intersects Aggregate Supply (AS). Changes in AD can lead to inflationary or recessionary gaps.
- Inflationary Gap: When AD exceeds AS, leading to upward pressure on prices.
- Recessionary Gap: When AD is less than AS, leading to unemployment and unused resources.
Long-Run Macroeconomic Equilibrium
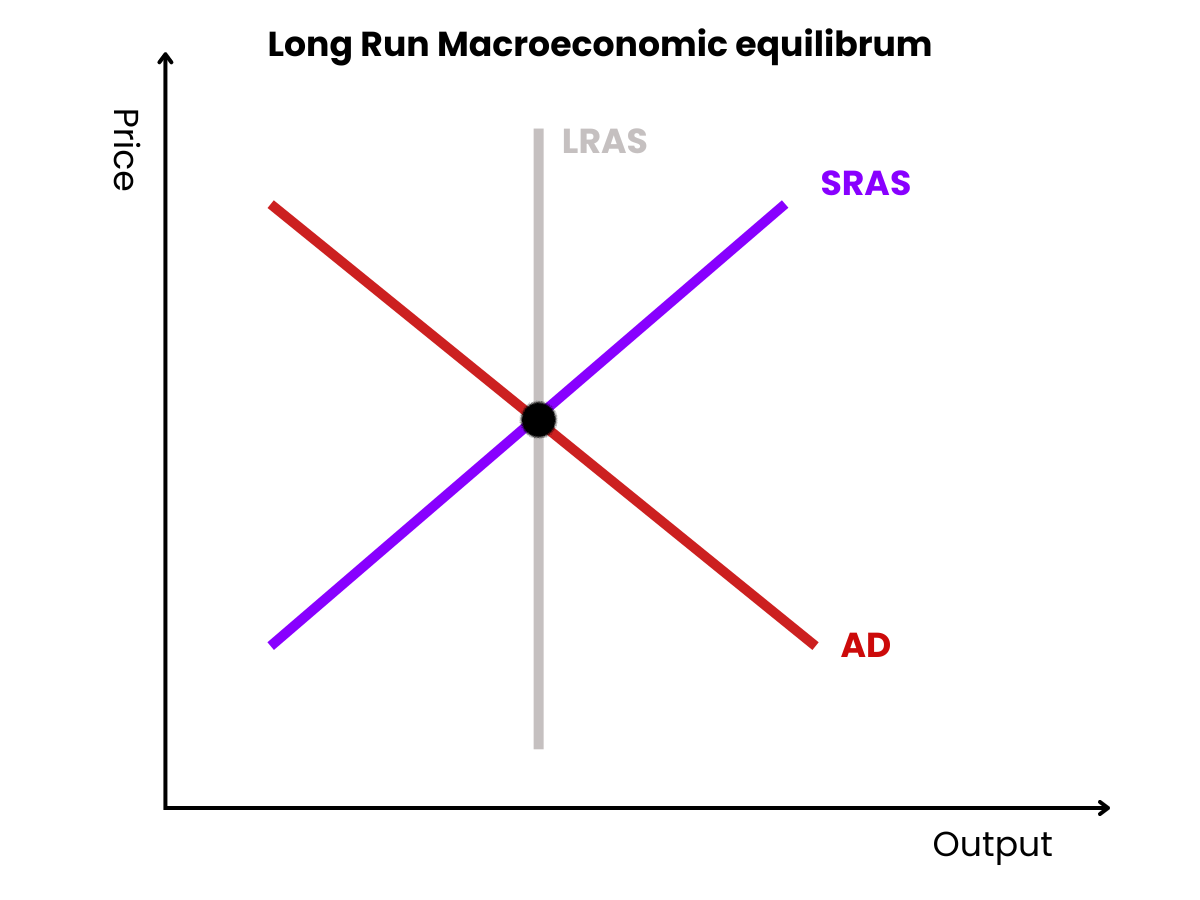
In the long run, the economy reaches a level where aggregate demand equals long-run aggregate supply, resulting in full employment and stable prices, with all resources optimally allocated.
Short-Run Macroeconomic Equilibrium
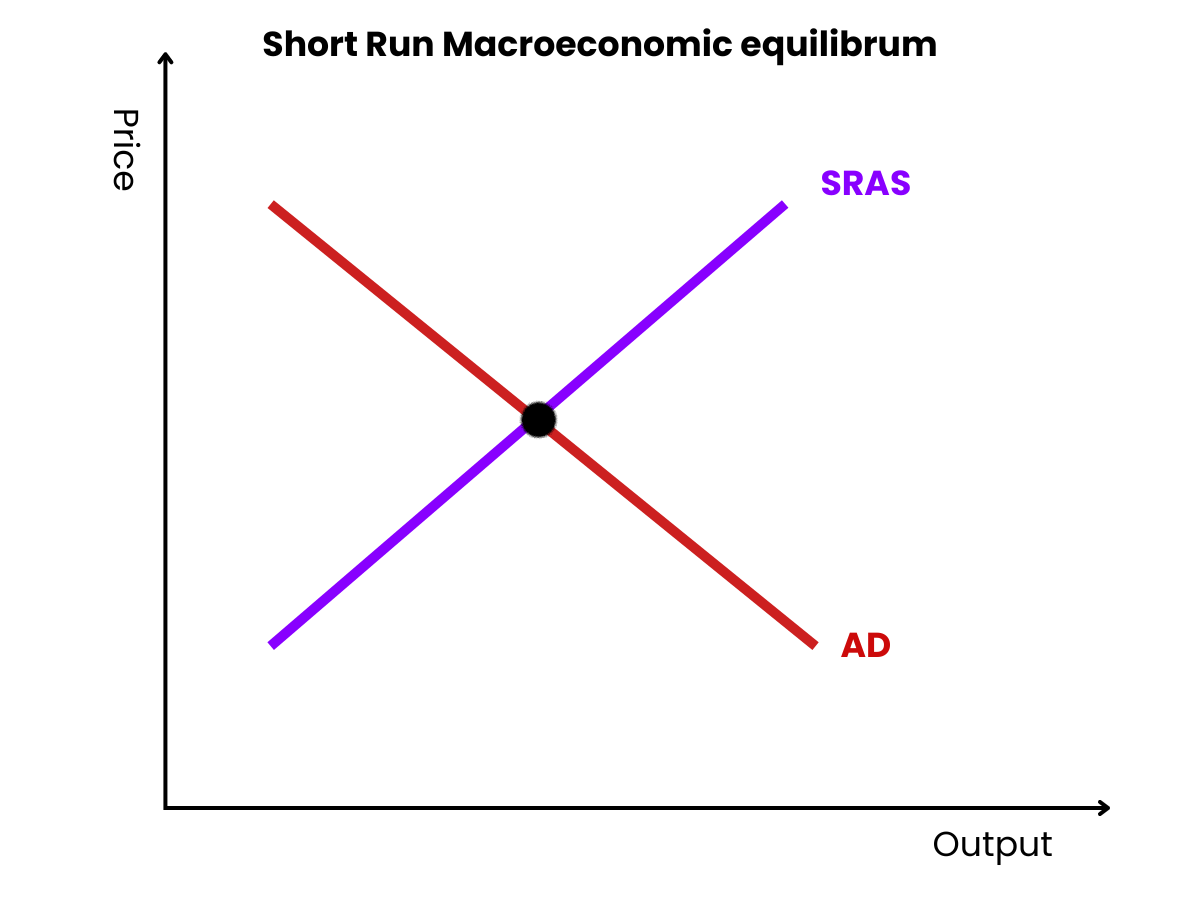
In the short run, aggregate demand may not equal short-run aggregate supply, leading to fluctuations in output and employment, as prices and wages adjust slowly to changes in economic conditions.
Important Concepts
- Demand-Pull Inflation: Caused by an increase in AD.
- Stagflation: A combination of stagnant economic growth, high unemployment, and high inflation, often influenced by shifts in AD.
Key Graphs to Understand
- AD/AS Model: Familiarize yourself with the AD curve and how it interacts with the AS curve.
- Shifts in AD Curve: Be able to illustrate and explain the impact of various shifts on equilibrium price and output.
Examples
Example 1: Increased Consumer Spending
When households receive tax refunds, they often increase their consumption on goods and services, boosting Aggregate Demand and stimulating economic growth.
Example 2: Business Investment Surge
A rise in business confidence leads companies to invest in new technology and infrastructure, increasing investment expenditure and shifting Aggregate Demand to the right.
Example 3: Government Infrastructure Projects
When the government initiates major infrastructure projects, it raises spending significantly, contributing to higher Aggregate Demand and creating jobs in various sectors.
Example 4: Export Growth
A weaker domestic currency makes exports cheaper for foreign buyers, increasing demand for domestically produced goods and services, which raises Aggregate Demand through higher net exports.
Example 5: Consumer Confidence Increase
If consumer confidence rises due to positive economic news, households are likely to spend more, increasing consumption and driving Aggregate Demand higher across the economy.
MCQs
Question 1
What happens to the equilibrium price of a good if demand increases while supply remains constant?
A) Decreases
B) Increases
C) Remains the same
D) Becomes unpredictable
Answer: B) Increases
Explanation: An increase in demand, with supply constant, creates upward pressure on the equilibrium price, as more consumers are willing to buy the good at higher prices.
Question 2
Which of the following would cause a leftward shift in the supply curve?
A) A decrease in production costs
B) An increase in taxes on production
C) An improvement in technology
D) A decrease in the number of suppliers
Answer: B) An increase in taxes on production
Explanation: An increase in production taxes raises costs for suppliers, causing them to produce less at every price level, which shifts the supply curve to the left.
Question 3
If the price of a substitute good increases, what is likely to happen to the demand for the original good?
A) Decrease
B) Increase
C) Remain unchanged
D) Become inelastic
Answer: B) Increase
Explanation: When the price of a substitute good rises, consumers are likely to switch to the original good, increasing its demand as they seek more affordable options.