Equilibrium and changes in the Aggregate Demand-Aggregate Supply Model

In AP Macroeconomics, understanding equilibrium in the Aggregate Demand-Aggregate Supply (AD-AS) model is crucial for analyzing economic performance. This model illustrates how the interaction between aggregate demand and aggregate supply determines the overall price level and output in an economy. Changes in these curves provide insights into economic fluctuations, policy impacts, and long-term growth trends.
Learning Objectives
Understand the concepts of equilibrium in the AD-AS model, identify factors that shift the AD and AS curves, analyze the effects of these shifts on price levels and output, and apply this knowledge to real-world economic scenarios. Prepare to explain long-run versus short-run dynamics in the economy.
Here are detailed notes on Equilibrium and Changes in the Aggregate Demand-Aggregate Supply (AD-AS) Model:
1. Equilibrium in the AD-AS Model
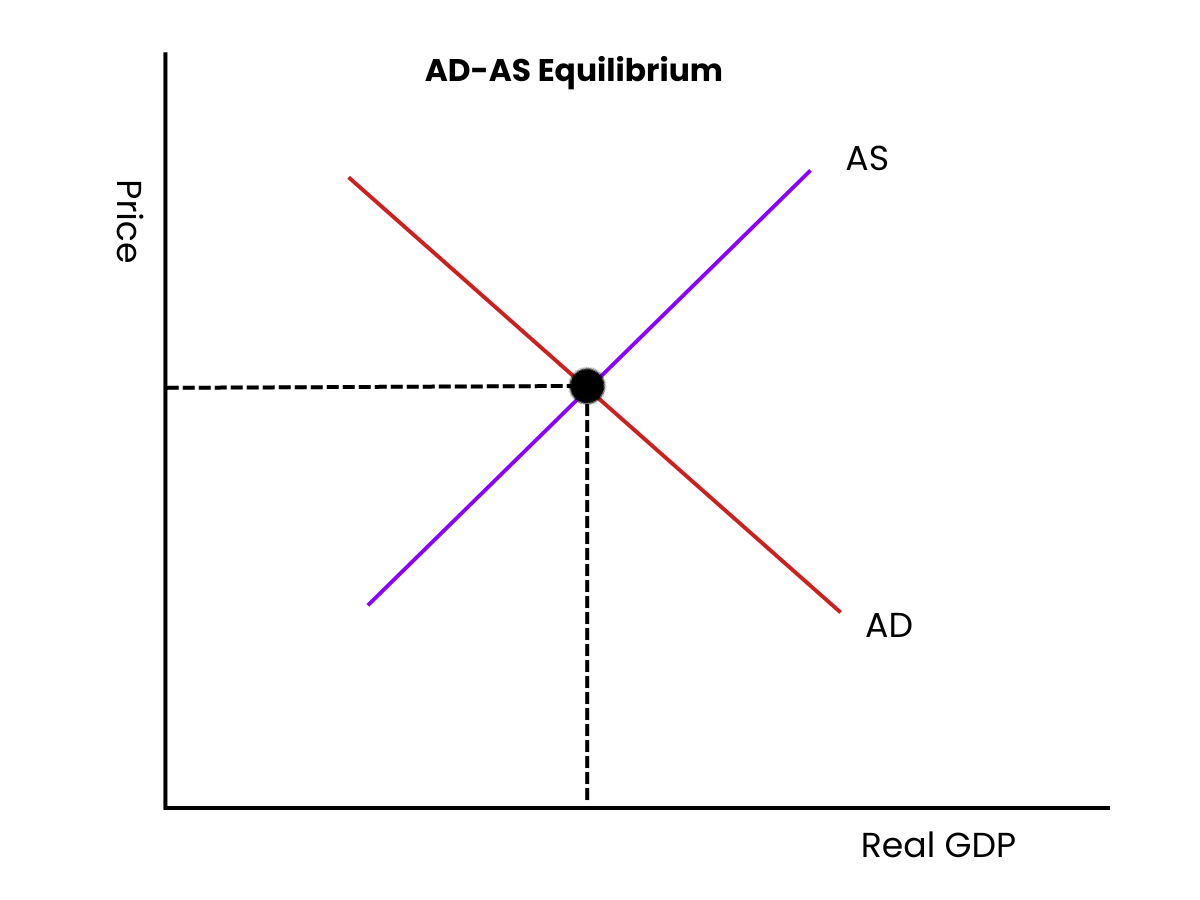
- Definition: Equilibrium occurs when the quantity of output demanded equals the quantity of output supplied at a specific price level.
- Graphical Representation: The equilibrium point is where the Aggregate Demand (AD) curve intersects the Aggregate Supply (AS) curve on a graph where the x-axis represents real GDP and the y-axis represents the price level.
2. Components of Aggregate Demand
Aggregate Demand is composed of:
- Consumption (C): Spending by households on goods and services.
- Investment (I): Spending by businesses on capital goods.
- Government Spending (G): Expenditures by the government on goods and services.
- Net Exports (NX): Exports minus imports.
Formula:
[ AD = C + I + G + (X – M) ]
3. Aggregate Supply (AS)
- Short-Run Aggregate Supply (SRAS): The upward-sloping curve representing the total production of goods and services in the short run, influenced by changes in production costs and supply conditions.
- Long-Run Aggregate Supply (LRAS): A vertical line indicating the maximum sustainable output of an economy at full employment, unaffected by the price level.
4. Shifts in Aggregate Demand
- Increase in AD: Caused by factors like:
- Increased consumer confidence leading to higher consumption.
- Lower interest rates boosting investment.
- Increased government spending.
- Stronger foreign demand increasing net exports.
- Decrease in AD: Caused by:
- Decreased consumer confidence leading to lower consumption.
- Higher interest rates curtailing investment.
- Reduction in government spending.
- Weaker foreign demand reducing net exports.
5. Shifts in Aggregate Supply
- Increase in SRAS: Caused by:
- Lower input costs (e.g., wages, raw materials).
- Technological advancements enhancing productivity.
- Improved labor market conditions.
- Decrease in SRAS: Caused by:
- Higher input costs.
- Supply shocks (e.g., natural disasters).
- Increased taxes or regulations.
Examples
Example 1: Increased Consumer Confidence
An increase in consumer confidence leads to higher spending, shifting the Aggregate Demand curve to the right, resulting in higher output and price levels.
Example 2: Government Stimulus Spending
A government stimulus package boosts public spending, shifting the AD curve rightward, which raises demand for goods and services, increasing equilibrium output and prices.
Example 3: Rising Production Costs
If production costs increase due to higher wages, the Short-Run Aggregate Supply (SRAS) curve shifts left, leading to higher prices and lower output in the short run.
Example 4: Technological Advances
Improvements in technology decrease production costs, causing the SRAS curve to shift right. This leads to lower prices and increased output, enhancing economic growth.
Example 5: Global Economic Downturn
A global recession reduces demand for exports, shifting the AD curve left. This results in lower equilibrium output and prices, reflecting decreased economic activity.
MCQs
Question 1
What happens to the equilibrium price and output when the Aggregate Demand curve shifts to the right?
A) Price decreases, output decreases
B) Price increases, output increases
C) Price decreases, output increases
D) Price remains constant, output increases
Answer: B) Price increases, output increases
Explanation: A rightward shift in the Aggregate Demand curve indicates increased demand, leading to higher equilibrium prices and greater output in the short run.
Question 2
Which of the following would likely cause a leftward shift in the Short-Run Aggregate Supply curve?
A) Decrease in input prices
B) Improved technology
C) Increase in taxes on producers
D) Increased labor productivity
Answer: C) Increase in taxes on producers
Explanation: An increase in taxes on producers raises production costs, causing the Short-Run Aggregate Supply curve to shift left, resulting in higher prices and lower output.
Question 3
In the long run, what does the Long-Run Aggregate Supply curve represent?
A) A constant output regardless of price level
B) The maximum output achievable at full employment
C) The relationship between price levels and real GDP
D) The short-term effects of fiscal policy
Answer: B) The maximum output achievable at full employment
Explanation: The Long-Run Aggregate Supply curve represents the economy’s maximum sustainable output at full employment, which is unaffected by changes in the price level.