
Price Indices and Inflation

Price indices and inflation are crucial concepts in AP Macroeconomics, helping to measure changes in the overall price level and the purchasing power of money. Inflation occurs when prices rise over time, reducing the value of currency. Key price indices like the Consumer Price Index (CPI) and GDP Deflator track these changes and help assess economic stability.
Learning Objectives
Focus on understanding how inflation is measured using the Consumer Price Index (CPI), Producer Price Index (PPI), and GDP Deflator. Learn the causes and effects of inflation, different types of inflation, and how these concepts impact purchasing power and economic policy.
Inflation
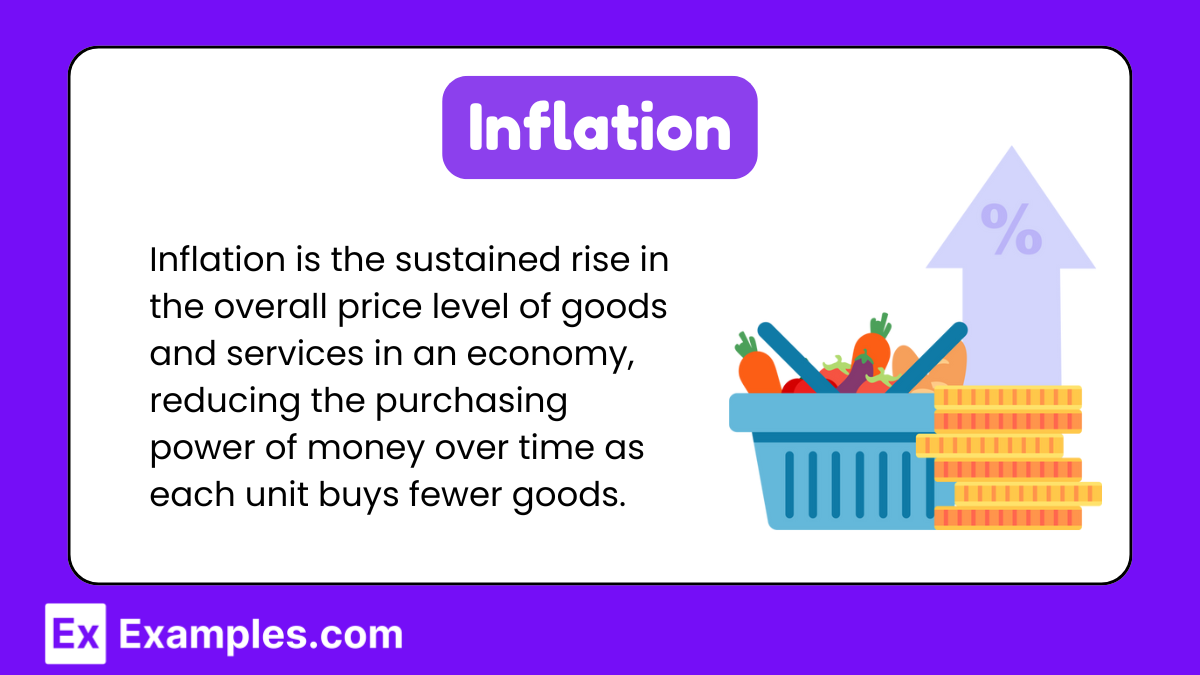
Inflation is the sustained increase in the overall price level of goods and services in an economy over a period of time. It reduces the purchasing power of money, meaning that as inflation rises, each unit of currency buys fewer goods and services.
Inflation Rate Formula:

Price Indices
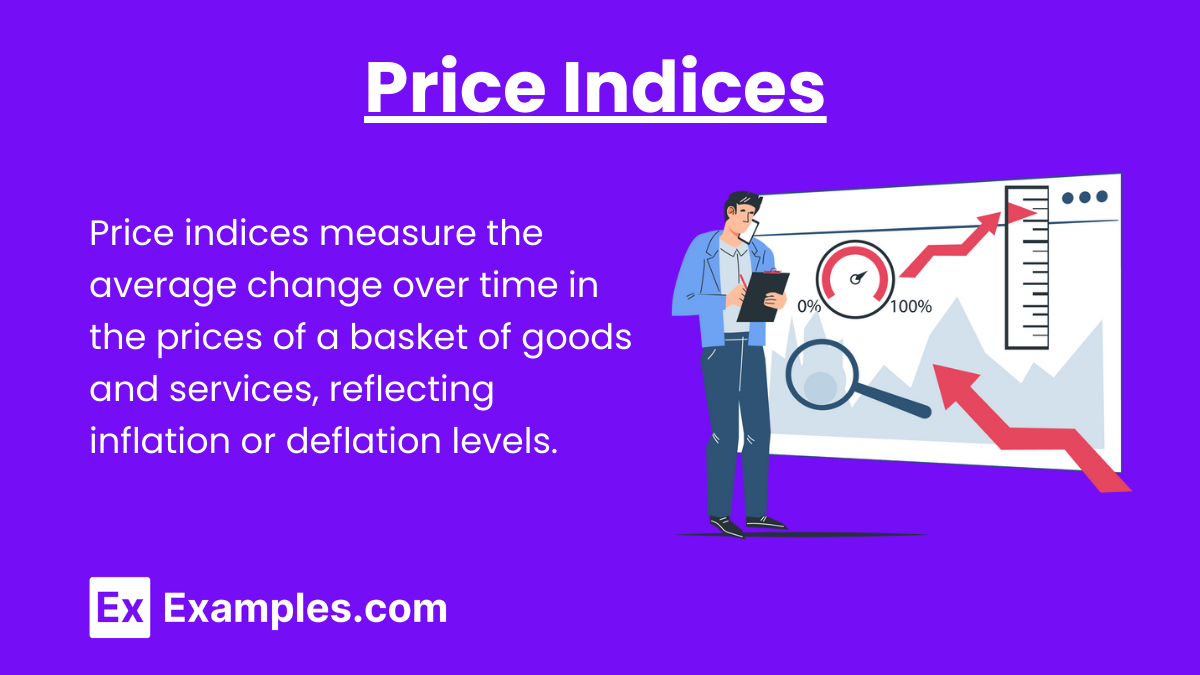
Price indices measure the average price level of a basket of goods and services in the economy, which helps economists calculate inflation. Price indices track how prices change over time.
Common Price Indices:
1. Consumer Price Index (CPI):
- Definition: Measures the average price level of a fixed basket of consumer goods and services purchased by typical households.
- Formula:

- Usage: CPI is used to calculate inflation and cost-of-living adjustments.
2. Producer Price Index (PPI):
- Definition: Measures the average price level of goods and services sold by producers, reflecting changes in wholesale prices.
- Usage: PPI is an indicator of future consumer price inflation.
3. GDP Deflator:
- Definition: A broad measure of price inflation across all goods and services produced within an economy.
- Formula:

- Usage: Reflects the overall price level and inflation in the economy, not just consumer goods.
Types of Inflation
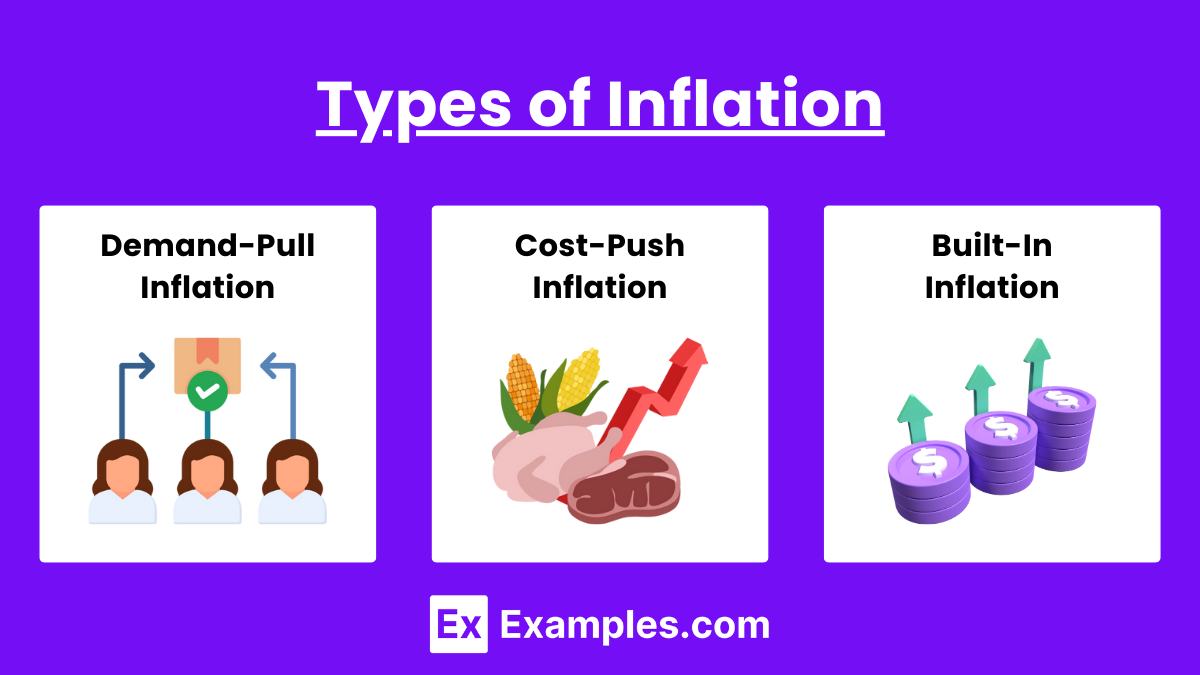
1. Demand-Pull Inflation:
- Definition: Occurs when aggregate demand exceeds aggregate supply, leading to higher prices.
- Cause: Rising consumer spending, government expenditure, or investment.
- Example: Increased demand for housing leading to higher prices.
2. Cost-Push Inflation:
- Definition: Results from rising production costs, which businesses pass on to consumers in the form of higher prices.
- Cause: Higher wages, raw material costs, or taxes.
- Example: An increase in oil prices driving up the cost of transportation and goods.
3. Built-In Inflation:
- Definition: A self-perpetuating cycle where workers demand higher wages to keep up with rising costs of living, leading to further inflation.
- Cause: Wage-price spirals.
- Example: Employees demanding raises as prices rise, pushing companies to increase prices further.
Examples
Example 1: Rising Grocery Prices
Over a year, the price of groceries increases by 5%, reflecting inflation measured by the Consumer Price Index (CPI), indicating reduced purchasing power.
Example 2: Producer Costs Increasing
As oil prices rise, businesses face higher production costs, driving up wholesale prices measured by the Producer Price Index (PPI), signaling potential future consumer inflation.
Example 3: Housing Market Boom
Increased demand for homes leads to rising housing prices, contributing to demand-pull inflation, where higher demand exceeds available supply, pushing overall prices up.
Example 4: Inflation-Adjusted Salaries
Workers receive a 3% raise to keep up with a 3% rise in the CPI, maintaining their purchasing power despite inflation.
Example 5: Technology Prices Deflating
While most prices increase, the cost of smartphones decreases, illustrating how the GDP Deflator captures overall price changes, even if certain sectors experience deflation.
MCQs
Question1
Which best describes the Consumer Price Index (CPI)?
A) Measures producer input prices.
B) Measures consumer product prices received.
C) Measures urban consumer prices for goods/services.
D) Measures economy’s output adjusted for inflation.
Answer: C) Measures urban consumer prices for goods/services.
Explanation: CPI tracks price changes of a typical basket of goods/services for urban consumers.
Question2
If CPI was 200 in Year 1 and 220 in Year 2, what was the inflation rate?
A) 10%
B) 20%
C) 5%
D) 25%
Answer: A) 10%
Explanation: Inflation rate = ((220 – 200) / 200) × 100% = 10%.
Question3
Which statement about inflation is true?
A) Inflation benefits lenders over borrowers.
B) Unexpected inflation hurts savers and fixed incomes.
C) Inflation increases real money value.
D) Inflation is caused only by supply increases.
Answer: B) Unexpected inflation hurts savers and fixed incomes.
Explanation: Unexpected inflation reduces purchasing power, harming savers and those on fixed incomes.