
The Phillips Curve

The Phillips Curve illustrates the relationship between inflation and unemployment, showing how these two economic indicators interact. In the context of AP Macroeconomics, this curve is essential for understanding the trade-offs policymakers face when addressing economic conditions. The short-run Phillips Curve suggests that lower unemployment can lead to higher inflation, while the long-run Phillips Curve indicates that this relationship does not hold as expectations adjust. This concept is crucial for analyzing monetary and fiscal policy implications in achieving stable economic growth.
Free AP Macroeconomics Practice Test
Learning Objectives
In studying the Phillips Curve for AP Macroeconomics, you should aim to understand the inverse relationship between inflation and unemployment in both the short run and long run. Learn to differentiate between the Short-Run Phillips Curve (SRPC) and the Long-Run Phillips Curve (LRPC), focusing on their implications for economic policy. Analyze how shifts in the Phillips Curve occur due to supply shocks and changes in inflation expectations. Ultimately, evaluate the trade-offs policymakers face in managing inflation and unemployment while utilizing the Phillips Curve in real-world scenarios.
Introduction of The Phillips Curve
The Phillips Curve represents the inverse relationship between the rate of inflation and the rate of unemployment in an economy. Named after economist A.W. Phillips, who first illustrated this concept in 1958, the curve suggests that with economic growth comes inflation, which in turn reduces unemployment. Understanding this relationship is crucial for analyzing macroeconomic policy, particularly in the context of the trade-offs between inflation and unemployment.
Key Concepts
Short-Run Phillips Curve (SRPC)
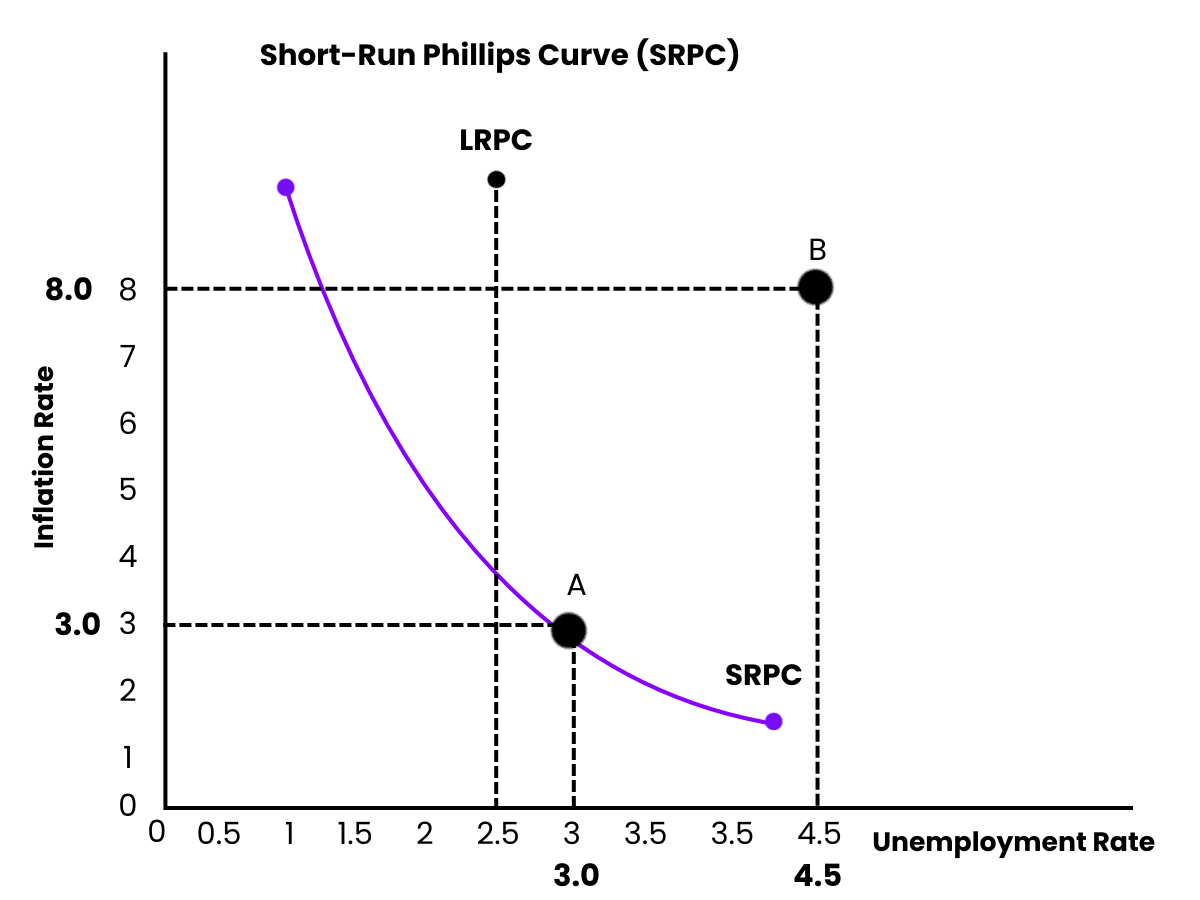
The SRPC indicates a trade-off between inflation and unemployment. When unemployment decreases, inflation tends to increase, and vice versa. This relationship is depicted as a downward-sloping curve.
Mechanism: As firms hire more workers to meet growing demand, wages tend to rise. Increased wages lead to higher costs for businesses, which may pass on these costs to consumers in the form of higher prices, leading to inflation.
Long-Run Phillips Curve (LRPC)
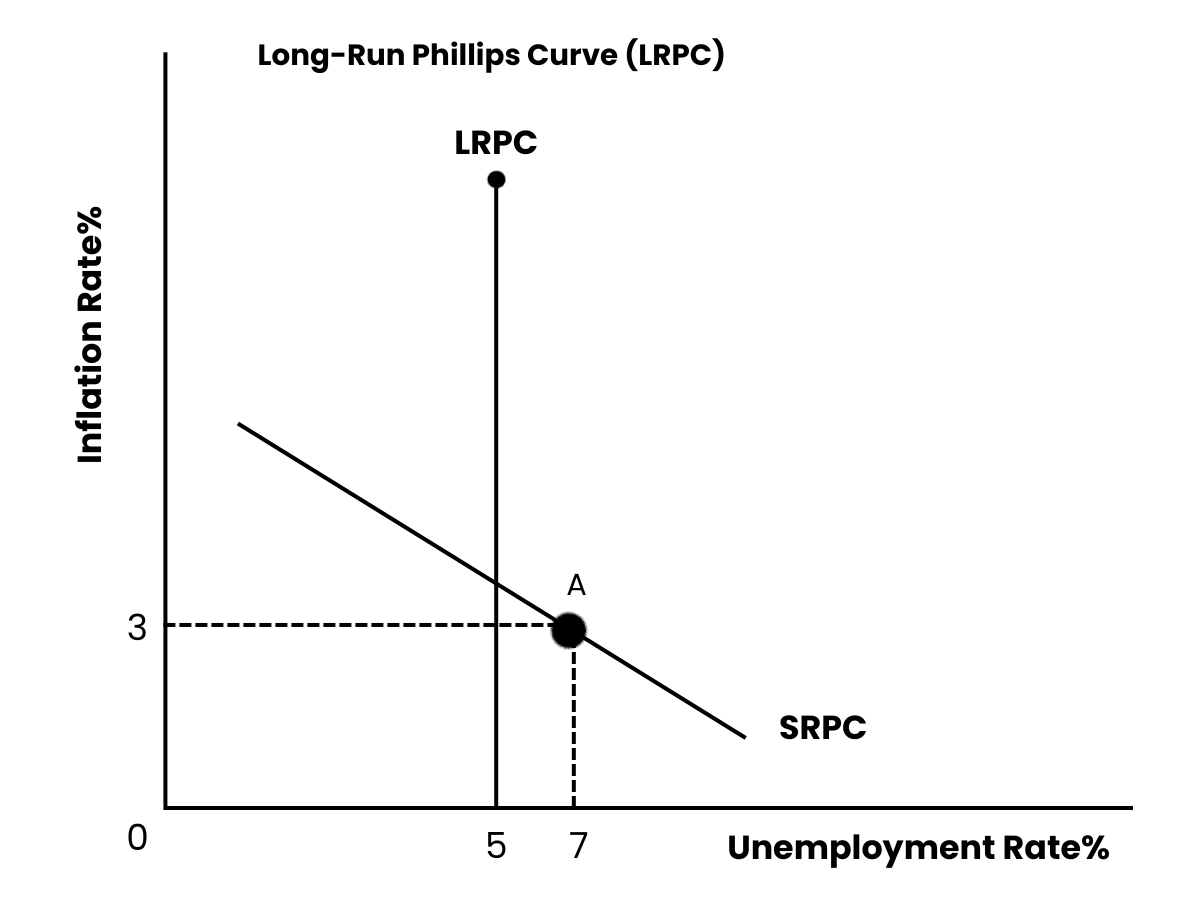
The LRPC is vertical at the natural rate of unemployment (also known as the Non-Accelerating Inflation Rate of Unemployment, or NAIRU). This implies that in the long run, there is no trade-off between inflation and unemployment.
Implication: Attempts to lower unemployment below the natural rate can lead to accelerating inflation without reducing the unemployment rate sustainably.
Expectations-Augmented Phillips Curve
In the late 1960s and 1970s, economists like Milton Friedman and Edmund Phelps introduced the concept of adaptive expectations, arguing that people's expectations of inflation adjust over time.
This adjustment leads to the idea that if inflation is consistently higher than expected, it may temporarily lower unemployment. However, once expectations adjust, the economy returns to the natural rate of unemployment.
Shifts in the Phillips Curve
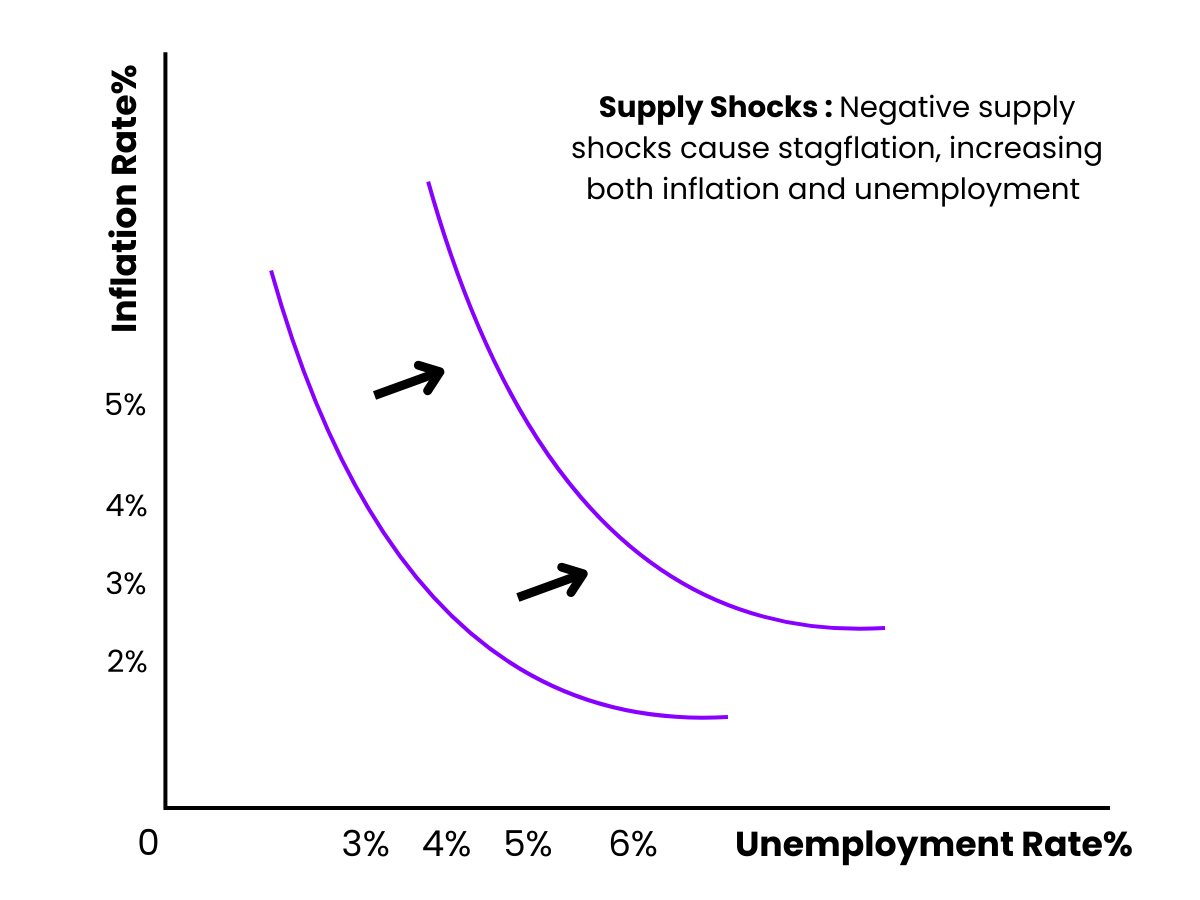
Various factors can shift the Phillips Curve:
Supply Shocks: Negative supply shocks (e.g., oil price increases) can shift the SRPC upward, causing both higher inflation and higher unemployment, a situation referred to as stagflation.
Policy Changes: Changes in fiscal or monetary policy can affect inflation expectations and, consequently, shift the Phillips Curve.
Policy Implications
Policymakers face challenges in balancing inflation and unemployment. Expansionary policies may reduce unemployment but could lead to higher inflation, while contractionary policies can lower inflation but increase unemployment.
Central banks often use the Phillips Curve to inform their monetary policy decisions, targeting a low and stable inflation rate while aiming to minimize unemployment.
Examples
Example 1: U.S. Economy in the 1960s
During the 1960s, the United States experienced a period of low unemployment alongside rising inflation. This situation illustrated the short-run Phillips Curve, where the trade-off between inflation and unemployment was evident. As policymakers sought to reduce unemployment through expansionary fiscal and monetary policies, inflation began to rise, confirming the inverse relationship.
Example 2: Stagflation of the 1970s
The 1970s brought about a significant challenge to the Phillips Curve theory when the U.S. experienced stagflation—high inflation and high unemployment simultaneously. This phenomenon was primarily driven by oil price shocks and supply constraints. The upward shift in the short-run Phillips Curve demonstrated that the traditional trade-off no longer held, as both inflation and unemployment increased, challenging the notion of a stable Phillips Curve.
Example 3: Volcker's Anti-Inflation Policies (1980s)
In response to the high inflation rates of the late 1970s and early 1980s, Federal Reserve Chairman Paul Volcker implemented contractionary monetary policies. These measures led to a significant increase in interest rates, which successfully reduced inflation but resulted in rising unemployment. This example reflects the long-run Phillips Curve, where the temporary reduction in inflation came at the cost of higher unemployment, illustrating the trade-offs policymakers face.
Example 4: Post-Recession Recovery (2010s)
Following the 2008 financial crisis, the U.S. economy witnessed a slow recovery characterized by high unemployment rates and low inflation. As unemployment gradually decreased, inflation remained subdued. This scenario demonstrated a shift in the Phillips Curve, where the expected trade-off was less pronounced, suggesting that other factors—such as global competition and technological advancements—were influencing the relationship between inflation and unemployment.
Example 5: COVID-19 Pandemic Response (2020s)
In the wake of the COVID-19 pandemic, the U.S. experienced unprecedented fiscal stimulus and monetary easing to support the economy. As the economy reopened, demand surged, leading to rising inflation amid declining unemployment. This situation illustrated a movement along the short-run Phillips Curve, where policymakers faced the dilemma of balancing inflationary pressures with the need for economic recovery, highlighting the complexities of the Phillips Curve in real-time policy decisions.
Multiple Choice Questions
Question 1
What does the Short-Run Phillips Curve illustrate?
A) A direct relationship between inflation and unemployment
B) An inverse relationship between inflation and unemployment
C) No relationship between inflation and unemployment
D) A constant rate of inflation regardless of unemployment
Answer: B) An inverse relationship between inflation and unemployment
Explanation: The Short-Run Phillips Curve (SRPC) depicts an inverse relationship between inflation and unemployment. As unemployment decreases, inflation tends to increase, and vice versa. This relationship arises because lower unemployment can lead to higher demand for goods and services, prompting firms to raise prices as they hire more workers and pay higher wages. This dynamic shows the trade-off policymakers face between controlling inflation and maintaining low unemployment.
Question 2
In the context of the Phillips Curve, what happens when inflation expectations increase?
A) The Long-Run Phillips Curve shifts to the left
B) The Short-Run Phillips Curve shifts upward
C) The unemployment rate decreases permanently
D) There is no impact on the Phillips Curve
Answer: B) The Short-Run Phillips Curve shifts upward
Explanation: When inflation expectations increase, the SRPC shifts upward. This means that for any given level of unemployment, a higher rate of inflation is now expected. As workers and firms anticipate higher future inflation, they adjust wages and prices accordingly. This shift reflects the idea that if inflation is consistently higher than expected, it will not sustainably lower unemployment; rather, it will lead to a situation where both inflation and unemployment can increase simultaneously, known as stagflation.
Question 3
What is the primary implication of the Long-Run Phillips Curve (LRPC)?
A) There is a permanent trade-off between inflation and unemployment.
B) Inflation and unemployment are unrelated in the long run.
C) Policies aimed at reducing unemployment can lead to increasing inflation.
D) The LRPC can shift to the left with effective government policies.
Answer: B) Inflation and unemployment are unrelated in the long run.
Explanation: The Long-Run Phillips Curve is vertical at the natural rate of unemployment, indicating that in the long run, there is no trade-off between inflation and unemployment. Attempts to reduce unemployment below this natural rate may lead to rising inflation without a sustainable decrease in unemployment. This concept emphasizes that in the long run, inflation expectations adjust, and the economy returns to its natural rate, regardless of the inflation rate. Thus, policymakers should be cautious in their approach to managing inflation and unemployment over time.