Demand is a fundamental concept in AP Microeconomics, representing the quantity of a good or service that consumers are willing and able to purchase at various prices over a specific period. It reflects consumer preferences, income levels, and the prices of related goods, shaping how markets operate. Understanding demand involves analyzing the law of demand, demand curves, and factors that shift demand. Mastery of demand concepts is essential for comprehending market dynamics, consumer behavior, and the determination of equilibrium prices.
Learning Objectives
By mastering the topic of Demand, you will be able to define and distinguish between demand and quantity demanded, explain the law of demand and its exceptions, and identify the key determinants that shift demand curves. You will learn to graph and interpret demand curves, differentiate between movements along the curve and shifts, and calculate various measures of elasticity, including price, income, and cross elasticity. Additionally, you will understand consumer surplus, aggregate individual demands into market demand, and apply these concepts to real-world economic scenarios, enhancing your analytical skills for the AP Microeconomics exam.
1. Definition of Demand

Demand refers to the quantity of a good or service that consumers are willing and able to purchase at various prices during a specific period. It embodies the relationship between price and quantity demanded, holding other factors constant (ceteris paribus).
Key Points:
- Willingness and Ability: Consumers must both want the good and have the means to purchase it.
- Different from Quantity Demanded: Quantity demanded is a specific point on the demand curve at a given price, whereas demand refers to the entire relationship.
2. The Law of Demand
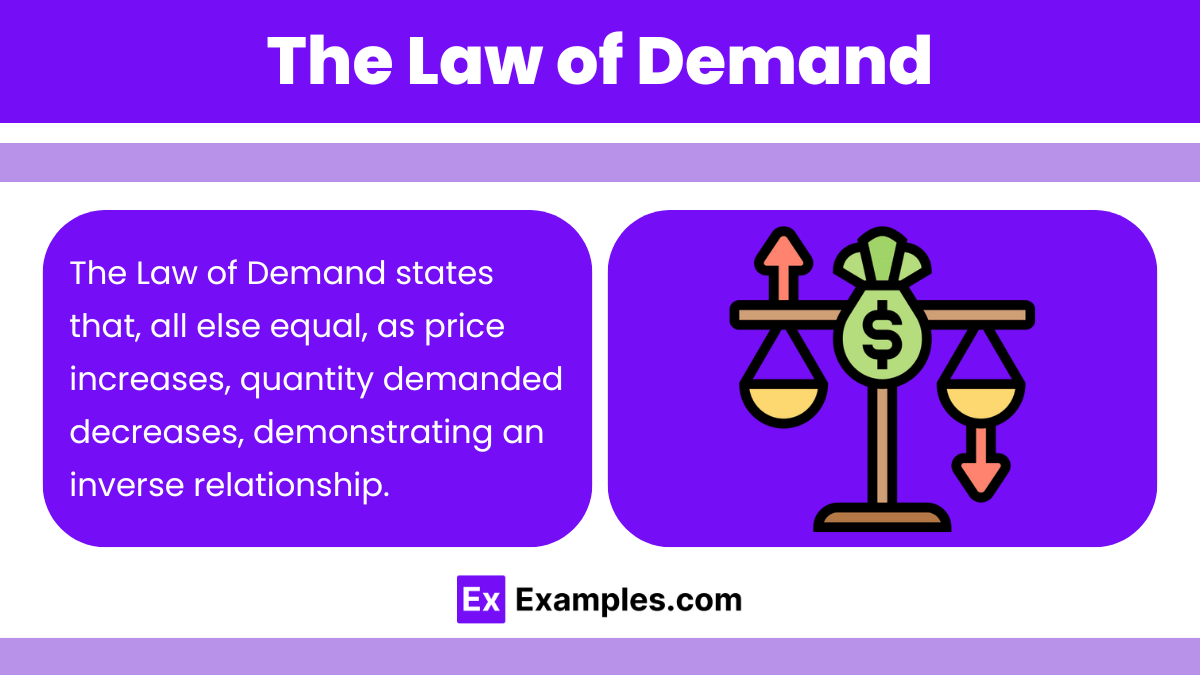
The Law of Demand states that, ceteris paribus, as the price of a good or service increases, the quantity demanded decreases, and vice versa. This inverse relationship between price and quantity demanded is foundational in economics.
Graphical Representation:
- Downward-Sloping Demand Curve: Illustrates the inverse relationship; as price falls, quantity demanded rises.
Exceptions to the Law of Demand:
- Giffen Goods: Inferior goods where higher prices lead to higher quantity demanded because the income effect outweighs the substitution effect.
- Veblen Goods: Luxury goods where higher prices may increase their desirability as status symbols.
- Necessities: Essential goods may have inelastic demand even if prices rise.
3. The Demand Curve
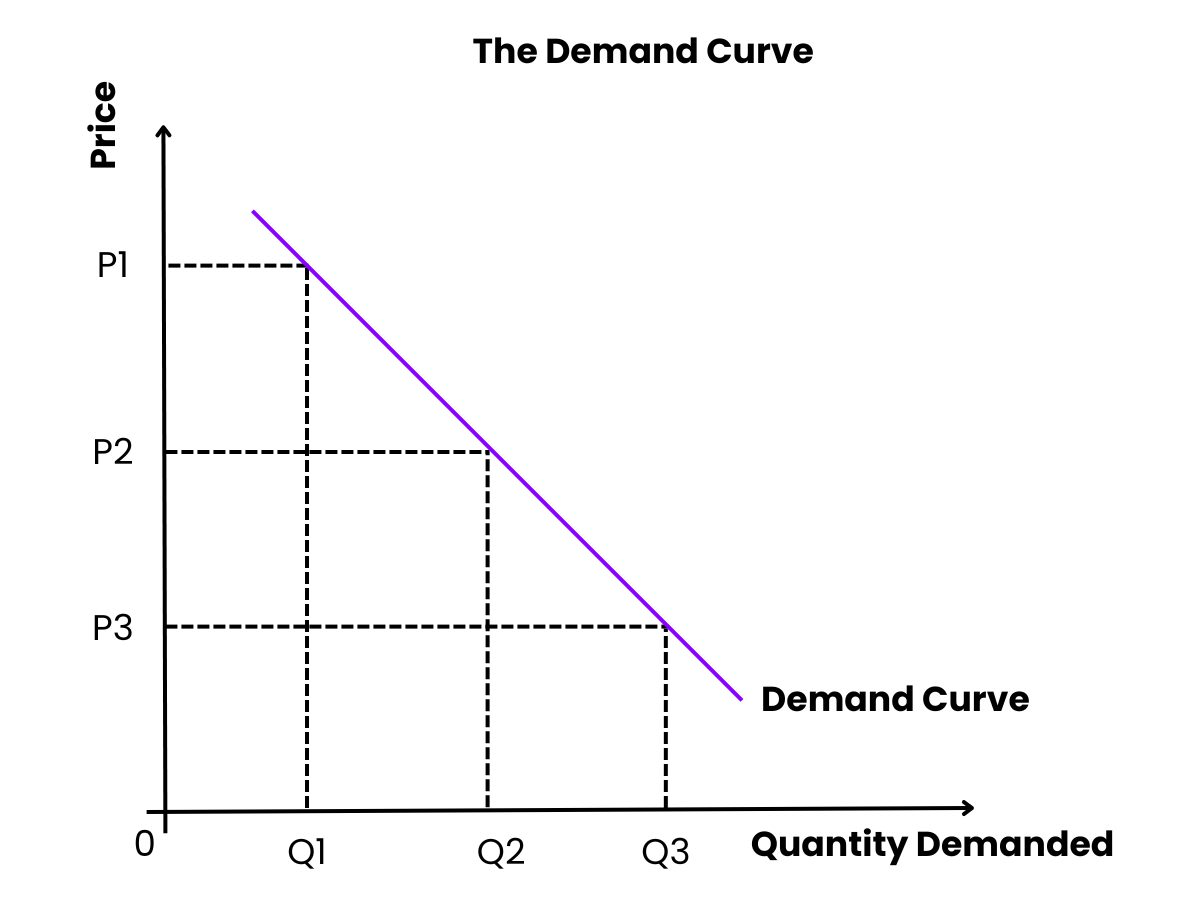
A demand curve graphically represents the relationship between the price of a good and the quantity demanded.Characteristics:
- Axes:
- Vertical Axis (Y-axis): Price
- Horizontal Axis (X-axis): Quantity Demanded
- Slope: Typically downward sloping from left to right, reflecting the Law of Demand.
Shifts vs. Movements Along the Demand Curve:
- Movement Along the Curve:
- Cause: Change in the price of the good itself.
- Effect: Change in quantity demanded.
- Example: A decrease in the price of apples leads to an increase in the quantity of apples demanded, moving downward along the demand curve.
- Shift of the Demand Curve:
- Cause: Change in non-price determinants of demand.
- Effect: Change in demand (the entire curve shifts right or left).
- Example: An increase in consumer income can shift the demand curve for normal goods to the right.
4. Determinants of Demand
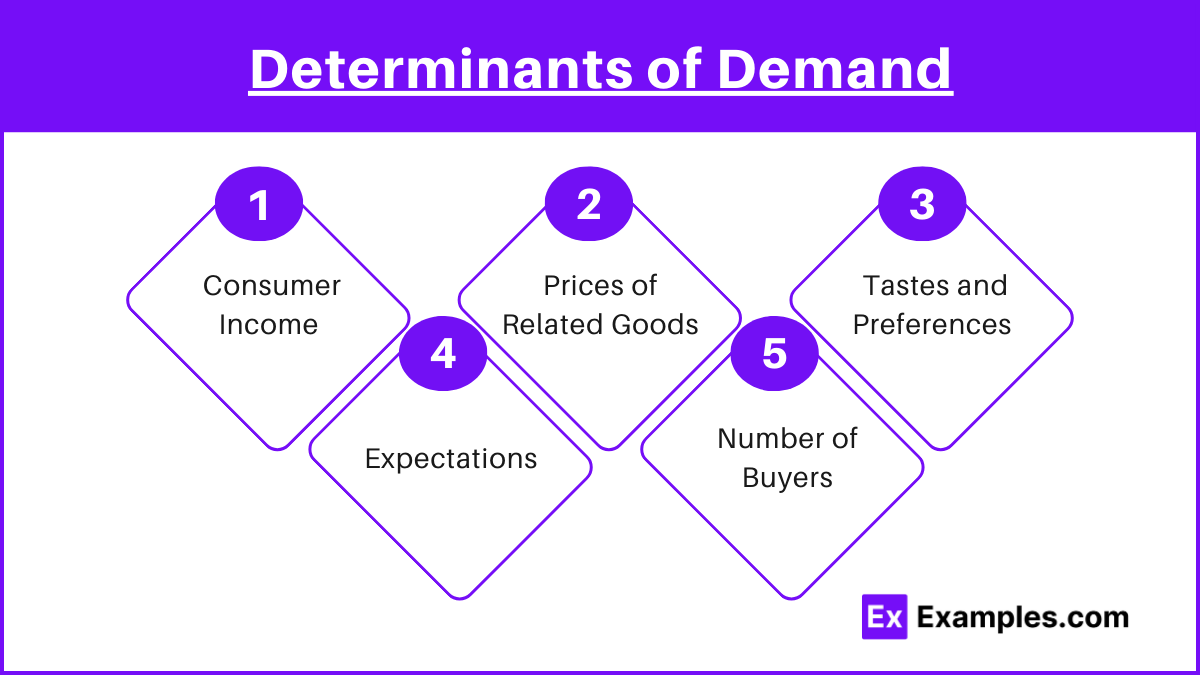
Several factors can shift the demand curve by changing the overall demand for a good or service.
a. Consumer Income
- Normal Goods: Demand increases as income increases.
- Inferior Goods: Demand decreases as income increases.
b. Prices of Related Goods
- Substitutes: Goods that can replace each other (e.g., butter and margarine).
- Increase in the price of a substitute: Increases demand for the related good.
- Complements: Goods that are used together (e.g., coffee and sugar).
- Increase in the price of a complement: Decreases demand for the related good.
c. Tastes and Preferences
- Changes in consumer preferences can increase or decrease demand.
- Example: A rise in health consciousness may decrease demand for sugary drinks.
d. Expectations
- Future Prices: If consumers expect prices to rise, current demand may increase.
- Future Income: Expectations of higher future income can increase current demand.
e. Number of Buyers
- An increase in the number of consumers in the market shifts demand to the right.
- Example: Population growth increases demand for various goods.
5. Price Elasticity of Demand (PED)
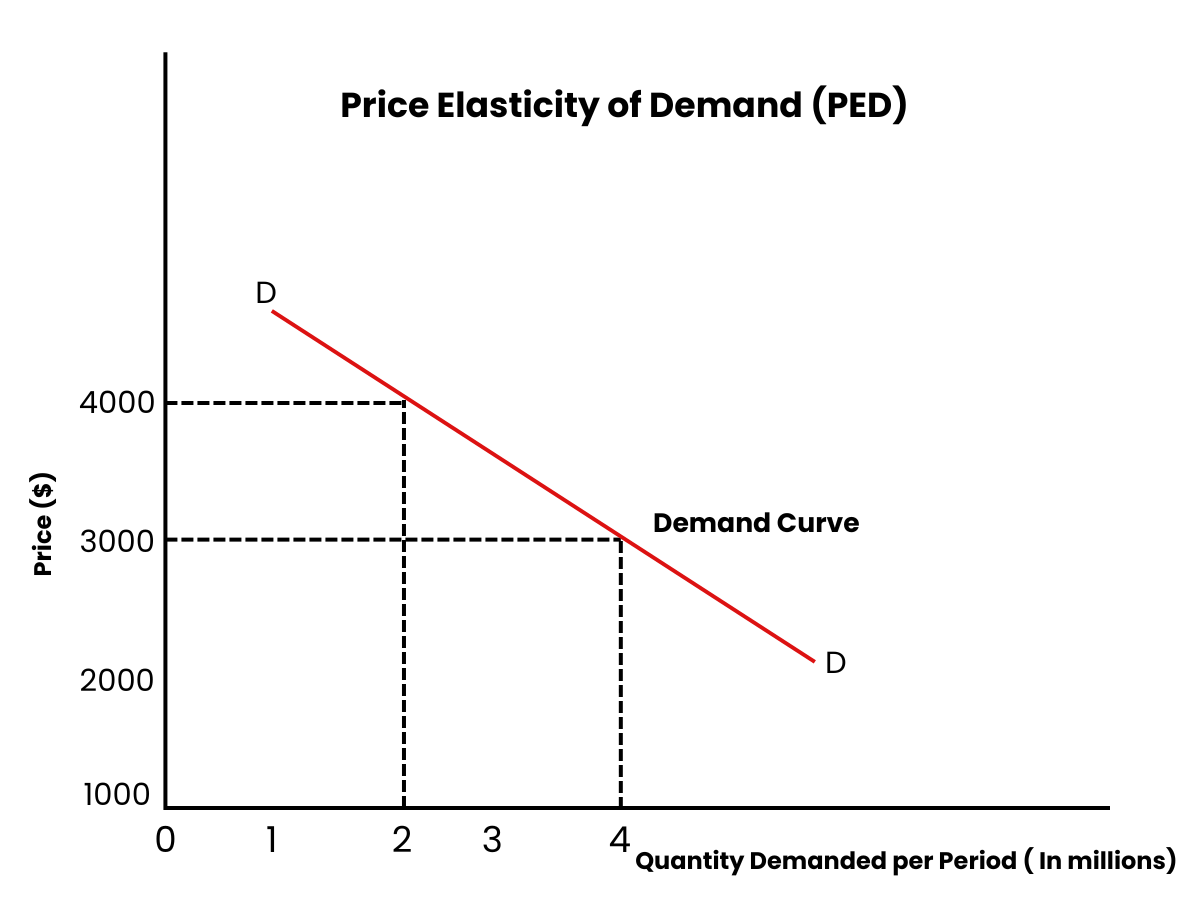
Price Elasticity of Demand measures the responsiveness of quantity demanded to a change in price.
Formula: PED = % Change in Quantity Demanded / % Change in Price
Elasticity Categories:
- Elastic Demand (PED > 1): Quantity demanded changes by a larger percentage than the price change.
- Inelastic Demand (PED < 1): Quantity demanded changes by a smaller percentage than the price change.
- Unitary Elastic Demand (PED = 1): Quantity demanded changes by the same percentage as the price change.
- Perfectly Elastic Demand (PED = ∞): Consumers will only buy at one price.
- Perfectly Inelastic Demand (PED = 0): Quantity demanded is unchanged regardless of price.
Examples
1. Normal Goods: Increased Demand with Rising Incomes
martphones are considered normal goods because their demand increases as consumers’ incomes rise. As individuals earn more, they are more willing and able to purchase the latest smartphone models with advanced features. For instance, during economic growth periods, consumers may upgrade from basic phones to high-end smartphones from brands like Apple or Samsung. This shift reflects an outward (rightward) movement of the demand curve for smartphones, indicating higher demand at each price level due to increased consumer purchasing power.
2. Inferior Goods: Decreased Demand with Rising Incomes
Instant noodles serve as a classic example of inferior goods, where demand decreases as consumer incomes increase. When individuals have lower incomes, instant noodles are an affordable and convenient meal option, leading to higher demand. However, as their financial situation improves, consumers may opt for more nutritious or premium food alternatives, such as fresh vegetables or restaurant meals. Consequently, the demand curve for instant noodles shifts leftward, signifying a reduction in demand at each price level as consumers prefer superior substitutes.
Example 3. Substitute Goods: Demand Changes Due to Price Shifts in Related Goods
Coffee and tea are substitute goods because they can be used in place of one another. If the price of coffee rises significantly, consumers may switch to tea as a more cost-effective alternative. For example, if a popular coffee chain increases the price of its lattes, tea drinkers may see an opportunity to purchase tea instead, thereby increasing the demand for tea. This substitution effect causes the demand curve for tea to shift rightward, reflecting higher demand due to the increased price of its substitute, coffee.
Exampl,e 4. Complementary Goods: Demand Changes Due to Price Shifts in Related Goods
Printers and ink cartridges are complementary goods because they are used together. If the price of ink cartridges rises, the overall cost of operating a printer increases, leading consumers to reduce their usage or delay purchasing new printers. For instance, a significant hike in ink cartridge prices by a major manufacturer may discourage consumers from buying additional printers, thereby decreasing the demand for printers. This relationship causes the demand curve for printers to shift leftward, indicating a lower demand at each price level due to the increased cost of their complement, ink cartridges.
Example 5. Seasonal Demand: Fluctuations Based on Time and Weather
The demand for air conditioners exhibits seasonal fluctuations, typically increasing during hot summer months. As temperatures rise, consumers become more willing and able to purchase air conditioning units to maintain comfortable indoor environments. For example, in regions experiencing extreme heat waves, the demand for air conditioners surges, shifting the demand curve rightward during these periods. Conversely, in cooler seasons, the demand diminishes, and the demand curve shifts leftward. This seasonal variability highlights how external factors like weather can significantly impact the demand for certain goods.
Multiple Choice Questions
Question 1
Which of the following best illustrates the Law of Demand?
A) As the price of apples increases, consumers buy more apples because they are considered healthier.
B) As the price of gasoline decreases, the quantity demanded for gasoline increases because consumers find it more affordable.
C) When the price of coffee remains unchanged, but consumer income rises, leading to an increase in coffee consumption.
D) If the price of tea increases and the quantity demanded for coffee increases, assuming tea and coffee are substitutes.
Answer: B) As the price of gasoline decreases, the quantity demanded for gasoline increases because consumers find it more affordable.
Explanation: The Law of Demand states that, all else being equal, there is an inverse relationship between the price of a good and the quantity demanded. This means that when the price decreases, the quantity demanded increases, and vice versa.
- Option A: This scenario describes a situation where the quantity demanded increases as price increases, which violates the Law of Demand. This could be an example of a Veblen good, where higher prices may make the good more desirable as a status symbol, but it does not illustrate the Law of Demand.
- Option B: This directly aligns with the Law of Demand. A decrease in price leads to an increase in quantity demanded because the good becomes more affordable for consumers.
- Option C: This scenario involves a change in consumer income, which affects demand, not the Law of Demand itself. It illustrates a shift in the demand curve due to a non-price determinant.
- Option D: This describes the relationship between substitute goods. While it involves demand dynamics, it is more about the cross elasticity of demand rather than the Law of Demand itself.
Question 2
Which of the following changes would cause the demand curve for electric cars to shift to the right?
A) An increase in the price of gasoline.
B) A decrease in consumer income, assuming electric cars are normal goods.
C) An improvement in battery technology that reduces the cost of electric cars.
D) An increase in the price of hybrid cars, assuming hybrid and electric cars are substitutes.
Answer: A) An increase in the price of gasoline.
Explanation: A rightward shift in the demand curve indicates an increase in demand, meaning consumers are willing to purchase more of the good at every price level. Several factors can cause this shift, including changes in the price of related goods, consumer income, preferences, etc.
- Option A: An increase in the price of gasoline makes driving more expensive. As a result, consumers may seek alternatives, such as electric cars, increasing the demand for electric cars. This causes the demand curve to shift to the right.
- Option B: A decrease in consumer income, assuming electric cars are normal goods, would lead to a decrease in demand. For normal goods, demand increases as income increases and decreases as income decreases, causing the demand curve to shift to the left.
- Option C: An improvement in battery technology that reduces the cost of electric cars would likely increase the supply of electric cars (shift the supply curve to the right) rather than directly shifting the demand curve. However, if the reduction in cost makes electric cars more attractive, it could indirectly increase demand, but the primary effect is on supply.
- Option D: An increase in the price of hybrid cars, which are substitutes for electric cars, would indeed increase the demand for electric cars (shift to the right). However, since Option A directly affects the need for electric cars by making their substitute (gasoline) more expensive, it is a more straightforward illustration of a shift in demand.
Question 3
If the price elasticity of demand for a product is -0.8, which of the following statements is true?
A) The demand for the product is elastic, and consumers are highly responsive to price changes.
B) The demand for the product is inelastic, and consumers are not very responsive to price changes.
C) The demand for the product is unitary elastic, and the percentage change in quantity demanded is equal to the percentage change in price.
D) The demand for the product is perfectly inelastic, and quantity demanded does not change regardless of price changes.
Answer: B) The demand for the product is inelastic, and consumers are not very responsive to price changes.
Explanation: Price Elasticity of Demand (PED) measures how much the quantity demanded of a good responds to a change in its price. It is calculated as:PED=% Change in Price% Change in Quantity Demanded
- Elastic Demand: ∣PED∣ > 1
- Consumers are highly responsive to price changes.
- Example: Luxury goods.
- Inelastic Demand: ∣PED∣ < 1
- Consumers are not very responsive to price changes.
- Example: Necessities like insulin or basic food items.
- Unitary Elastic Demand: ∣PED∣ = 1
- Percentage change in quantity demanded is equal to the percentage change in price.
- Perfectly Inelastic Demand: ∣PED∣ = 0
- Quantity demanded does not change regardless of price changes.
Given that the PED is -0.8:
- The absolute value of PED is 0.8, which is less than 1.
- This indicates that the demand is inelastic.
- Consumers are not very responsive to price changes; a price increase will lead to a proportionally smaller decrease in quantity demanded, and vice versa.


