In AP Microeconomics, supply represents the relationship between the price of a good or service and the quantity that producers are willing and able to offer for sale. It is a fundamental concept that, alongside demand, determines market equilibrium. The supply curve typically slopes upward, indicating that higher prices incentivize producers to increase output. Understanding supply involves analyzing various determinants such as production costs, technology, and government policies, which collectively influence how markets respond to changes and maintain economic balance.
Learning Objectives
To master the Supply topic for AP Microeconomics, you should understand the definition of supply and the law of supply, which explains the positive relationship between price and quantity supplied. Learn the determinants of supply, including input prices, technology, number of sellers, expectations, and government policies. Differentiate between shifts and movements along the supply curve, and grasp the concept of elasticity of supply and its determinants. Additionally, comprehend market supply aggregation and the interaction of supply with demand to determine equilibrium.
1. Introduction to Supply
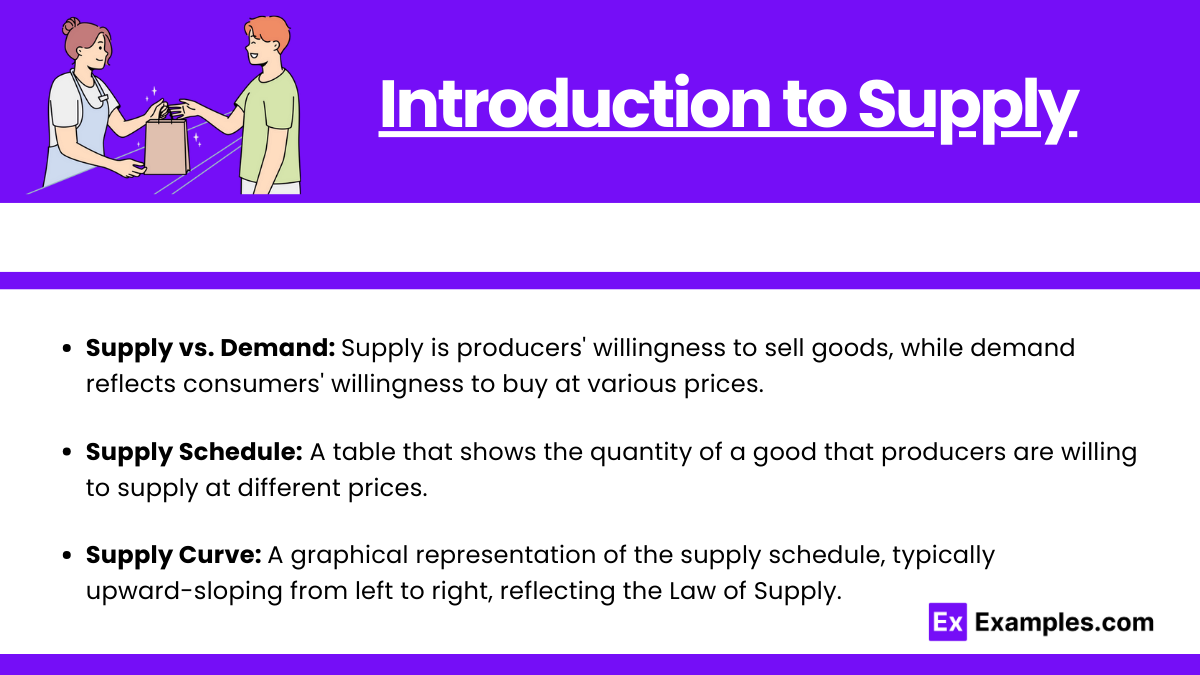
Supply refers to the quantity of a good or service that producers are willing and able to offer for sale at various prices over a given period, holding all other factors constant (ceteris paribus).
- Supply vs. Demand: While demand represents consumers’ willingness to purchase goods at different prices, supply represents producers’ willingness to sell goods at different prices. The interaction of supply and demand determines the market equilibrium price and quantity.
- Supply Schedule: A table that shows the quantity of a good that producers are willing to supply at different prices.
- Supply Curve: A graphical representation of the supply schedule, typically upward-sloping from left to right, reflecting the Law of Supply.
2. The Law of Supply
There is a direct relationship between the price of a good and the quantity supplied. As the price increases, the quantity supplied increases, and vice versa, assuming all other factors remain constant.
Graphical Representation :
- Supply Curve: Upward sloping from left to right.
- Axes:
- Vertical Axis (Price): Represents the price level.
- Horizontal Axis (Quantity): Represents the quantity of the good supplied.
Shifts vs. Movements Along the Supply Curve
Movement Along the Curve
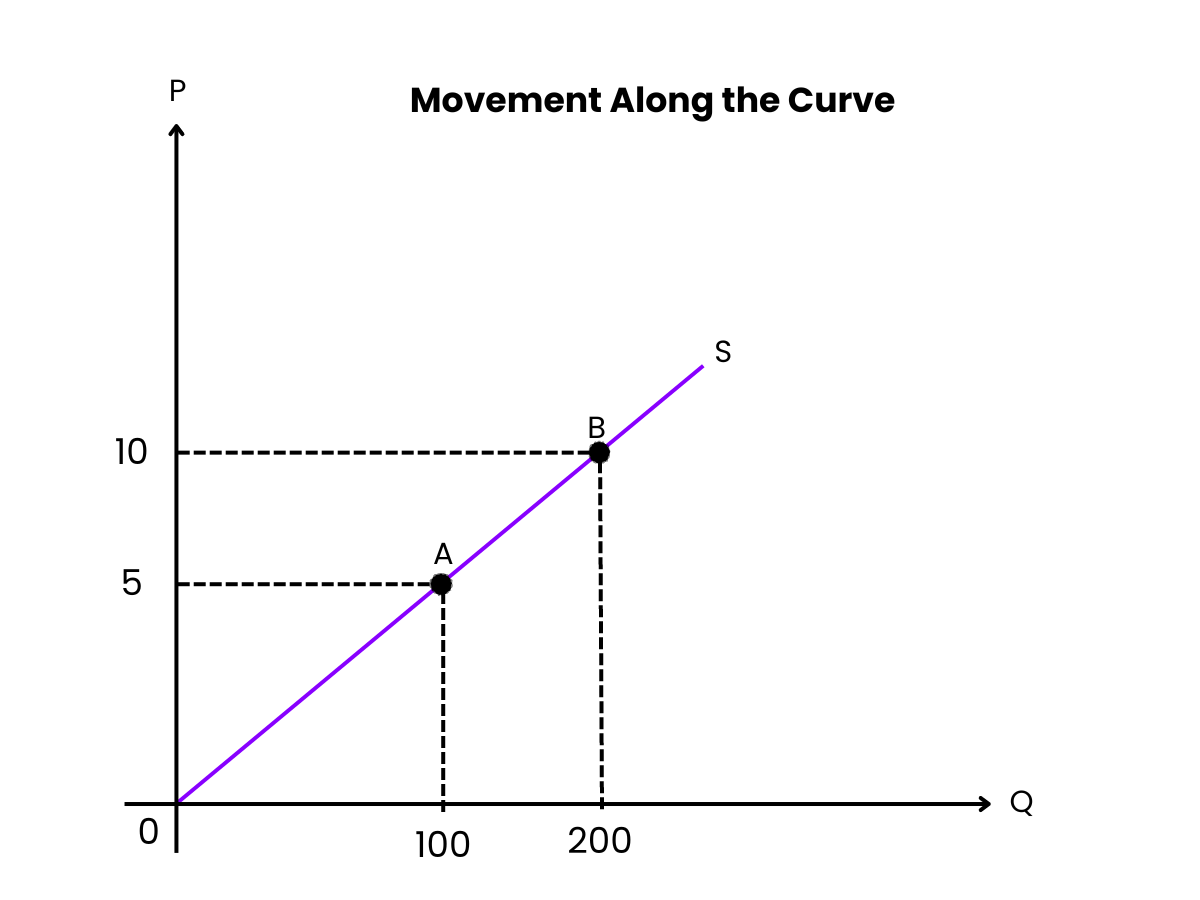
Caused by a change in the price of the good itself.
- Increase in Price: Movement upward along the supply curve → Increase in quantity supplied.
- Decrease in Price: Movement downward along the supply curve → Decrease in quantity supplied.
Shift of the Supply Curve
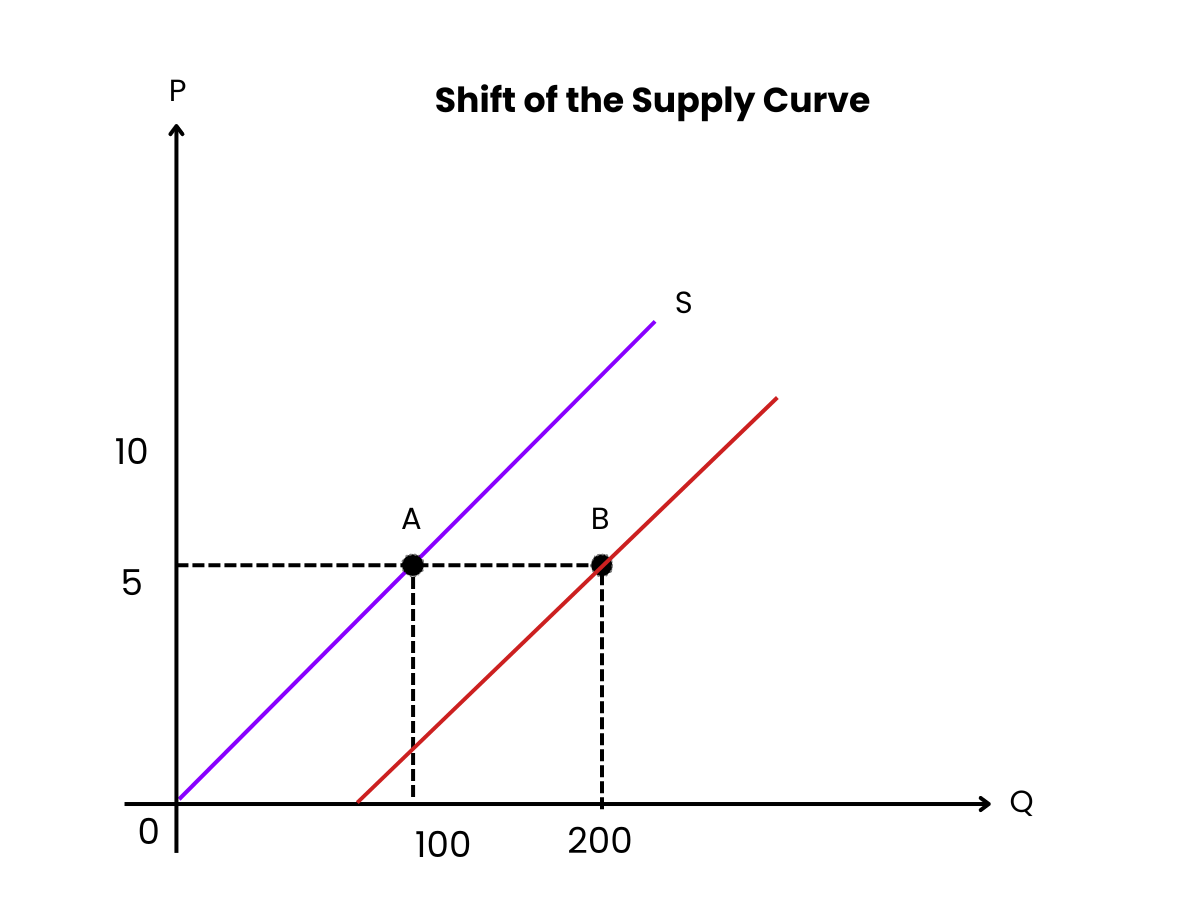
Caused by a change in any non-price determinant of supply.
- Rightward Shift: An increase in supply.
- Leftward Shift: A decrease in supply.
3. Determinants of Supply
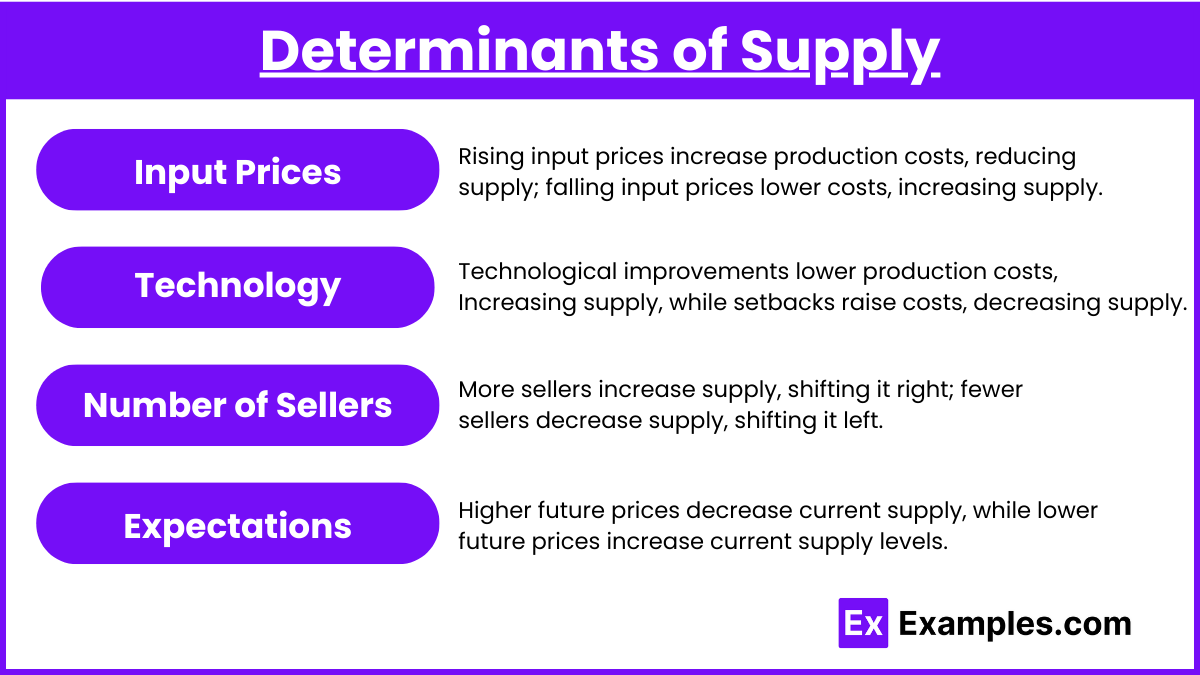
Several factors can cause the supply curve to shift. These determinants are non-price factors that influence producers’ willingness and ability to supply goods.
a. Input Prices:
- Explanation: The cost of inputs (raw materials, labor, etc.) affects production costs.
- Impact:
- Increase in Input Prices: Increases production costs → Decrease in supply (shift left).
- Decrease in Input Prices: Decreases production costs → Increase in supply (shift right).
b. Technology:
- Explanation: Technological advancements can make production more efficient.
- Impact:
- Improved Technology: Reduces production costs → Increase in supply (shift right).
- Technological Setbacks: Increases production costs → Decrease in supply (shift left).
c. Number of Sellers:
- Explanation: More producers in the market can increase the total supply.
- Impact:
- Increase in Number of Sellers: Increase in supply (shift right).
- Decrease in Number of Sellers: Decrease in supply (shift left).
d. Expectations:
- Explanation: Producers’ expectations about future prices can influence current supply.
- Impact:
- Expect Higher Future Prices: Producers may reduce current supply to sell more in the future → Decrease in current supply (shift left).
- Expect Lower Future Prices: Producers may increase current supply to sell before prices drop → Increase in current supply (shift right).
4. Supply Schedule and Supply Curve
a. Supply Schedule:
A table that shows the quantity supplied at different price levels.
Example:
| Price ($) | Quantity Supplied (units) |
|---|---|
| 10 | 100 |
| 20 | 200 |
| 30 | 300 |
| 40 | 400 |
b. Supply Curve:
A graphical representation of the supply schedule.
- Plotting: Price on the vertical axis and quantity supplied on the horizontal axis.
- Shape: Typically upward sloping, reflecting the law of supply.
Elasticity of Supply
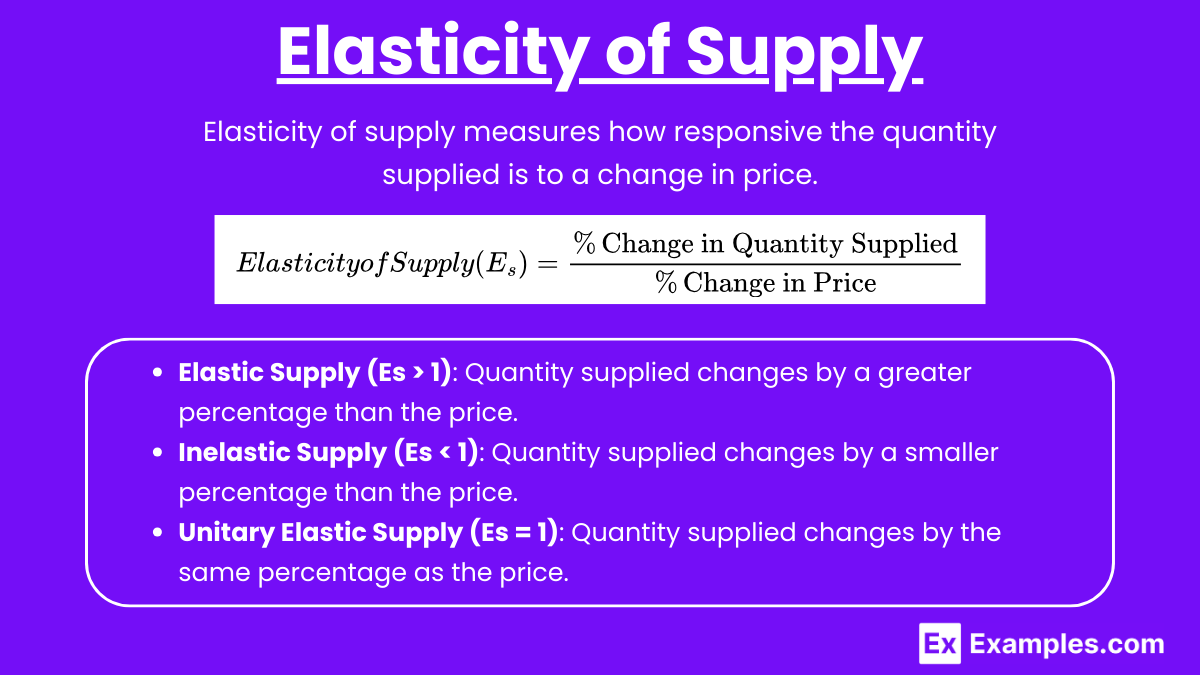
Elasticity of supply measures how responsive the quantity supplied is to a change in price.
a. Formula:
![]()
b. Types:
- Elastic Supply (Es > 1): Quantity supplied changes by a greater percentage than the price.
- Inelastic Supply (Es < 1): Quantity supplied changes by a smaller percentage than the price.
- Unitary Elastic Supply (Es = 1): Quantity supplied changes by the same percentage as the price.
Examples
Example 1. Technological Advancements in Agriculture
Example: Imagine a farmer who grows corn using traditional farming methods. Recently, the farmer has invested in advanced machinery and genetically modified corn seeds that are more resistant to pests and diseases. These technological advancements allow the farmer to produce more corn at a lower cost per unit.
Analysis: The introduction of improved technology reduces the cost of production and increases the efficiency of corn farming. As a result, the farmer is able to supply more corn at every price level. This causes the supply curve for corn to shift to the right, indicating an increase in supply. On a supply and demand graph, this shift would lead to a lower equilibrium price and a higher equilibrium quantity, assuming demand remains constant.
Key Concepts Illustrated:
- Shift in Supply Curve: Rightward shift due to technological improvement.
- Determinant of Supply: Technology.
Example 2. Increase in the Price of Inputs for Automobile Manufacturing
Example: Consider an automobile manufacturer that relies heavily on steel as a primary input for producing cars. Suppose the global price of steel increases significantly due to a surge in demand from other industries and a decrease in supply. This rise in steel prices makes it more expensive for the manufacturer to produce each car.
Analysis: Higher input prices increase the overall cost of production for automobiles. Faced with these increased costs, the manufacturer may decide to supply fewer cars at each price level to maintain profitability. Consequently, the supply curve for automobiles shifts to the left, indicating a decrease in supply. On a supply and demand graph, this shift would lead to a higher equilibrium price and a lower equilibrium quantity, assuming demand remains unchanged.
Key Concepts Illustrated:
- Shift in Supply Curve: Leftward shift due to an increase in input prices.
- Determinant of Supply: Input prices.
Example 3. Government Subsidies for Renewable Energy Producers
Example: A government decides to promote renewable energy by offering subsidies to companies that produce solar panels. These subsidies reduce the production costs for solar panel manufacturers, making it more profitable to produce and sell solar panels.
Analysis: With the subsidy in place, the cost of producing solar panels decreases, enabling manufacturers to supply more panels at every price level. This results in the supply curve for solar panels shifting to the right, indicating an increase in supply. On the supply and demand graph, this shift would typically lead to a lower equilibrium price and a higher equilibrium quantity of solar panels, assuming demand remains constant.
Key Concepts Illustrated:
- Shift in Supply Curve: Rightward shift due to government subsidies.
- Determinant of Supply: Government policies (subsidies).
Example 4. Entry of New Firms into the Smartphone Market
Example: Suppose the smartphone market is initially dominated by a few major companies. However, due to the high profitability of smartphone sales, several new firms enter the market, each introducing their own smartphone models.
Analysis: The entry of new firms increases the total quantity of smartphones available in the market at every price level. This leads to a rightward shift in the market supply curve for smartphones, representing an increase in market supply. On the supply and demand graph, this shift would result in a lower equilibrium price and a higher equilibrium quantity of smartphones, assuming demand remains constant.
Key Concepts Illustrated:
- Shift in Supply Curve: Rightward shift due to an increase in the number of sellers.
- Determinant of Supply: Number of sellers.
Example 5. Anticipation of Future Price Increases by Producers
Example: A wheat farmer anticipates that the price of wheat will rise significantly in the next six months due to expected drought conditions that may reduce future supply. To take advantage of the higher future prices, the farmer decides to withhold some of the current wheat supply from the market.
Analysis: By reducing the current supply of wheat, the farmer aims to sell more wheat at higher prices in the future. This decision results in a leftward shift of the current supply curve for wheat, indicating a decrease in supply today. On the supply and demand graph, this shift would lead to a higher equilibrium price and a lower equilibrium quantity of wheat in the present, assuming demand remains unchanged.
Key Concepts Illustrated:
- Shift in Supply Curve: Leftward shift due to producers’ expectations of higher future prices.
- Determinant of Supply: Producers’ expectations about future prices.
Multiple Choice Questions
Question 1
Which of the following scenarios would cause the supply curve for electric cars to shift to the right?
A) An increase in the price of lithium, a key input for electric car batteries.
B) A technological advancement that makes battery production more efficient.
C) A decrease in government subsidies for electric car manufacturers.
D) Producers expect the price of electric cars to decrease in the future.
Answer: B) A technological advancement that makes battery production more efficient.
Explanation: To determine which scenario shifts the supply curve to the right (indicating an increase in supply), we need to identify factors that make production more efficient or less costly, thereby enabling producers to supply more at each price level.
- Option A: An increase in the price of lithium, a key input, raises production costs. Higher costs typically reduce supply, shifting the supply curve to the left, not right.
- Option B: A technological advancement that makes battery production more efficient lowers production costs. With lower costs, manufacturers can produce more electric cars at every price level, shifting the supply curve to the right.
- Option C: A decrease in government subsidies removes financial support that helps lower production costs. Without subsidies, production becomes more expensive, reducing supply and shifting the curve to the left.
- Option D: If producers expect prices to decrease in the future, they might reduce current supply to sell more later when prices are higher. This expectation causes the current supply curve to shift to the left.
Therefore, Option B is the correct answer as it directly leads to an increase in supply.
Question 2
If the price of a complementary input in the production of smartphones decreases, what is the most likely effect on the supply curve for smartphones?
A) The supply curve shifts to the left.
B) The supply curve shifts to the right.
C) There is a movement upward along the supply curve.
D) There is a movement downward along the supply curve.
Answer: B) The supply curve shifts to the right.
Explanation: A complementary input is a good that is used together with another in the production process. In this case, the complementary input is a component used in producing smartphones.
- Decrease in the Price of a Complementary Input: When the cost of a complementary input falls, the overall production costs for smartphones decrease. Lower production costs make it cheaper for producers to supply smartphones at every price level.
- Effect on Supply Curve: Lower production costs enable producers to increase the quantity supplied at each price, shifting the supply curve to the right.
- Incorrect Options:
- Option A: Shifts to the left would imply a decrease in supply, which is contrary to the effect of lower input costs.
- Options C and D: Movements along the supply curve are caused by changes in the price of the good itself, not by changes in input costs.
Thus, Option B correctly identifies the shift in the supply curve resulting from a decrease in the price of a complementary input.
Question 3
The elasticity of supply for a particular good is measured to be 0.5. Which of the following statements is true?
A) The supply is elastic; producers are highly responsive to price changes.
B) The supply is inelastic; producers are not very responsive to price changes.
C) The supply is unit elastic; the percentage change in quantity supplied equals the percentage change in price.
D) The supply is perfectly elastic; producers will supply any quantity at a given price.
Answer: B) The supply is inelastic; producers are not very responsive to price changes.
Explanation: Elasticity of Supply (Es) measures how responsive the quantity supplied is to a change in price. It is calculated as:
![]()
- Elastic Supply (Es > 1): Quantity supplied changes by a greater percentage than the price. Producers are highly responsive to price changes.
- Inelastic Supply (Es < 1): Quantity supplied changes by a smaller percentage than the price. Producers are not very responsive to price changes.
- Unitary Elastic Supply (Es = 1): Quantity supplied changes by the same percentage as the price.
- Perfectly Elastic Supply: Producers are willing to supply any quantity at a given price (Es approaches infinity).
Given that Es = 0.5, which is less than 1, the supply is inelastic. This means that producers are not very responsive to price changes; a 10% increase in price would result in only a 5% increase in quantity supplied, for example.
- Option A: Incorrect because an elasticity greater than 1 indicates elastic supply, not 0.5.
- Option C: Incorrect because unitary elasticity occurs when Es equals 1.
- Option D: Incorrect because perfectly elastic supply implies an infinite elasticity, not 0.5.
Therefore, Option B is the correct statement regarding the elasticity of supply for the good.


