
The Production Possibilities Curve

The Production Possibilities Curve (PPC) in AP Microeconomics illustrates the trade-offs between two goods that an economy can produce given finite resources and technology. It highlights the concepts of opportunity cost, efficiency, and scarcity by showing the maximum output combinations. Points on the curve represent efficient resource use, while points inside indicate inefficiency. The curve also demonstrates increasing opportunity costs as more of one good is produced. Understanding the PPC is essential for analyzing economic decision-making and resource allocation at the microeconomic level.
Free AP Microeconomics Practice Test
Learning Objectives
For the topic of "The Production Possibilities Curve" in AP Microeconomics, you should aim to understand how the PPC illustrates scarcity, trade-offs, opportunity costs, and efficient resource allocation. You should learn to analyze how changes in resources and technology shift the curve and how points on, inside, or outside the curve represent efficiency, inefficiency, and unattainable production. Additionally, grasp the concept of increasing opportunity costs and how specialization and trade can extend production possibilities beyond an individual PPC.
Production Possibilities Curve (PPC)
The Production Possibilities Curve (PPC), also known as the Production Possibilities Frontier (PPF), is a fundamental concept in economics that illustrates the trade-offs and opportunity costs associated with the allocation of resources in an economy. Here's a detailed breakdown to help you prepare for your AP Macroeconomics exam:
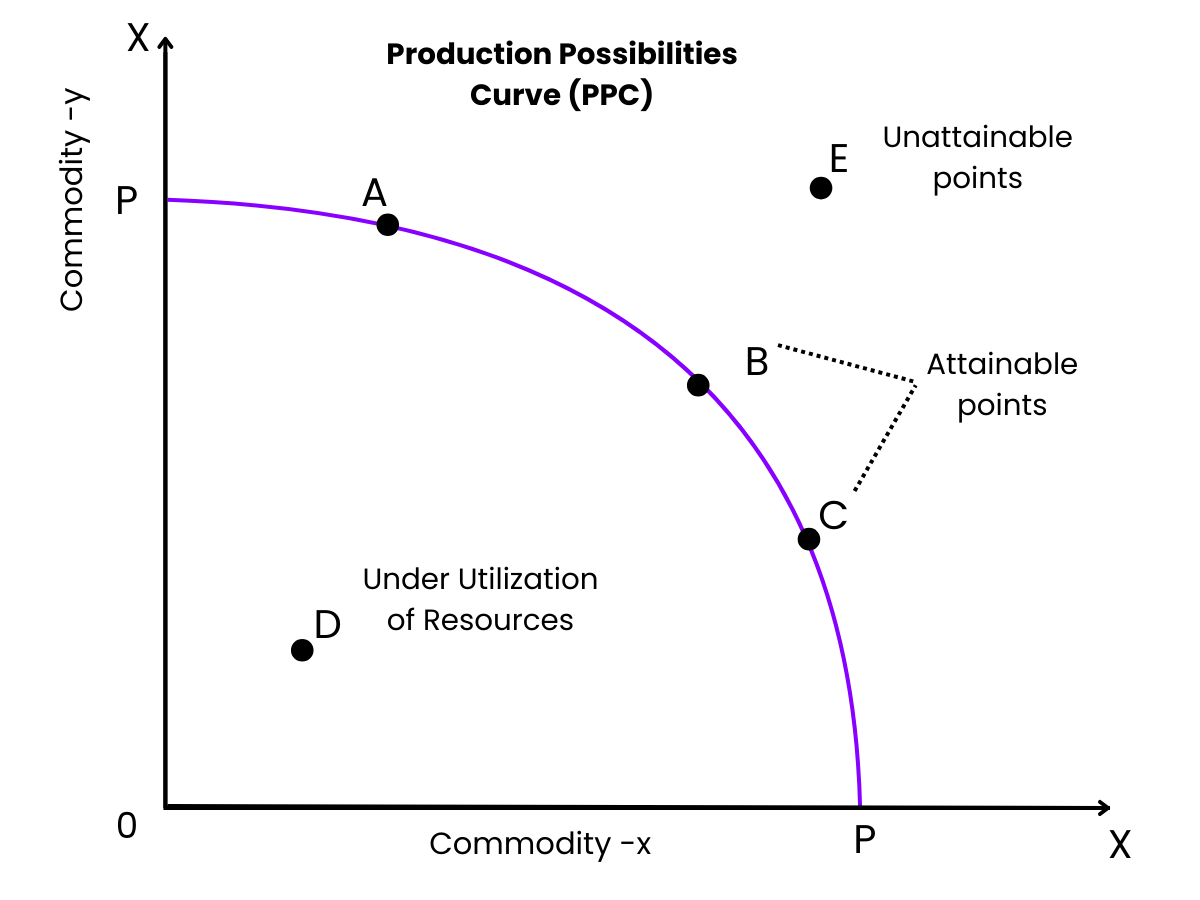
The PPC is a graphical representation of the maximum possible output combinations of two goods or services that can be produced in an economy, given available resources and technology. It assumes that all resources are fully employed and efficiently used.
Key Concepts
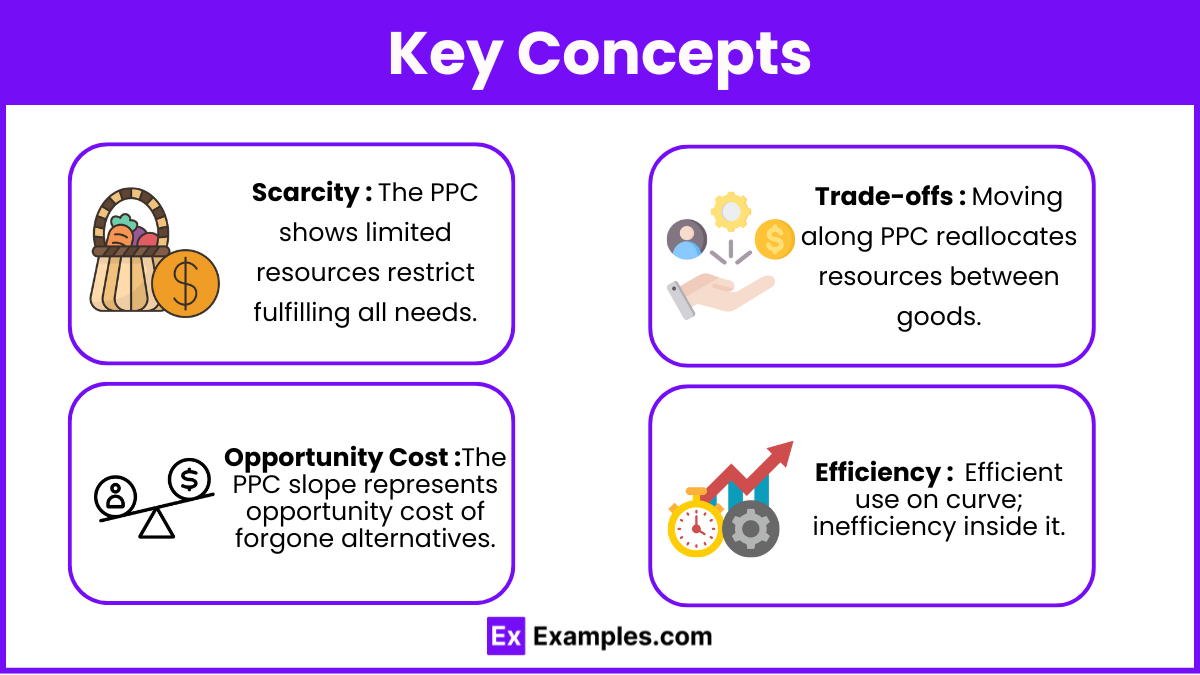
Scarcity: The PPC demonstrates that there are limited resources, meaning not all wants and needs can be fulfilled simultaneously. This limitation forces societies to make choices.
Trade-offs: Moving along the PPC means reallocating resources from the production of one good to another. For example, producing more of Good A means producing less of Good B.
Opportunity Cost: The slope of the PPC shows the opportunity cost, which is the value of the next best alternative forgone when a decision is made. A steeper slope indicates a higher opportunity cost.
Efficiency: Any point on the curve represents an efficient use of resources, while any point inside the curve represents inefficiency (underutilization of resources). A point outside the curve is unattainable with current resources and technology.
Shape of the PPC
The PPC is typically concave to the origin. This is because resources are not perfectly adaptable for producing both goods, meaning increasing production of one good requires larger sacrifices in the production of the other good, demonstrating increasing opportunity costs.
In some cases, the PPC can be a straight line, which would imply constant opportunity costs between the two goods.
Shifts in the PPC
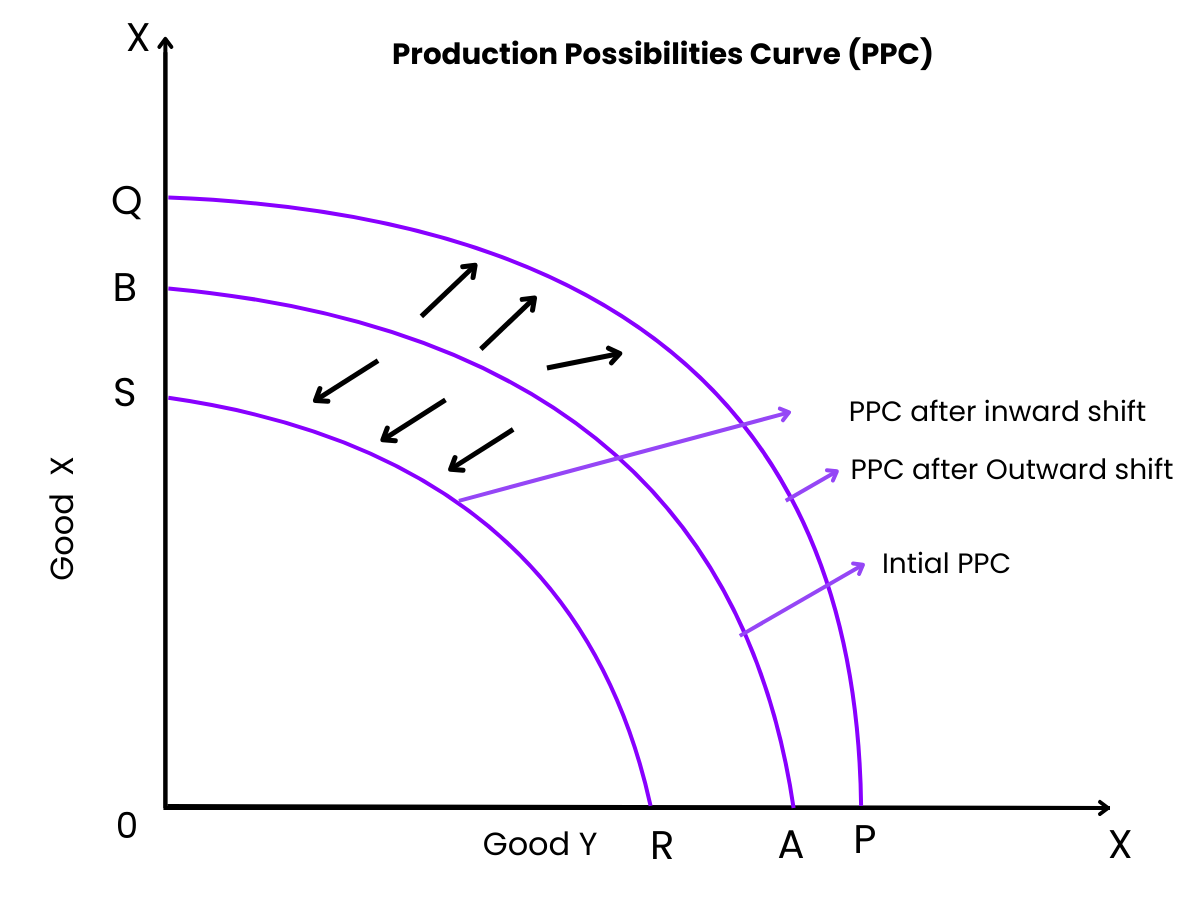
Outward Shift: An outward shift of the PPC represents economic growth. This can happen due to factors such as improvements in technology, an increase in the labor force, or better education and training.
Inward Shift: An inward shift reflects a decline in an economy’s productive capacity, which can be caused by events like natural disasters, loss of labor, or depletion of natural resources.
Specialization and Trade
The PPC can also help explain the benefits of specialization and trade.
If two countries (or entities) specialize in the production of goods in which they have a comparative advantage (lower opportunity cost), they can trade and both benefit from increased consumption possibilities, beyond their individual PPC.
Real-world Applications
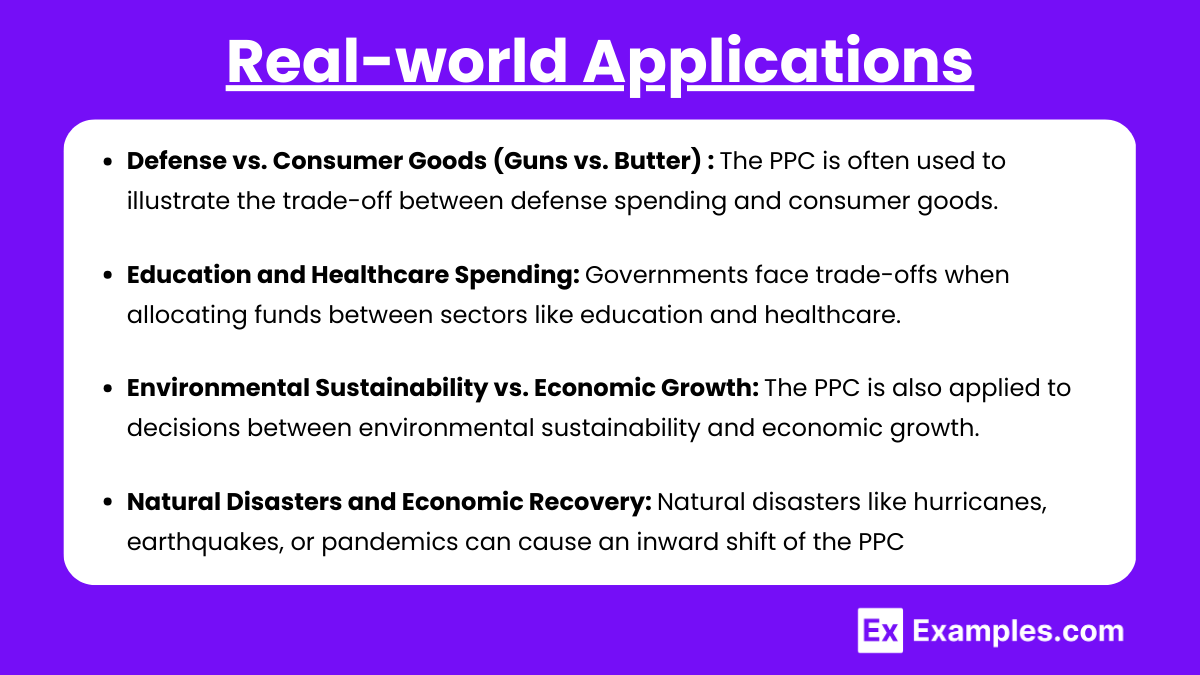
Defense vs. Consumer Goods (Guns vs. Butter) : The PPC is often used to illustrate the trade-off between defense spending and consumer goods. For example, during wartime, a country may shift resources toward producing military goods (guns), reducing the production of consumer goods (butter). The opportunity cost of increasing defense spending is the reduction in civilian goods and services.
Education and Healthcare Spending: Governments face trade-offs when allocating funds between sectors like education and healthcare. Spending more on education (e.g., building schools, hiring teachers) may lead to a better-educated workforce, which can increase future productivity and shift the PPC outward.
Environmental Sustainability vs. Economic Growth: The PPC is also applied to decisions between environmental sustainability and economic growth.
Natural Disasters and Economic Recovery: Natural disasters like hurricanes, earthquakes, or pandemics can cause an inward shift of the PPC, as resources are destroyed and the economy's productive capacity is reduced.
Examples
Example 1. Guns vs. Butter
This classic example compares the trade-off between military spending (guns) and consumer goods (butter). A country must decide how much of its resources to allocate to defense spending versus producing goods for its citizens. If the country focuses more on military defense, it can produce fewer consumer goods, and vice versa. Points along the PPC represent different combinations of guns and butter that the country can produce efficiently. Any increase in defense production comes with the opportunity cost of reduced consumer goods.
Example 2. Education vs. Infrastructure
A government may face a decision between allocating resources to education or infrastructure development. If more resources are allocated to education, such as building schools and hiring teachers, the country might have fewer resources for building roads and bridges. The PPC in this case shows the trade-offs and opportunity costs between enhancing human capital and improving physical infrastructure, with points on the curve representing various efficient combinations of the two.
Example 3. Cars vs. Computers
In an industrial economy, a PPC might compare the production of cars and computers. If a country uses its resources to focus on producing more cars, it will have fewer resources to produce computers. This example illustrates how businesses must make decisions about how to allocate resources, where a shift toward producing one good comes at the expense of the other. An outward shift in the PPC could occur if the country develops more efficient manufacturing processes or adopts new technologies.
Example 4. Healthcare vs. Housing
A society might need to balance between investing in healthcare services and building more housing. If the country chooses to allocate more resources to healthcare, such as hospitals and medical equipment, it may need to reduce the resources available for housing development. The PPC demonstrates the opportunity cost of this decision, with various points showing efficient trade-offs between improved health outcomes and increased availability of housing.
Example 5. Renewable Energy vs. Traditional Energy
An economy might face a trade-off between investing in renewable energy sources (like solar and wind power) versus traditional energy sources (like coal and oil). Producing more renewable energy requires an investment of resources that could otherwise go into extracting or refining traditional energy. The PPC here illustrates the opportunity cost of moving toward sustainability, with the efficient production of both types of energy reflected on the curve.
Multiple Choice Questions
Question 1
Which of the following would cause an outward shift of the Production Possibilities Curve (PPC)?
a) An increase in unemployment
b) A technological advancement in the production of both goods
c) A decrease in the number of available workers
d) A reduction in the availability of natural resources
Correct Answer: b) A technological advancement in the production of both goods
Explanation: An outward shift in the PPC represents economic growth, which occurs when an economy’s capacity to produce goods and services increases. A technological advancement improves efficiency, allowing for more production of both goods, thus shifting the PPC outward. Choices like an increase in unemployment (a) or a reduction in resources (d) would move production inside the PPC, showing inefficiency or reduced capacity. A decrease in the number of workers (c) would also likely shift the PPC inward.
Question 2
What does a point inside the Production Possibilities Curve (PPC) represent?
a) Efficient use of resources
b) Unattainable production levels
c) Inefficient use of resources
d) Maximum possible production of both goods
Correct Answer: c) Inefficient use of resources
Explanation: A point inside the PPC shows that the economy is not utilizing all of its resources efficiently. This could mean underemployment, unused capital, or idle resources. A point on the curve would represent efficient use of resources (a), and a point outside the curve (b) represents unattainable production levels given current resources. Maximum possible production is found along the curve itself (d), not inside it.
Question 3
The Production Possibilities Curve (PPC) is concave to the origin because of:
a) Constant opportunity costs
b) Increasing opportunity costs
c) Decreasing opportunity costs
d) No opportunity costs
Correct Answer: b) Increasing opportunity costs
Explanation: The PPC is concave to the origin because opportunity costs increase as more of one good is produced. This happens because resources are not equally efficient in producing all goods. When shifting resources to produce more of one good, increasingly larger amounts of the other good must be sacrificed, leading to rising opportunity costs. Constant opportunity costs (a) would produce a straight line, while decreasing opportunity costs (c) would produce a convex curve. There are always opportunity costs in this model, so (d) is incorrect.