
Representations of Changes in Momentum

![\[ \mathbf{F} = \frac{d\mathbf{p}}{dt} \]](https://www.examples.com/wp-content/ql-cache/quicklatex.com-60cc7022249860cf54acdc360779a398_l3.svg "Rendered by QuickLaTeX.com")
![\[ \mathbf{J} = \frac{1}{2} \mathbf{F}_{\text{max}} \Delta t \]](https://www.examples.com/wp-content/ql-cache/quicklatex.com-a64669183a97af77586207428d4a49fc_l3.svg "Rendered by QuickLaTeX.com")
![\[ \mathbf{p}_{\text{initial}} = \mathbf{p}_{\text{final}} \]](https://www.examples.com/wp-content/ql-cache/quicklatex.com-daed5bfd9e1ecfa1774efff2d63e250d_l3.svg "Rendered by QuickLaTeX.com")
![\[ \mathbf{p}_{\text{initial}}\]](https://www.examples.com/wp-content/ql-cache/quicklatex.com-3ca58783a8429aa006a6c71d5e78bec0_l3.svg "Rendered by QuickLaTeX.com")
![\[ \mathbf{p}_{\text{final}} \]](https://www.examples.com/wp-content/ql-cache/quicklatex.com-13a06c9b608fd357e4aff02a57f4d198_l3.svg "Rendered by QuickLaTeX.com")
![\[ m_1 \mathbf{v}_{1i} + m_2 \mathbf{v}_{2i} = m_1 \mathbf{v}_{1f} + m_2 \mathbf{v}_{2f} \]](https://www.examples.com/wp-content/ql-cache/quicklatex.com-6a1bb3c0370d009eeca6d6026dbd0296_l3.svg "Rendered by QuickLaTeX.com")
![\[ m_1 \mathbf{v}_{1i} + m_2 \mathbf{v}_{2i} = (m_1 + m_2) \mathbf{v}_f \]](https://www.examples.com/wp-content/ql-cache/quicklatex.com-4a950ec65c3939274c77d8839cf8b363_l3.svg "Rendered by QuickLaTeX.com")
![\[ \begin{aligned} &m_A v_A + m_B v_B = 0 \\ &50 \, \text{kg} \times 4 \, \text{m/s} + 70 \, \text{kg} \times v_B = 0 \\ &200 \, \text{kg} \cdot \text{m/s} + 70 v_B = 0 \\ &v_B = -\frac{200}{70} \\ &v_B \approx -2.86 \, \text{m/s} \end{aligned} \]](https://www.examples.com/wp-content/ql-cache/quicklatex.com-28cddd78dfe4018d551107e30847223e_l3.svg "Rendered by QuickLaTeX.com")
![\[ J_2 = \frac{1}{2} \times 10 \, \text{N} \times 3 \, \text{s} = 15 \, \text{N} \cdot \text{s} \]](https://www.examples.com/wp-content/ql-cache/quicklatex.com-d04057db433e27f777af6c1fb6f245fd_l3.svg "Rendered by QuickLaTeX.com")
![\[ \mathbf{F}_{\text{avg}} \Delta t = \Delta \mathbf{p} \]](https://www.examples.com/wp-content/ql-cache/quicklatex.com-90aa84c23f7b327313af8c529fa6431c_l3.svg "Rendered by QuickLaTeX.com")
![\[ \mathbf{F}_{\text{avg}} = \frac{\Delta \mathbf{p}}{\Delta t} = \frac{-30000 \, \text{kg} \cdot \text{m/s}}{0.2 \, \text{s}} = -150000 \, \text{N} \]](https://www.examples.com/wp-content/ql-cache/quicklatex.com-32744cb4f7db2ced7e3e16888e1918cc_l3.svg "Rendered by QuickLaTeX.com")
Understanding how to represent and analyze changes in momentum is crucial for mastering the principles of mechanics and achieving a high score on the AP Physics exam. Momentum is a key concept in understanding collisions, impulse, and conservation laws. Below are detailed notes to help you excel in this topic.
Free AP Physics 1: Algebra-Based Practice Test
Learning Objectives
By studying Representations of Changes in Momentum for the AP Physics exam, you should be able to understand and apply the concepts of momentum and impulse. You will learn to calculate changes in momentum using the impulse-momentum theorem, interpret and create momentum-time graphs, and analyze collisions using conservation of momentum principles. Additionally, you'll gain proficiency in solving problems involving elastic and inelastic collisions, and understand how external force affect the momentum of a system.
Momentum
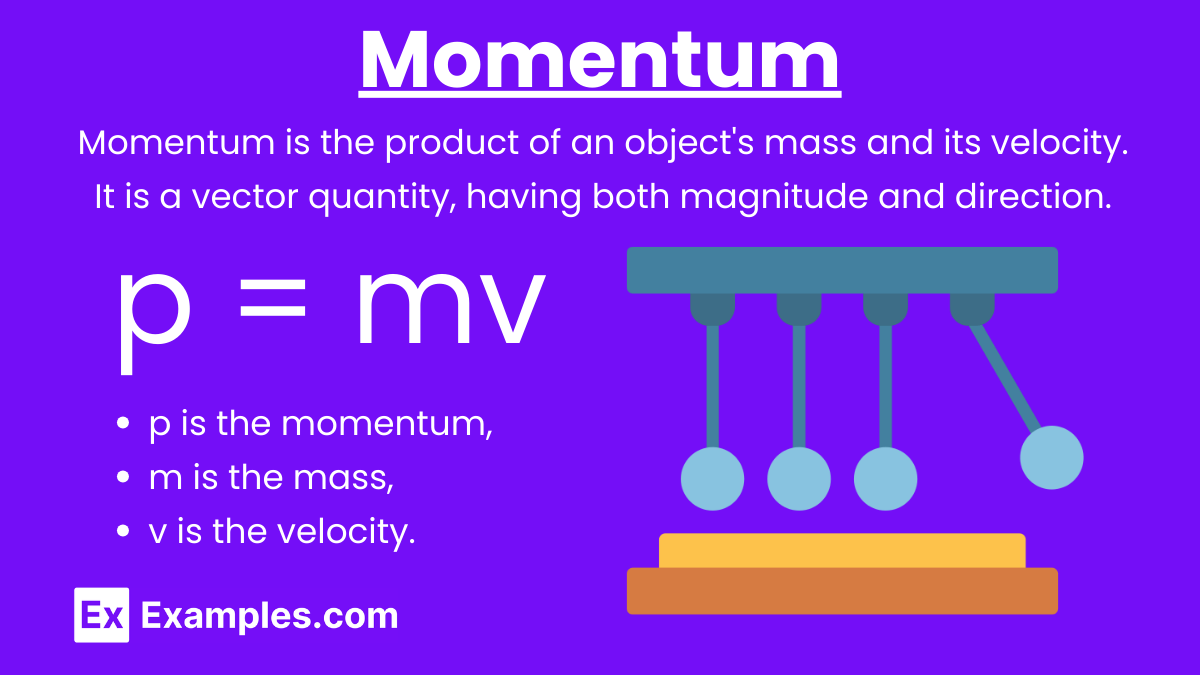
Definition: Momentum (p) is the product of an object's mass and its velocity. It is a vector quantity, meaning it has both magnitude and direction.
Formula: p = mv
where:
p is momentum (in kg·m/s),
m is the mass of the object (in kg),
v is the velocity of the object (in m/s).
Changes in Momentum
Impulse
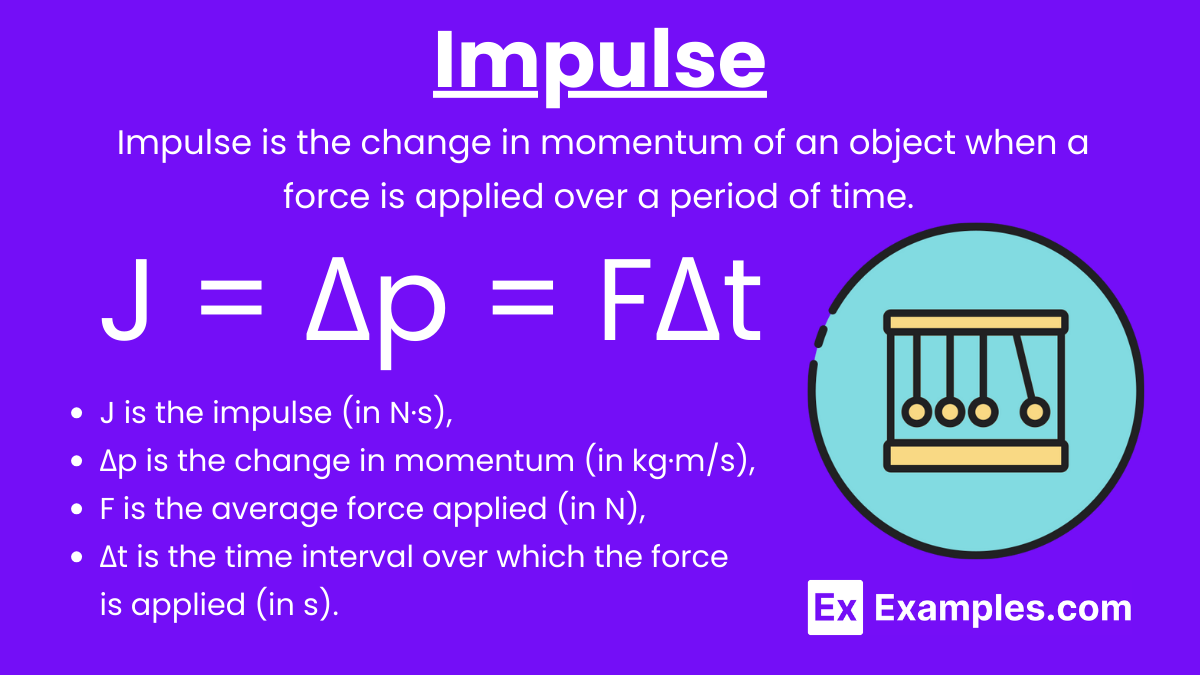
Impulse (J): Impulse is the change in momentum of an object when a force is applied over a period of time. It is equal to the product of the force and the time interval during which the force acts.
Formula: J = Δp = FΔt
where:
J is the impulse (in N·s),
Δp is the change in momentum (in kg·m/s),
F is the average force applied (in N),
Δt is the time interval over which the force is applied (in s).
Newton's Second Law in Terms of Momentum
Newton’s Second Law: The rate of change of momentum of an object is equal to the net force acting on it.
Formula: \mathbf{F} = \frac{d\mathbf{p}}{dt}
where:
F is the net force (in N),
is the rate of change of momentum (in kg·m/s²).
Graphical Representations
Force-Time Graphs
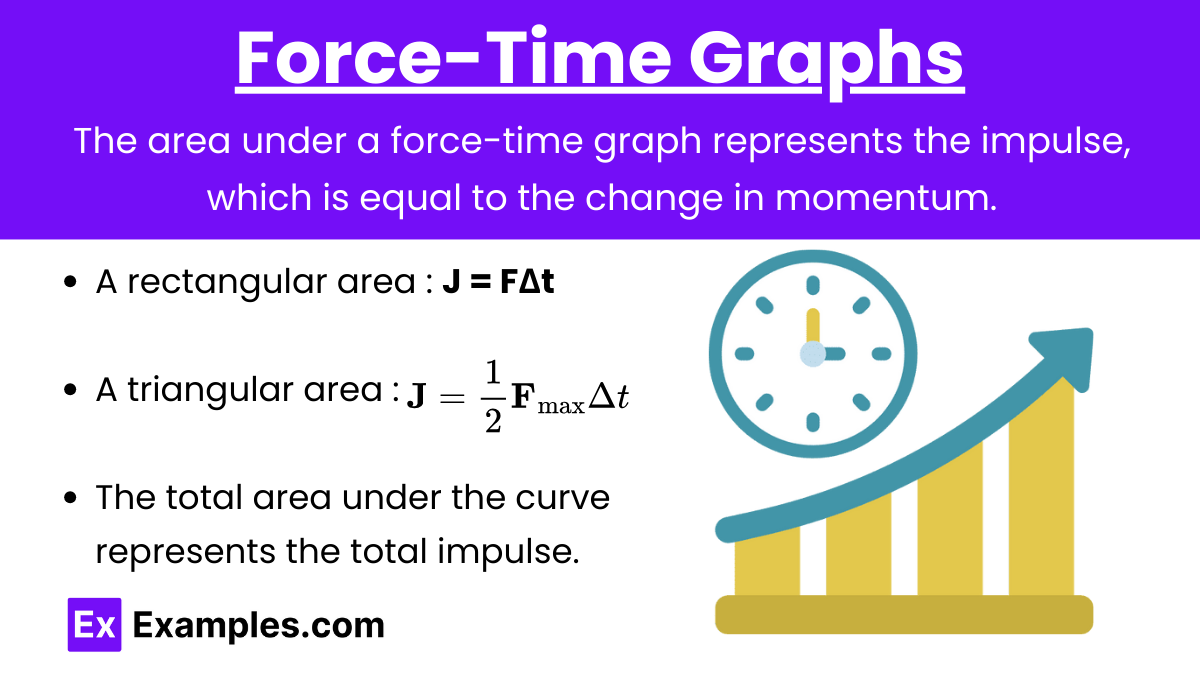
Impulse from Force-Time Graph: The area under a force-time graph represents the impulse, which is equal to the change in momentum.
Key Points:
A rectangular area (constant force): J = FΔt
A triangular area (varying force): \mathbf{J} = \frac{1}{2} \mathbf{F}_{\text{max}} \Delta t
The total area under the curve represents the total impulse.
Momentum-Time Graphs
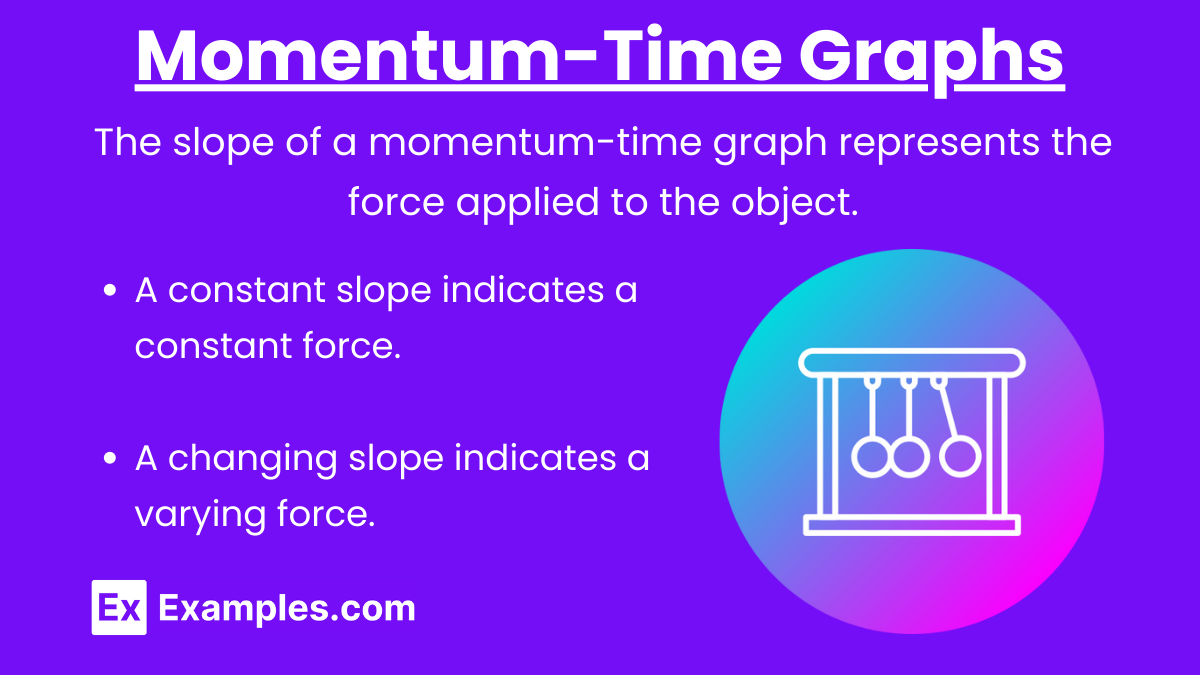
Change in Momentum from Momentum-Time Graph: The slope of a momentum-time graph represents the force applied to the object.
Key Points:
A constant slope indicates a constant force.
A changing slope indicates a varying force.
Conservation of Momentum
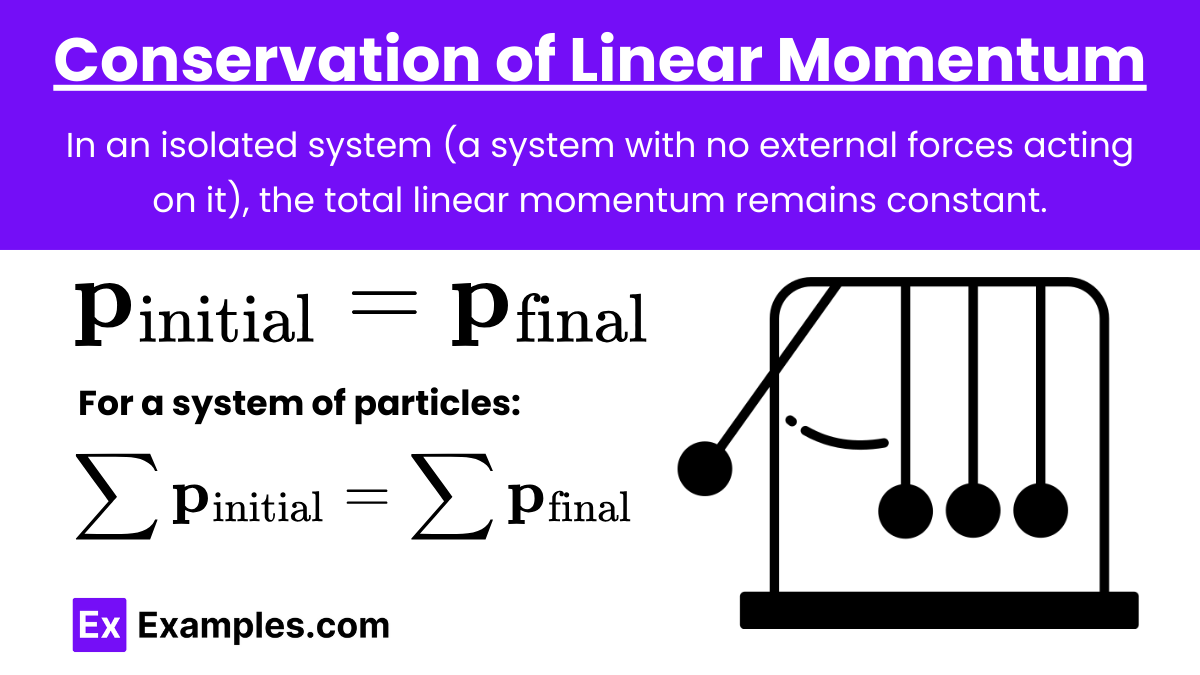
Conservation of Momentum: In a closed system with no external forces, the total momentum before an interaction is equal to the total momentum after the interaction.
Formula: \mathbf{p}_{\text{initial}} = \mathbf{p}_{\text{final}}
where:
\mathbf{p}_{\text{initial}} is the total initial momentum of the system,
\mathbf{p}_{\text{final}} is the total final momentum of the system.
Elastic and Inelastic Collisions
Elastic Collisions: Both momentum and kinetic energy are conserved.
Inelastic Collisions: Momentum is conserved, but kinetic energy is not. In perfectly inelastic collisions, objects stick together after collision.
Example: Elastic Collision: m_1 \mathbf{v}_{1i} + m_2 \mathbf{v}_{2i} = m_1 \mathbf{v}_{1f} + m_2 \mathbf{v}_{2f}
Example: Perfectly Inelastic Collision: m_1 \mathbf{v}_{1i} + m_2 \mathbf{v}_{2i} = (m_1 + m_2) \mathbf{v}_f
Examples and Problems
Example 1: Calculating Impulse
Scenario: A 2 kg object is subjected to a constant force of 5 N for 3 second. Calculate the impulse and the change in momentum of the object.
Solution: J = FΔt
J = 5N×3s = 15N⋅s
Since impulse equals the change in momentum: Δp = J= 15N⋅s
Example 2: Conservation of Momentum in a Collision
Scenario: Two ice skaters, Skater A (mass = 50 kg) and Skater B (mass = 70 kg), initially at rest, push off each other. Skater A moves with a velocity of 4 m/s. Find the velocity of Skater B.
Solution: Using conservation of momentum:
\begin{aligned} &m_A v_A + m_B v_B = 0 \\ &50 \, \text{kg} \times 4 \, \text{m/s} + 70 \, \text{kg} \times v_B = 0 \\ &200 \, \text{kg} \cdot \text{m/s} + 70 v_B = 0 \\ &v_B = -\frac{200}{70} \\ &v_B \approx -2.86 \, \text{m/s} \end{aligned}
(The negative sign indicates that Skater B moves in the opposite direction to Skater A.)
Example 3: Analyzing a Force-Time Graph
Scenario: A force-time graph shows a force of 10 N applied for 2 seconds, then decreasing linearly to 0 N over the next 3 seconds. Calculate the total impulse delivered.
Solution:
Impulse from 0 to 2 seconds: J₁ = 10N×2s = 20N⋅s
Impulse from 2 to 5 seconds (triangle area): J_2 = \frac{1}{2} \times 10 \, \text{N} \times 3 \, \text{s} = 15 \, \text{N} \cdot \text{s}
Total impulse: Jₜₒₜₐₗ = 20+15 = 35N⋅s
Example 4: Change in Momentum During a Collision
Scenario: A 1500 kg car moving at 20 m/s crashes into a wall and comes to a stop in 0.2 seconds. Calculate the average force exerted on the car during the collision.
Solution:
Calculate initial momentum (pᵢ): pᵢ = mvᵢ = 1500kg×20m/s = 30000kg⋅m/s
Calculate final momentum (pբ): pբ = mvբ = 1500kg×0m/s = 0kg⋅m/s
Change in momentum (Δp): Δp = pբ−pᵢ = 0−30000 = −30000kg⋅m/s
Calculate the average force using impulse: J = Δp
\mathbf{F}_{\text{avg}} \Delta t = \Delta \mathbf{p} \mathbf{F}_{\text{avg}} = \frac{\Delta \mathbf{p}}{\Delta t} = \frac{-30000 \, \text{kg} \cdot \text{m/s}}{0.2 \, \text{s}} = -150000 \, \text{N}
(The negative sign indicates the direction of the force is opposite to the initial motion.)