
Describing how Angles and Radii Change with Respect to Each other in a Polar Graph

In polar coordinates, points are defined by a radius r and an angle θ, which describe their distance from the origin and direction relative to the positive x-axis. Understanding how angles and radii change with respect to each other is crucial for analyzing polar graphs. As θ varies, r can grow, shrink, or remain constant, forming curves like circles, spirals, and rose patterns. This relationship illustrates how the radial distance from the origin evolves based on the angle, creating diverse and intricate graph shapes.
Free AP Precalculus Practice Test
Learning Objectives
For the topic "Describing how Angles and Radii Change with Respect to Each Other in a Polar Graph" in AP Precalculus, you should learn how to interpret the relationship between the radius r and angle θ in polar coordinates, analyze various polar equations like circles, spirals, and rose curves, and understand how changes in r affect graph shapes as θ varies. You should also recognize symmetries in polar graphs, convert between polar and Cartesian coordinates, and apply derivatives to explore how radius changes with respect to the angle.
Relationship Between r and θ
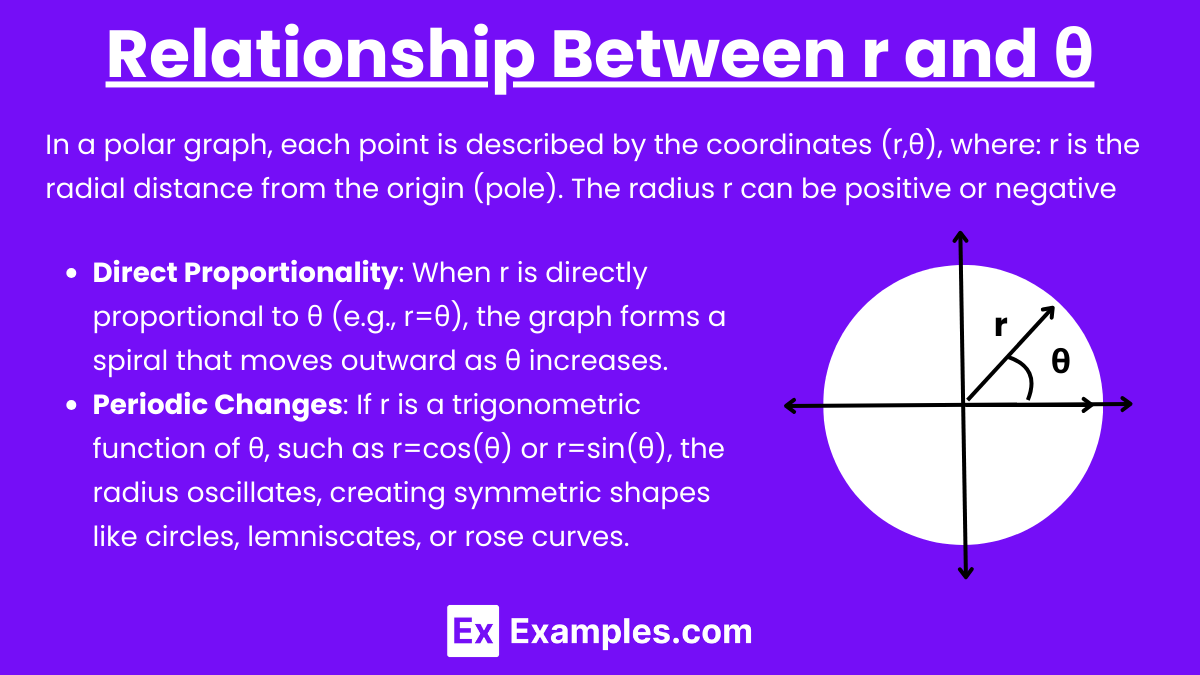
In a polar graph, each point is described by the coordinates (r,θ), where: r is the radial distance from the origin (pole). The radius r can be positive or negative:
θ is the angular displacement from the positive x-axis, measured counterclockwise.
A positive r places the point in the direction of the angle θ.
A negative r reflects the point through the origin, placing it in the direction opposite to θ.
Direct Proportionality: When r is directly proportional to θ (e.g., r=θ), the graph forms a spiral that moves outward as θ increases.
Periodic Changes: If r is a trigonometric function of θ, such as r=cos(θ) or r=sin(θ), the radius oscillates, creating symmetric shapes like circles, lemniscates, or rose curves.
Describing How r Changes with θ
The function r=f(θ) defines the relationship between the radius and the angle.
As θ increases or decreases, the corresponding r changes, leading to the formation of curves.
For example:
Circles: When r is constant (e.g., r=2), the graph is a circle with radius 2 centered at the origin.
Spirals: When r increases or decreases as θ increases (e.g., r=2θ), the graph forms a spiral, showing how the radius grows as the angle expands.
Key Polar Graphs
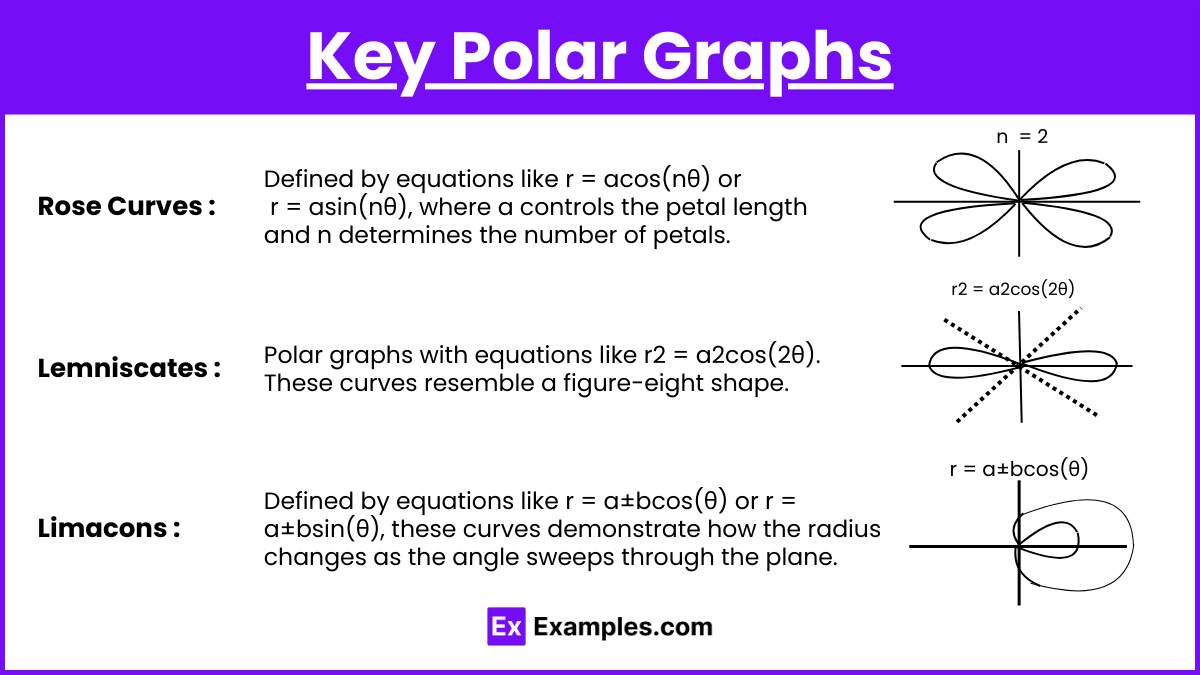
Rose Curves: Defined by equations like r = acos(nθ) or r = asin(nθ), where a controls the petal length and n determines the number of petals. As θ changes, the radius r oscillates, creating petal-like structures.
Lemniscates: Polar graphs with equations like r2 = a2cos(2θ). These curves resemble a figure-eight shape.
Cardioids and Limacons: Defined by equations like r = a±bcos(θ) or r = a±bsin(θ), these curves demonstrate how the radius changes as the angle sweeps through the plane.
Symmetry in Polar Graphs
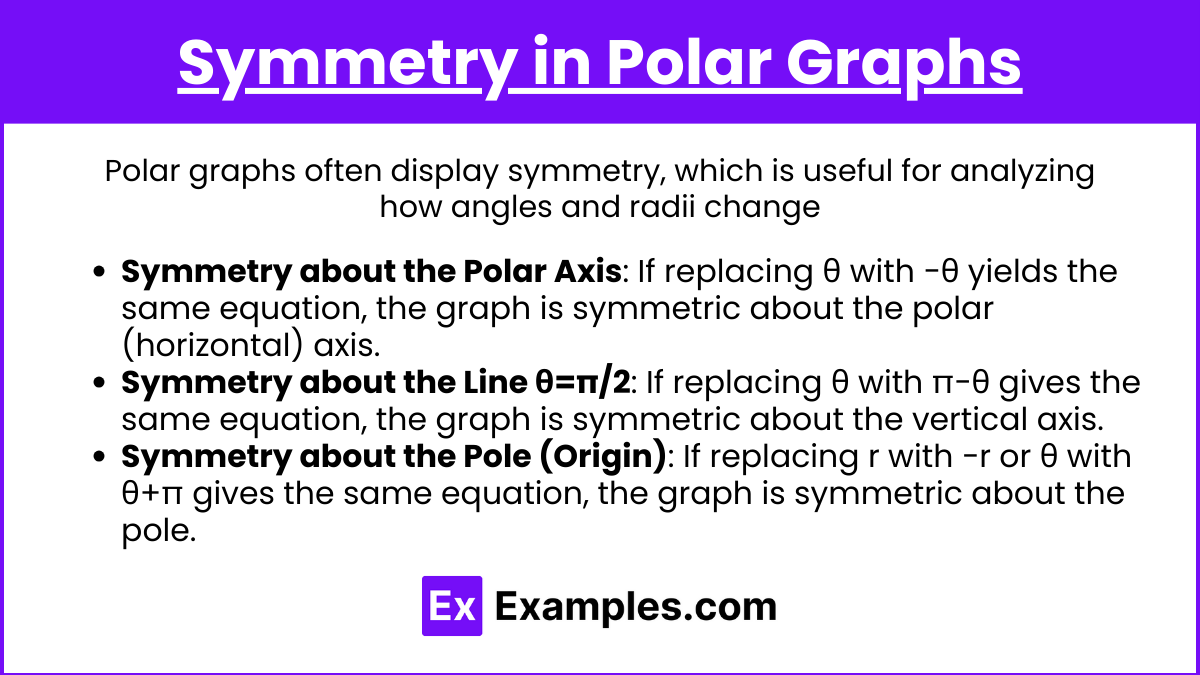
Polar graphs often display symmetry, which is useful for analyzing how angles and radii change:
Symmetry about the Polar Axis: If replacing θ with −θ yields the same equation, the graph is symmetric about the polar (horizontal) axis.
Symmetry about the Line θ=π/2: If replacing θ with π−θ gives the same equation, the graph is symmetric about the vertical axis.
Symmetry about the Pole (Origin): If replacing r with −r or θ with θ+π gives the same equation, the graph is symmetric about the pole.
Converting Between Polar and Cartesian Coordinates:
Sometimes it's helpful to convert between polar and Cartesian coordinates to understand how changes in radius and angle affect the graph:
x=rcos(θ)
y=rsin(θ)
These equations translate the polar system into the Cartesian plane, showing how changes in angle and radius create specific shapes in the xy-plane.
Examples
Example 1. Circle with Constant Radius
In the polar equation r = 4, the radius r remains constant as the angle θ changes. No matter what value θ takes, the radial distance from the origin is always 4 units. As a result, this forms a circle centered at the origin with a fixed radius of 4. The angle θ sweeps around the circle, but the distance from the center remains constant, creating a perfect circle.
Example 2. Spiral
In the polar equation r = θ, the radius r increases as the angle θ increases. For every unit increase in θ, the radius also increases proportionally, leading to a spiral shape. As θ continues to grow, the distance from the origin grows larger, causing the curve to spiral outward indefinitely. This example shows a direct relationship between the angle and the radius, where both grow together.
Example 3. Rose Curve
Consider the polar equation r = 3sin(2θ). In this rose curve, the radius r oscillates between positive and negative values as the angle θ changes. The value of θ controls the number of petals, and for each complete cycle of θ, the radius varies from 0 to 3 and back, creating the petal-like structure of the graph. The symmetry and periodic nature of this curve show how the radius varies in a patterned way as θ progresses.
Example 4. Cardioid
For the equation r=2+2cos(θ), the radius r changes as the angle θ moves through its cycle. When θ = 0, the radius is at its maximum value of 4. As θ increases, the radius decreases, reaching its minimum value of 0 when θ = π. This creates a cardioid shape, which looks like a heart. The relationship between the angle and radius creates a smooth curve with a single cusp at the origin.
Example 5. Lemniscate
The polar equation r2 = 4cos(2θ) creates a lemniscate, which is a figure-eight shape. As the angle θ changes, the radius oscillates between positive and negative values, and when θ equals certain critical values, the radius becomes 0. This creates two lobes, one above and one below the origin. The relationship between the angle and radius forms a symmetric shape, with the radius increasing and decreasing symmetrically on either side of the origin.
Multiple Choice Questions
Question 1
Which of the following equations represents a spiral in polar coordinates?
A) r = 2
B) r = 3+2cos(θ)
C) r = θ
D) r = 2sin(3θ)
Correct Answer: C) r = θ
Explanation:
A spiral in polar coordinates occurs when the radius r increases as the angle θ increases. In the equation r = θ, the radius grows linearly as θ increases, which results in a spiral pattern.
Option A, r = 2, represents a circle with a constant radius of 2.
Option B, r = 3+2cos(θ), represents a limacon, not a spiral.
Option D, r = 2sin(3θ), represents a rose curve with 6 petals (as the n value is 3), not a spiral.
Question 2
A polar graph is symmetric about the line θ=π/2 if which of the following is true?
A) r(θ) = −r(π−θ)
B) r(θ) = r(π+θ)
C) r(θ) = r(π−θ)
D) r(θ) = −r(θ+π)
Correct Answer: C) r(θ)=r(π−θ)
Explanation:
A polar graph is symmetric about the line θ = π/2 if replacing θ with π−θ gives the same equation. This symmetry means that the graph is mirrored about the vertical axis.
Option A describes a condition for symmetry about the origin.
Option B is incorrect because this condition doesn't lead to symmetry about the vertical line.
Option D is incorrect as it also refers to symmetry about the pole, not the line θ = π/2.
Question 3
Which of the following best describes the graph of r = 2+2cos(θ)?
A) A circle with radius 2 centered at the origin
B) A limacon with a loop
C) A rose curve with 4 petals
D) A spiral
Correct Answer: B) A limacon with a loop
Explanation:
The equation r = 2+2cos(θ) describes a limacon with an inner loop. The term 2+2cos(θ) indicates that the graph has a loop because the constant and the coefficient of cos(θ) are equal.
Option A describes a circle, but the given equation is not a circle.
Option C describes a rose curve, but this form typically involves equations like r = acos(nθ) or r = asin(nθ), where n creates petals.
Option D is incorrect because spirals have equations of the form r = aθ.