
Graphing Functions Using Polar Coordinates


 (vertical axis).
 to get key points to plot.
 , which is a circle.
 and leads to the equation (x−2)2+y2 = 4, which is the equation of a circle with center (2,0) and radius 2.
Polar coordinates provide a way to graph functions by defining points based on a distance r from the origin and an angle θ from the positive x-axis. Instead of using x and y coordinates, polar functions are written as r = f(θ). This system is particularly useful for graphing circular and spiral patterns, such as circles, spirals, roses, and lemniscates. Understanding polar graphing allows students to explore a wide variety of curves that are difficult to represent using Cartesian coordinates alone.
Free AP Precalculus Practice Test
Learning Objectives
For "Graphing Functions Using Polar Coordinates" in AP Precalculus, you should focus on understanding how to convert between polar and Cartesian coordinates, identify and graph key polar functions (such as circles, roses, and spirals), and analyze the symmetry of these graphs. Mastering how to plot points in polar form and interpreting polar equations geometrically is essential. Additionally, understanding real-world applications of polar coordinates and practicing converting between coordinate systems will help you solve complex problems and excel in this topic for the exam.
Graphing Functions Using Polar Coordinates
In polar coordinates, each point on the plane is represented by a distance rrr from the origin and an angle θ\thetaθ from the positive x-axis. Polar functions take the form r=f(θ)r = f(\theta)r=f(θ), where the output is the radial distance from the origin for a given angle.
Key Concepts
Polar Coordinates vs. Cartesian Coordinates
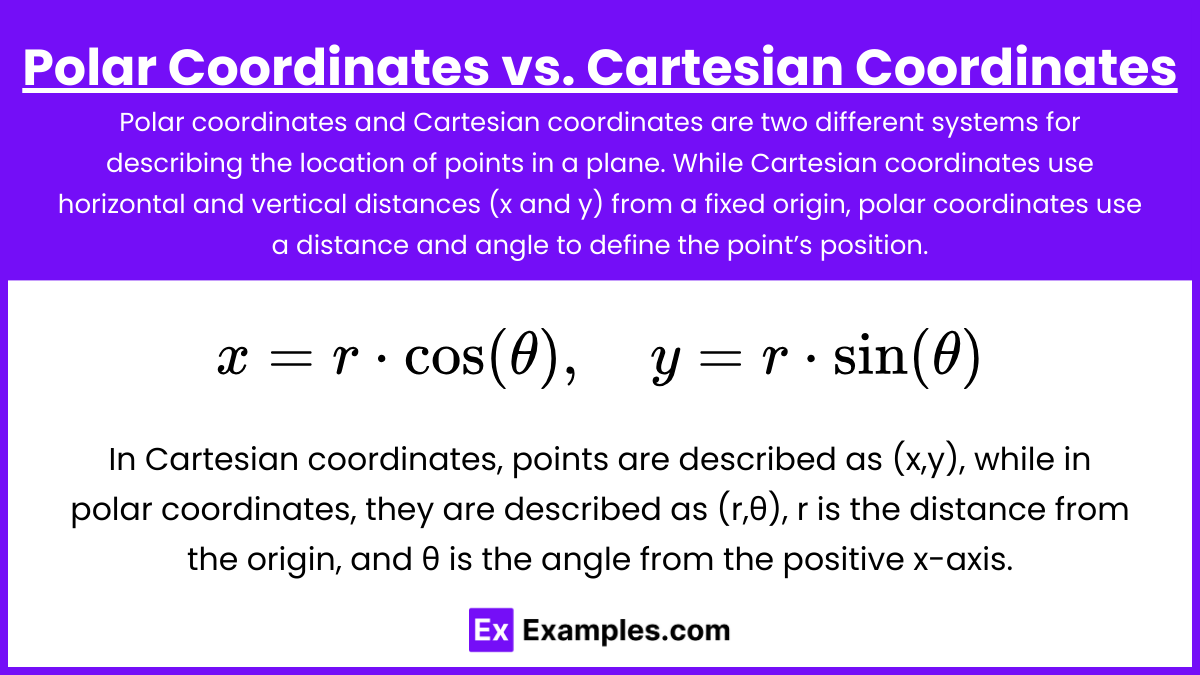
Polar coordinates and Cartesian coordinates are two different systems for describing the location of points in a plane. While Cartesian coordinates use horizontal and vertical distances (x and y) from a fixed origin, polar coordinates use a distance and angle to define the point’s position. Each system has its advantages depending on the situation.
In Cartesian coordinates, points are described as (x,y), while in polar coordinates, they are described as (r,θ), where:
r is the distance from the origin, and θ is the angle from the positive x-axis.
Polar Equations
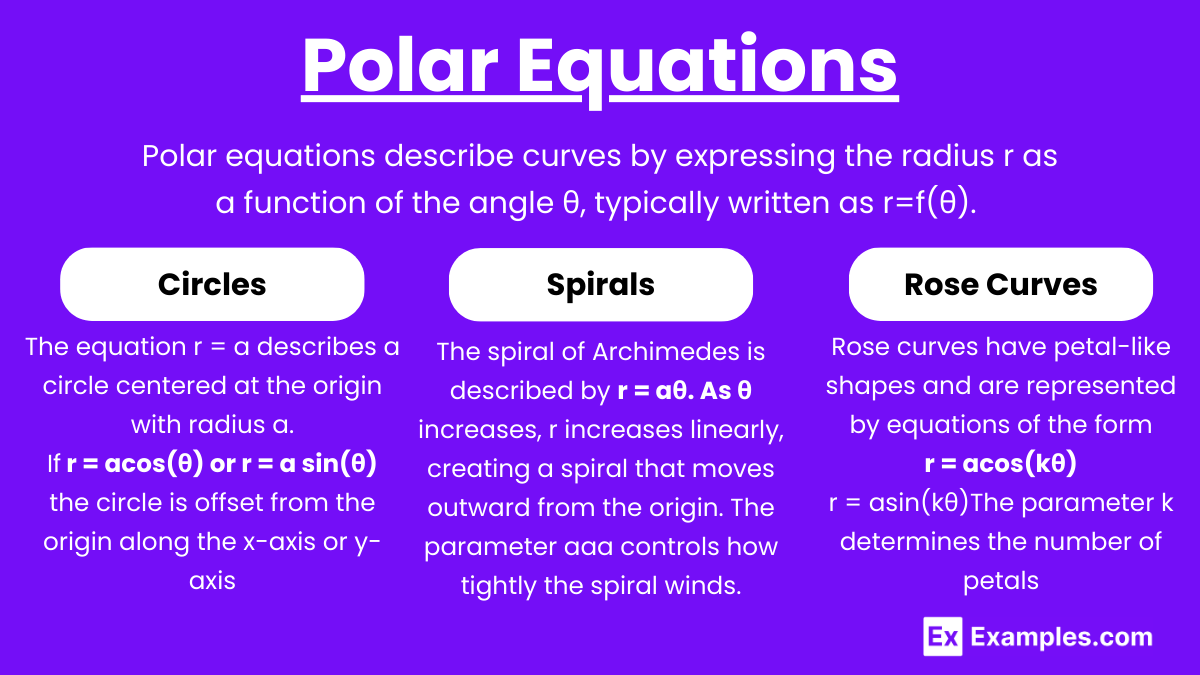
Polar equations describe curves by expressing the radius r as a function of the angle θ, typically written as r=f(θ). Polar coordinates offer a unique way to represent curves that exhibit rotational symmetry, radial patterns, or circular behavior. The polar system simplifies the description of many types of curves that would be more complicated in Cartesian coordinates.
The equation r = f(θ) describes a curve by specifying the radius as a function of the angle.
Common Polar Equations
Circles:
The equation r = a describes a circle centered at the origin with radius a. If r = acos(θ) or r = a sin(θ), the circle is offset from the origin along the x-axis or y-axis, respectively. For instance:
r = a represents a circle centered at the origin.
r = acos(θ) represents a circle with its center at (a/2, 0) and radius a/2.
Spirals:
The spiral of Archimedes is described by r = aθ. As θ increases, r increases linearly, creating a spiral that moves outward from the origin. The parameter aaa controls how tightly the spiral winds. A larger aaa results in a more widely spaced spiral.
Rose Curves:
Rose curves have petal-like shapes and are represented by equations of the form:
r = acos(kθ)
r = asin(kθ)The parameter k determines the number of petals:
If k is an odd integer, the curve will have k petals.
If k is even, the curve will have 2k petals. For example, r = 2cos(3θ) is a rose curve with three petals, while r = 2cos(4θ) has eight petals.
Graphing Polar Functions
1.Symmetry: Check for symmetry in the polar graph. This can help simplify graphing:
Symmetry about the polar axis (horizontal axis).
Symmetry about the line (vertical axis).
Symmetry about the origin.
2.Plot Key Points: Evaluate r at key angles θ to get key points to plot.
3.Smooth Curves: After plotting, sketch smooth curves between the points.
Converting Between Polar and Cartesian
To convert a polar equation r = f(θ) to Cartesian coordinates, use the relationships:
Example: For the polar equation r = 2, the equivalent Cartesian form is , which is a circle.
Applications of Polar Coordinates
Polar coordinates are useful for graphing curves that are naturally circular or spiral, such as planets' orbits or wave patterns.
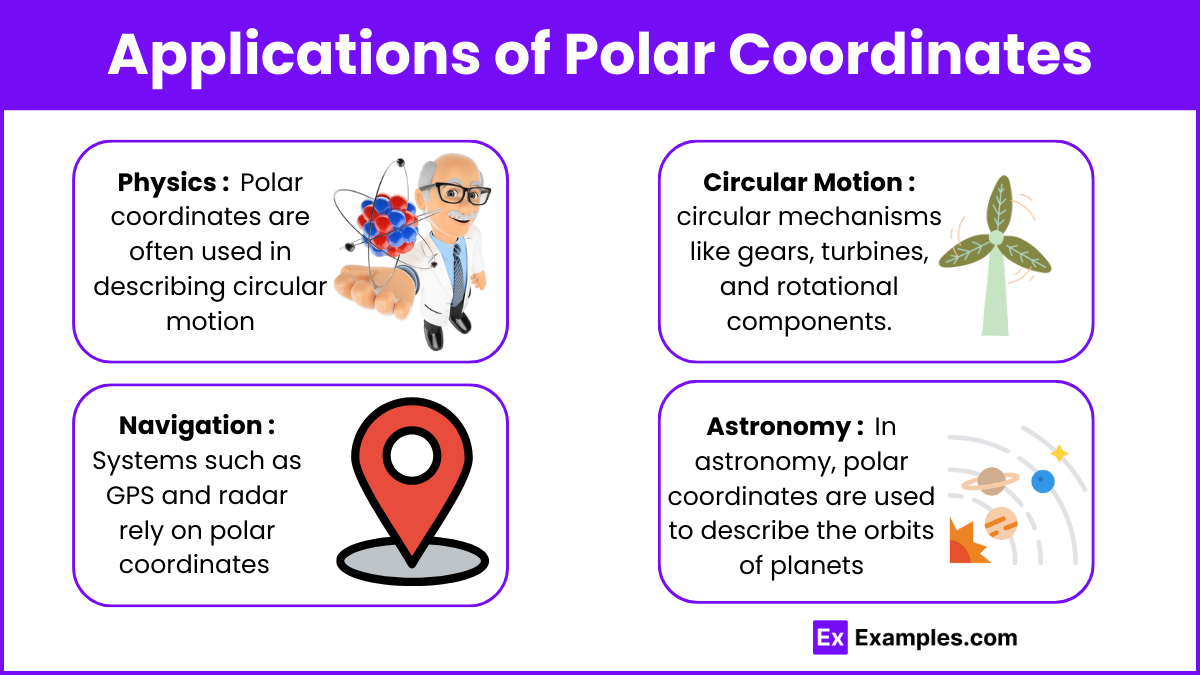
Physics: Polar coordinates are often used in describing circular motion, electromagnetic fields, and waveforms, where the distance from a central point and the angle of rotation are crucial for understanding motion and force fields.
Engineering: Disciplines such as electrical and mechanical engineering frequently use polar coordinates to design circular mechanisms like gears, turbines, and rotational components.
Navigation: Systems such as GPS and radar rely on polar coordinates to determine locations by measuring distances and angles from a central reference point, making them essential for tracking and locating objects.
Astronomy: In astronomy, polar coordinates are used to describe the orbits of planets, moons, and other celestial bodies, simplifying complex orbital paths and allowing for easier analysis of movements in space.
In Precalculus, understanding how to graph these functions helps with visualizing and analyzing complex patterns and relationships in both geometry and trigonometry.
Examples
Example 1: Circle (Simple Constant Function)
A basic example is the equation r = 3. This represents a circle with a radius of 3 units, centered at the origin. For any angle θ, the distance from the origin is constant, forming a perfect circle. This illustrates how constant functions in polar coordinates create circular shapes.
Example 2: Lemniscate (Figure Eight)
The polar equation r2 = 4⋅cos(2θ) describes a lemniscate, or figure-eight shape. This curve passes through the origin and creates two symmetrical lobes, one in the positive r direction and one in the negative, representing how the angle θ influences the radius.
Example 3: Rose Curve (Petaled Pattern)
A rose curve, such as r = 2⋅sin(3θ), produces a flower-like pattern with three petals. The number of petals is determined by the coefficient of θ. For example, when the coefficient is 3, the curve creates a symmetrical pattern with three loops, each corresponding to different angle values.
Example 4: Spiral of Archimedes
The equation r = θ describes a spiral of Archimedes. As the angle θ increases, the radius r also increases proportionally, creating a spiral that moves outward from the origin. This type of graph demonstrates how radial distance can change continuously as the angle increases.
Example 5: Cardioid (Heart-Shaped Curve)
The polar function r = 1+cos(θ) creates a cardioid, a heart-shaped curve. This curve is symmetric about the horizontal axis and has a cusp at the origin. The cardioid demonstrates how combining functions like cosine with a constant can create more complex shapes in polar coordinates.
Multiple Choice Questions
Question 1
In polar coordinates, which of the following equations represents a circle with a radius of 3 centered at the origin?
A) r = 3sin(θ)
B) r = 3
C) r = 3cos(θ)
D) r = 3θ
Answer: B) r = 3
Explanation: In polar coordinates, the equation r = a represents a circle with radius a centered at the origin. Since r=3 means the radius is constantly 3 for all angles θ, this is the equation of a circle. The other equations describe different shapes: r = 3sin(θ) is a circle shifted vertically, and r = 3cos(θ) is a circle shifted horizontally. r =3θ is a spiral.
Question 2
Which of the following functions represents a rose curve with 4 petals?
A) r = 2sin(4θ)
B) r = 2sin(2θ)
C) r = 2cos(2θ)
D) r = 2cos(4θ)
Answer: B) r = 2sin(2θ)
Explanation: Rose curves are of the form r = asin(kθ) or r = acos(kθ), where the number of petals depends on k. If k is even, the curve will have 2k petals, and if k is odd, it will have k petals. Therefore, r = 2sin(2θ) creates a rose with 4 petals. The equation r = 2sin(4θ) would create 8 petals, and r=2cos(2θ) also creates a rose curve with 4 petals but rotated differently.
Question 3
Which of the following is the correct Cartesian equation for the polar equation r = 4cos(θ)?
A) x2+y2 = 16
B) x = 4
C) (x−2)2+y2 = 4
D) (x+2)2+y2 = 16
Answer: C) (x−2)2+y2=4
Explanation: The polar equation r = 4cos(θ) represents a circle. To convert this to Cartesian coordinates, we use the relationships x = rcos(θ) and y = rsin(θ). Substituting r = 4cos(θ) into the polar-to-Cartesian formula gives and leads to the equation (x−2)2+y2 = 4, which is the equation of a circle with center (2,0) and radius 2.