Modeling Change in a Context Using Matrices

Matrices are essential tools for modeling change in real-world contexts, allowing for the representation of systems involving multiple variables and their interactions. In AP Precalculus, matrices are used to model transformations, solve systems of equations, and represent changes in data. Through operations like matrix addition, multiplication, and inverses, matrices simplify complex relationships, making it easier to understand how various elements in a system affect each other. This approach helps to analyze scenarios like population growth, economic trends, and physical transformations efficiently.
Learning Objectives
In “Modeling Change in a Context Using Matrices” for AP Precalculus, you should learn how to represent real-world scenarios using matrices, including modeling transformations, systems of linear equations, and data relationships. You’ll understand matrix operations like addition, multiplication, and inverses, and apply these to model and solve problems involving linear transformations or dynamic systems. Additionally, you should focus on interpreting matrix results in context, connecting mathematical solutions to real-world changes, and using matrices to predict or analyze future outcomes in applied situations.
Matrix Representation of Data and Systems
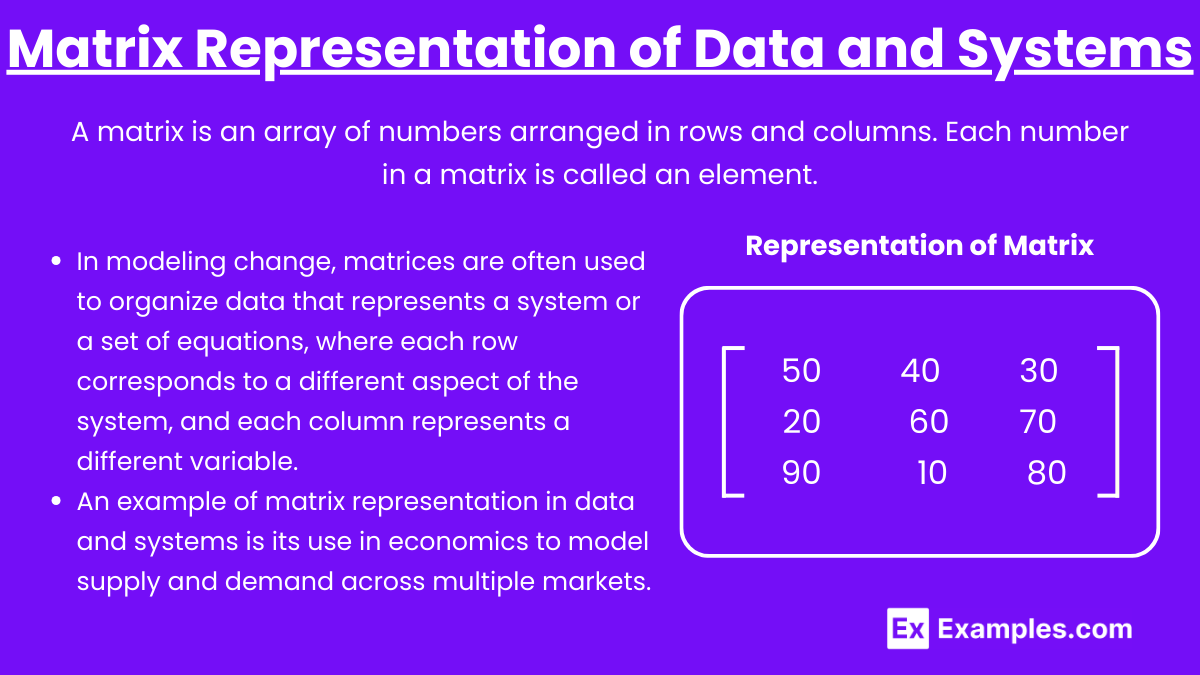
- A matrix is an array of numbers arranged in rows and columns. Each number in a matrix is called an element.
- In modeling change, matrices are often used to organize data that represents a system or a set of equations, where each row corresponds to a different aspect of the system, and each column represents a different variable.
- An example of matrix representation in data and systems is its use in economics to model supply and demand across multiple markets. Suppose we have three different products (A, B, and C) and three different regions (1, 2, and 3). The quantity of each product supplied in each region can be represented in a matrix as follows:
- Example :

Transformations Using Matrices
- Matrices can describe linear transformations such as rotations, reflections, translations, and scaling in geometric contexts.
- A 2×2 matrix can be used to transform vectors in a 2D space. For example, a matrix that scales a figure or rotates it can be applied to the points or vectors defining the object, resulting in a new configuration after the transformation.
Matrix Multiplication and Change Over Time
- When modeling systems that evolve over time, matrix multiplication is used to apply transformations multiple times.
- A system’s state can be represented by a matrix or vector, and by multiplying it with a transformation matrix, you can predict the system’s state after each transformation.
- Example: In economics, matrices are used to model changes in market shares over time, where each matrix multiplication represents one period of change.
Modeling Systems of Equations
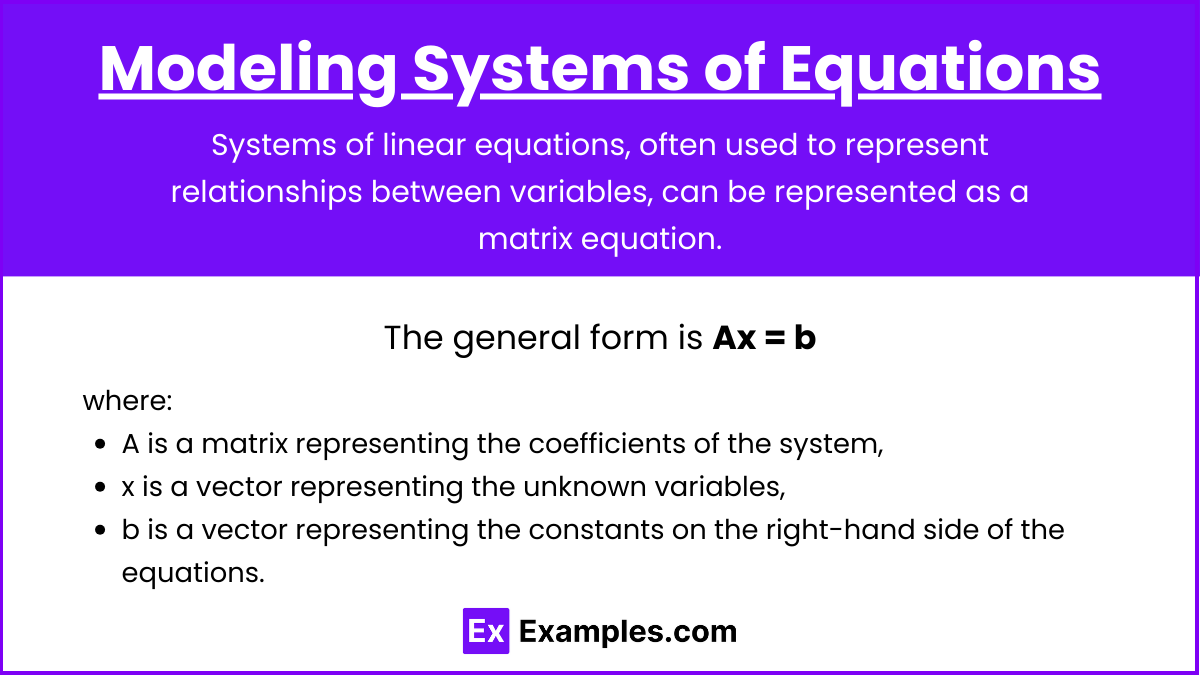
- Systems of linear equations, often used to represent relationships between variables, can be represented as a matrix equation.
- The general form is Ax = b, where:
- A is a matrix representing the coefficients of the system,
- x is a vector representing the unknown variables,
- b is a vector representing the constants on the right-hand side of the equations.
- Matrix operations such as Gaussian elimination or matrix inverses are used to solve for the unknowns, which models the change in the system under different conditions.
Transition Matrices
- Transition matrices are a specific type of matrix used to model change in systems where the probabilities of transitioning from one state to another are involved.
- For example, in population models, a transition matrix can describe how a population evolves over time by moving between different states or groups.
- The entries of the transition matrix represent the probabilities or proportions of moving from one state to another.
Applications of Inverse Matrices
Matrix inverses have many practical applications across different fields, including:
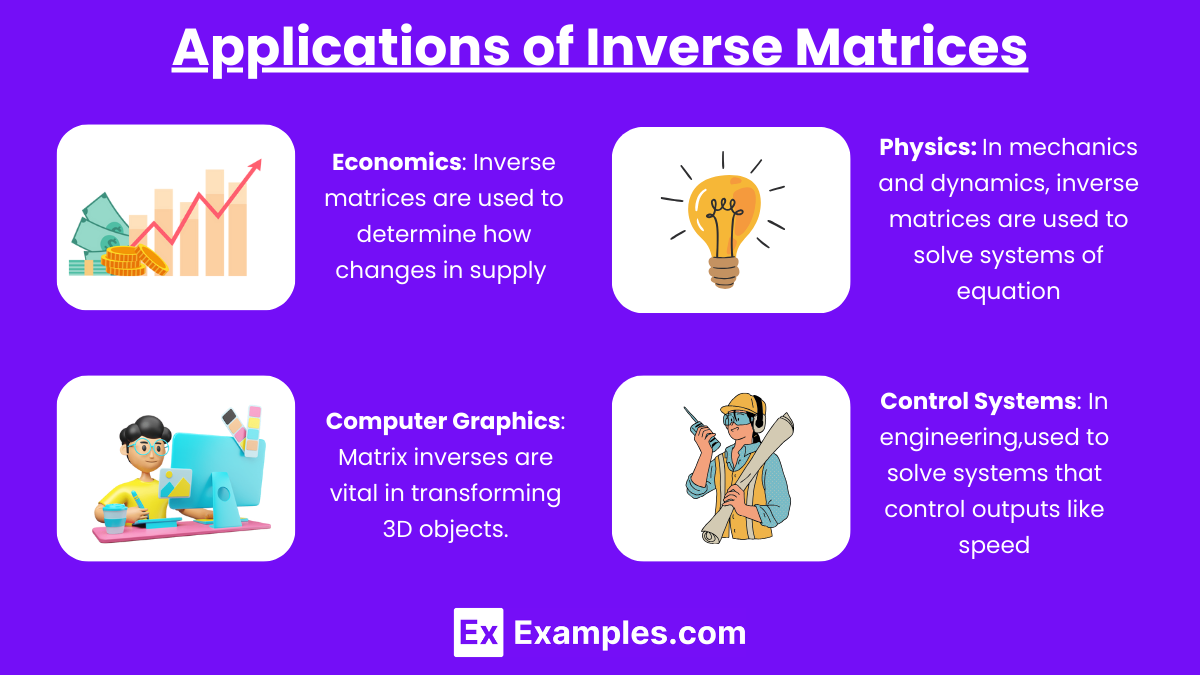
- Economics: In economic modeling, inverse matrices are used to determine how changes in supply and demand affect prices and outputs in interconnected markets. In input-output models, they help in calculating how industries rely on each other.
- Physics: In mechanics and dynamics, inverse matrices are used to solve systems of equations representing forces, accelerations, and velocities. For instance, in kinematic transformations, the inverse matrix can reverse the movement of a rigid body.
- Computer Graphics: Matrix inverses are vital in transforming 3D objects. For example, when applying a series of transformations like scaling, rotation, and translation, the inverse of the transformation matrix is used to undo or reverse these transformations.
- Control Systems: In engineering, the inverse matrix is used to solve systems that control outputs like speed, temperature, and pressure, adjusting them based on input conditions.
Examples
Example 1: Population Growth in Ecology
Matrices can be used to model population changes across different species or age groups in ecology. For example, consider a model where the growth of a population depends on different stages of life (juveniles and adults). A matrix can represent the transition probabilities from one stage to another and help predict how the population will evolve over time.
Example 2: Economic Input-Output Models
In economics, matrices are used to model how different sectors of the economy interact. For example, an input-output matrix can describe the relationship between industries, showing how the output from one industry becomes an input to another. This matrix helps analyze how changes in one sector affect others, modeling the ripple effect of economic shifts.
Example 3: Traffic Flow Management
Matrices can be used to model traffic patterns and predict how changes, like road closures or new routes, will affect the overall flow. A transition matrix might represent how vehicles move between different roads or intersections, and this matrix can be used to predict congestion or optimize traffic lights.
Example 4: Weather Prediction Models
In meteorology, matrices are employed to model changes in weather conditions across different regions. A matrix could represent data on temperature, humidity, and wind speed across multiple locations. By applying transformations to the matrix, meteorologists can predict changes in weather patterns and make forecasts.
Example 5: 3D Graphics and Rotations
In computer graphics, matrices are essential for modeling transformations such as rotations, scaling, and translations of objects in 3D space. For example, a rotation matrix can be used to change the orientation of an object in a simulation or video game. This allows the object to be rotated or transformed in response to user inputs or environmental changes.
Multiple Choice Questions
Question 1
A transformation matrix  is applied to a geometric figure on the coordinate plane. What effect does this matrix have on the figure?
A) It reflects the figure across the x-axis
B) It stretches the figure horizontally by a factor of 2
C) It stretches the figure vertically by a factor of 2
D) It rotates the figure 90 degrees
Answer: B) It stretches the figure horizontally by a factor of 2
Explanation: The transformation matrix represents a horizontal stretch because the x-values are multiplied by 2 while the y-values remain unchanged (multiplied by 1). This causes the figure to stretch along the x-axis without altering the vertical dimension. Reflections, rotations, and vertical stretches require different matrix structures.
Question 2
A company models the production output of two factories using the matrix  , where each entry represents the number of units produced for two different products. If production at both factories is increased by 20%, what matrix operation would be used to find the new output?
A) Matrix addition
B) Matrix multiplication by a scalar
C) Matrix transposition
D) Matrix subtraction
Answer: B) Matrix multiplication by a scalar
Explanation: To increase production at both factories by 20%, you multiply the entire matrix by a scalar value of 1.2 (representing a 20% increase). This scales each element of the matrix, effectively increasing the output for both products at both factories. Matrix addition or subtraction would not apply proportionally, and matrix transposition simply swaps rows and columns without affecting values.
Question 3
Which matrix would be used to scale a figure down by half along both the x- and y-axes?
A) 
B) 
C) 
D) 
Answer: B) (0.5000.5)
Explanation: The matrix scales both the x- and y-coordinates of a figure by a factor of 0.5, effectively reducing its size by half along both axes. This is a uniform scaling transformation. The identity matrix (option A) would leave the figure unchanged, while option C scales up, and option D reflects the figure across the x-axis.