
Modeling Data and Scenarios with Sinusoidal Functions

 .
.


 .
. , so
, so  .
. .
.
In AP Precalculus, modeling data and scenarios with sinusoidal functions involves using sine and cosine functions to represent periodic behaviors. Sinusoidal functions are ideal for modeling phenomena that repeat in regular intervals, such as seasonal temperature changes, sound waves, and tidal patterns. These functions are defined by key parameters: amplitude, period, phase shift, and vertical shift, which allow for precise fitting of real-world data to the function. Mastering this topic helps in understanding and predicting cyclic patterns across various contexts.
Free AP Precalculus Practice Test
Learning Objectives
For "Modeling Data and Scenarios with Sinusoidal Functions" in AP Precalculus, you should focus on understanding how to identify key characteristics of sinusoidal functions, such as amplitude, period, phase shift, and vertical shift, and apply them to model periodic phenomena. You should also learn how to interpret and create sinusoidal models from real-world data, solve for unknowns within these models, and analyze their behavior. Mastery of these skills will help you tackle various AP exam questions involving oscillating and periodic functions.
Sinusoidal Functions
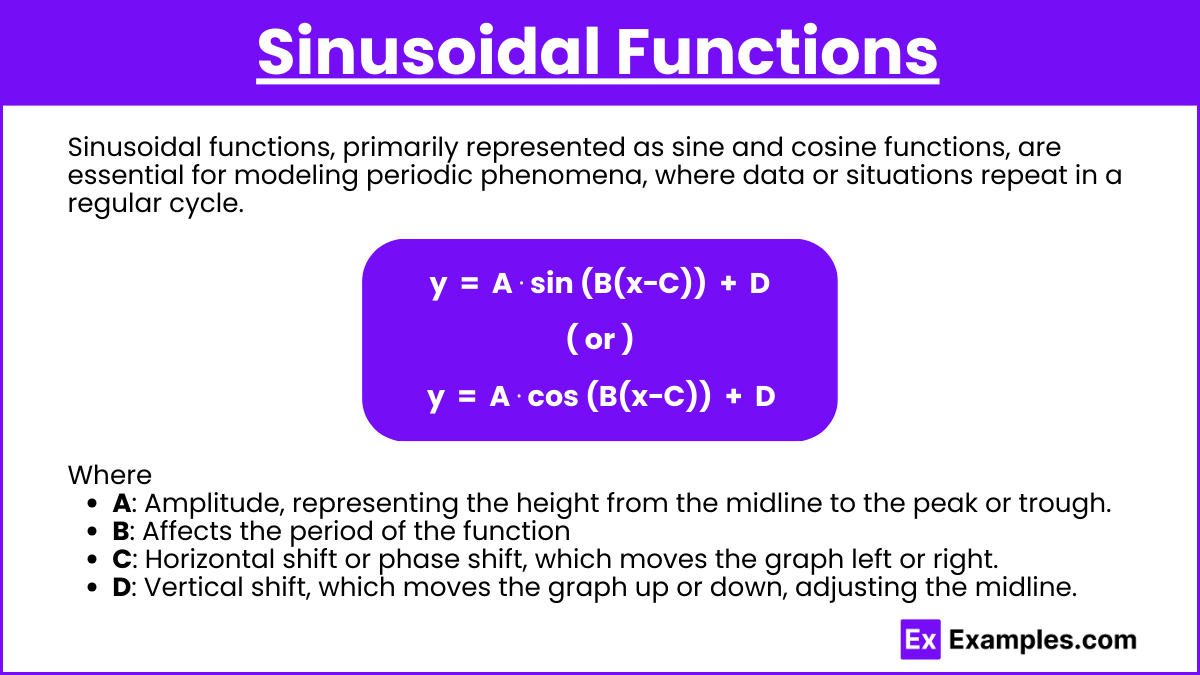
Sinusoidal functions, primarily represented as sine and cosine functions, are essential for modeling periodic phenomena, where data or situations repeat in a regular cycle. These functions are commonly used in scenarios like sound waves, tides, seasonal temperature changes, or other oscillating patterns.General Form of a Sinusoidal Function
A sinusoidal function can be written in the form:
y = A⋅sin(B(x−C)) + D
or
y = A⋅cos(B(x−C)) + D
where:
A: Amplitude, representing the height from the midline (average value) to the peak or trough. It affects the vertical stretch or compression.
B: Affects the period of the function, which determines how long it takes for one full cycle to occur. The period is given by .
C: Horizontal shift or phase shift, which moves the graph left or right.
D: Vertical shift, which moves the graph up or down, adjusting the midline.
Steps for Modeling with Sinusoidal Functions
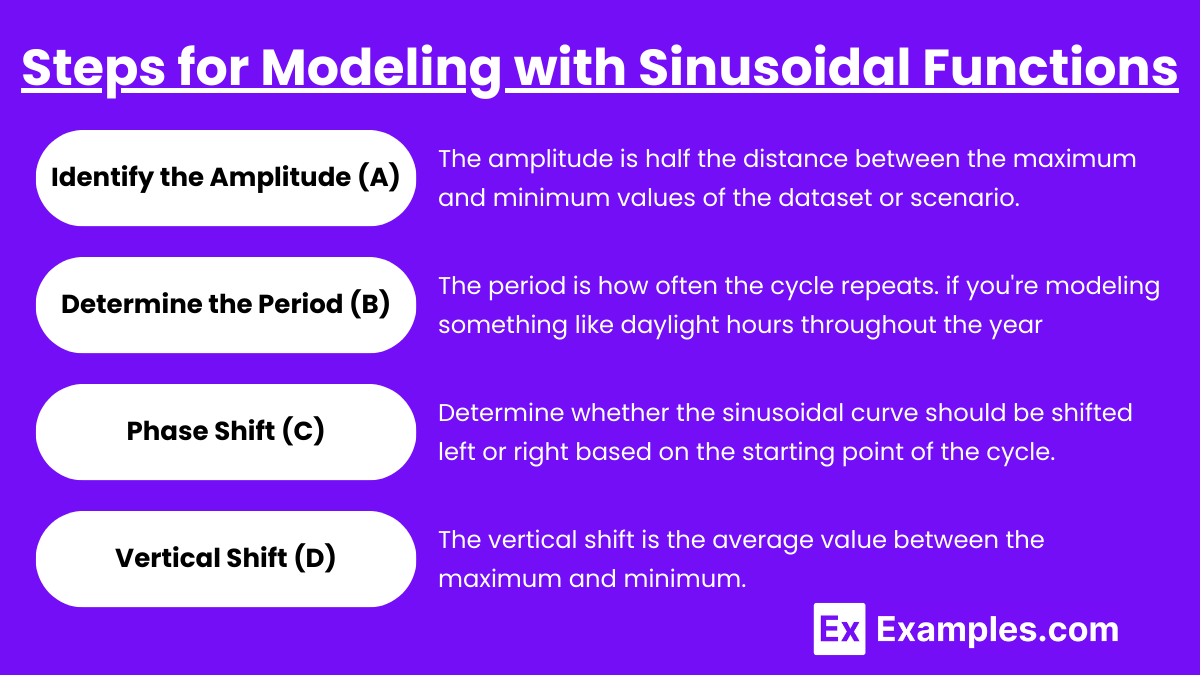
Identify the Amplitude (A):
The amplitude is half the distance between the maximum and minimum values of the dataset or scenario.
Determine the Period (B):
The period is how often the cycle repeats. For example, if you're modeling something like daylight hours throughout the year, the period would be 365 days. To find B, use the formula :
Phase Shift (C):
Determine whether the sinusoidal curve should be shifted left or right based on the starting point of the cycle.
Vertical Shift (D):
The vertical shift is the average value between the maximum and minimum. For example, if you're modeling temperature, this would be the average temperature over a cycle.
Applications in Modeling Real-World Scenarios
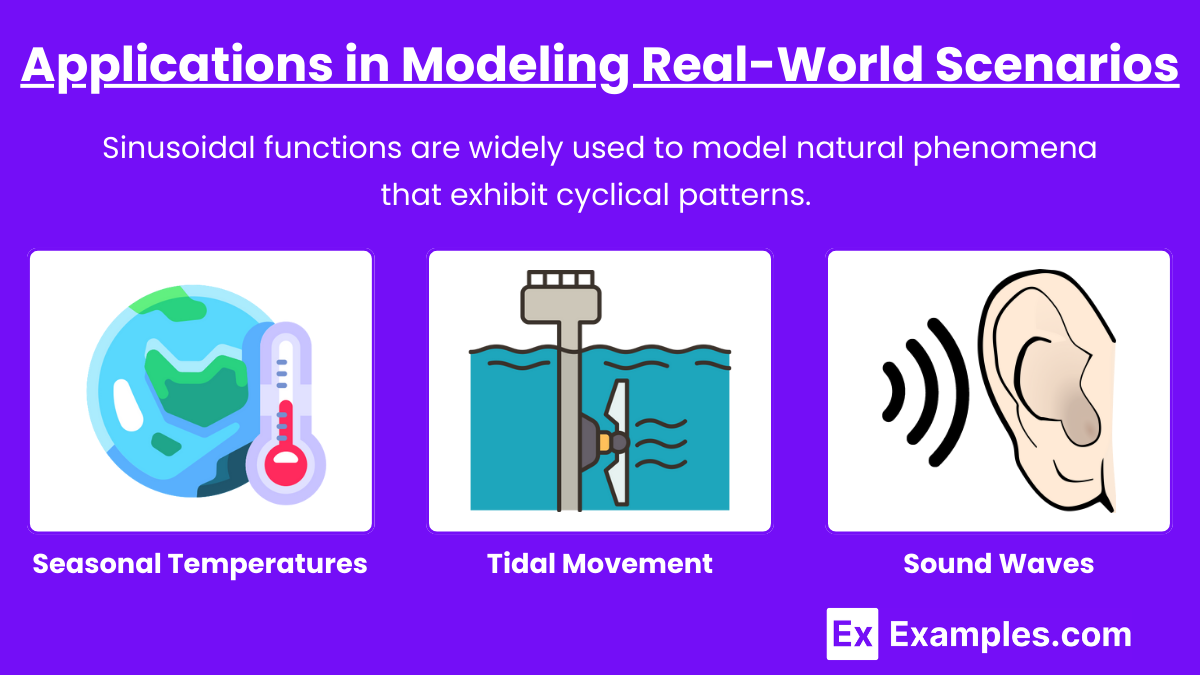
Sinusoidal functions are widely used to model natural phenomena that exhibit cyclical patterns. Here are some common examples:
Seasonal Temperatures: The temperature variation throughout the year can be modeled using a sine or cosine function. The amplitude represents the variation in temperature, while the period is typically 12 months (for yearly cycles). The phase shift accounts for the starting point of the temperature cycle (e.g., hottest month).
Tidal Movement: Tides rise and fall in a regular pattern that can be described using sinusoidal functions. The period corresponds to the time between high tides, while the amplitude represents the height of the tides.
Sound Waves: Sound waves can be modeled using sinusoidal functions, with the frequency representing the pitch and the amplitude representing the loudness.
Examples
Example 1: Daily Temperature Variation
In many regions, temperatures fluctuate throughout the day in a predictable pattern, reaching a maximum during the afternoon and a minimum during the early morning. A sinusoidal function can model this variation by setting the amplitude as half the difference between the maximum and minimum temperatures, the period as 24 hours, and adjusting the phase shift to reflect the time of day when the peak temperature occurs.
Example 2: Tides in Oceanography
Tidal cycles are a classic example of periodic behavior modeled by sinusoidal functions. The height of the ocean’s tides rises and falls predictably due to the gravitational pull of the moon. The amplitude represents the difference between high and low tides, the period reflects the duration between consecutive high tides (about 12.4 hours), and the phase shift can be adjusted depending on the time of high tide.
Example 3: Seasonal Temperature Changes
Over the course of a year, many places experience seasonal temperature variation. This can be modeled using a sinusoidal function where the amplitude is half the difference between the hottest and coldest months, the period is 365 days, and the vertical shift reflects the average yearly temperature. The phase shift can account for the fact that the hottest and coldest months vary by location.
Example 4: Sound Waves
Sound waves are naturally modeled by sinusoidal functions, where the amplitude corresponds to the loudness of the sound, and the frequency (related to the period) represents the pitch. For example, a musical note can be modeled by a sine wave where the frequency of the wave determines its pitch, and the amplitude controls the volume.
Example 5: Daylight Hours Throughout the Year
The number of daylight hours changes throughout the year due to the tilt of the Earth. A sinusoidal function can model this variation, with the amplitude representing the difference between the longest and shortest days, the period being one year, and the vertical shift reflecting the average number of daylight hours. The phase shift accounts for the fact that the longest day occurs around the summer solstice and the shortest around the winter solstice.
Multiple Choice Questions
Question 1
The water depth at a harbor changes throughout the day due to the tides, and this depth can be modeled as a sinusoidal function. The minimum water depth is 2 meters, the maximum water depth is 10 meters, and the period of the cycle is 12 hours. Which of the following is the correct equation to model the water depth as a function of time t (in hours)?
A)
B)
C)
D)
Answer: A
Explanation:
Amplitude (A): The amplitude is half the difference between the maximum and minimum values: .
Period (B): The period is 12 hours. The formula for the period is , so .
Vertical shift (D): The midline is the average of the maximum and minimum values: .
Thus, the correct equation is .
Question 2
A Ferris wheel’s height above the ground can be modeled using a sinusoidal function. The Ferris wheel has a maximum height of 50 meters and a minimum height of 10 meters. If it takes 5 minutes to complete one full revolution, what is the amplitude of the sinusoidal function representing the Ferris wheel’s height?
A) 10 meters
B) 20 meters
C) 30 meters
D) 40 meters
Answer: B
Explanation:
The amplitude of a sinusoidal function is half the difference between the maximum and minimum heights.
Therefore, the amplitude is 20 meters.
Question 3
A temperature in a city oscillates sinusoidally between 20°C and 40°C over a period of 24 hours. At noon, the temperature is at its maximum. What is the phase shift of the sinusoidal function that models this situation?
A) 0 hours
B) 6 hours
C) 12 hours
D) 24 hours
Answer: A
Explanation:
The phase shift determines when the cycle begins. Since the temperature is at its maximum at noon, and the peak of the sine function (or cosine function) occurs at the start of the cycle, there is no need to shift the function horizontally. Therefore, the phase shift is 0 hours.