

Validating a Function Model Using a Residual Plot

Validating a function model using a residual plot is a critical method in determining how well a model fits a set of data. A residual plot displays the differences between the observed and predicted values, helping to identify patterns or inconsistencies in the model. If the residuals are randomly scattered around zero, it indicates a good fit. However, patterns or trends in the residuals suggest that the model may need adjustments. This technique is essential for refining models and ensuring accurate data representation.
Learning Objectives
In studying the topic “Validating a Function Model Using a Residual Plot” for AP Precalculus, you should focus on understanding how to calculate residuals and interpret residual plots. Learn to recognize the significance of randomly scattered residuals versus patterns in the plot, as they indicate the model’s accuracy. Develop skills in identifying systematic errors and understanding when a model needs refinement. Additionally, recognize the importance of detecting outliers and how they influence the model’s validity, ensuring stronger predictions and analysis.
Residual Plot
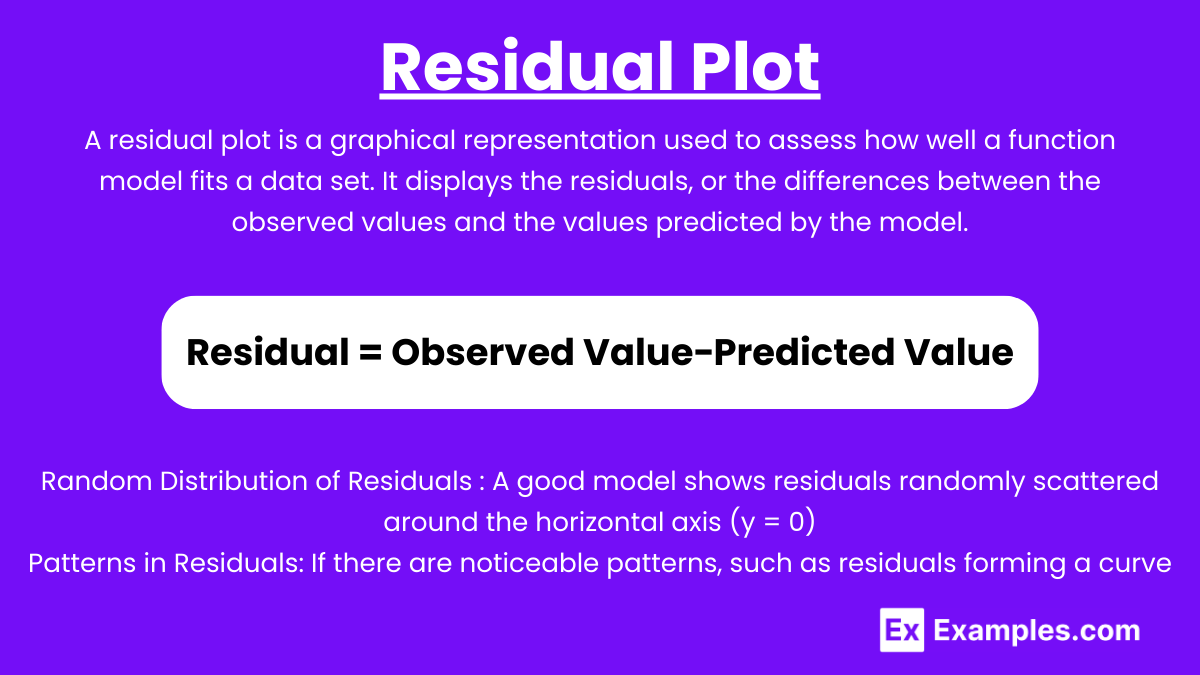
A residual plot is a graphical representation used to assess how well a function model fits a data set. It displays the residuals, or the differences between the observed values and the values predicted by the model. Residuals are calculated as:
Residual = Observed Value−Predicted Value
In a residual plot, the x-axis represents the independent variable (or the predicted values), and the y-axis represents the residuals.
How residual plots help in validating function models
- Random Distribution of Residuals: A good model shows residuals randomly scattered around the horizontal axis (y = 0). This indicates that the model captures the trend in the data and that the errors are randomly distributed.
- Patterns in Residuals: If there are noticeable patterns, such as residuals forming a curve or consistently being above or below the x-axis, the model may not be appropriate. This suggests systematic errors, implying that the model is not capturing certain aspects of the data’s behavior.
- Magnitude of Residuals: Small residuals indicate that the model’s predictions are close to the actual data points. Large residuals suggest that the model is less accurate.
- Outliers: Points that are far from the horizontal axis may be outliers, and they can significantly affect the model’s accuracy.
Steps to Validate Using Residual Plots
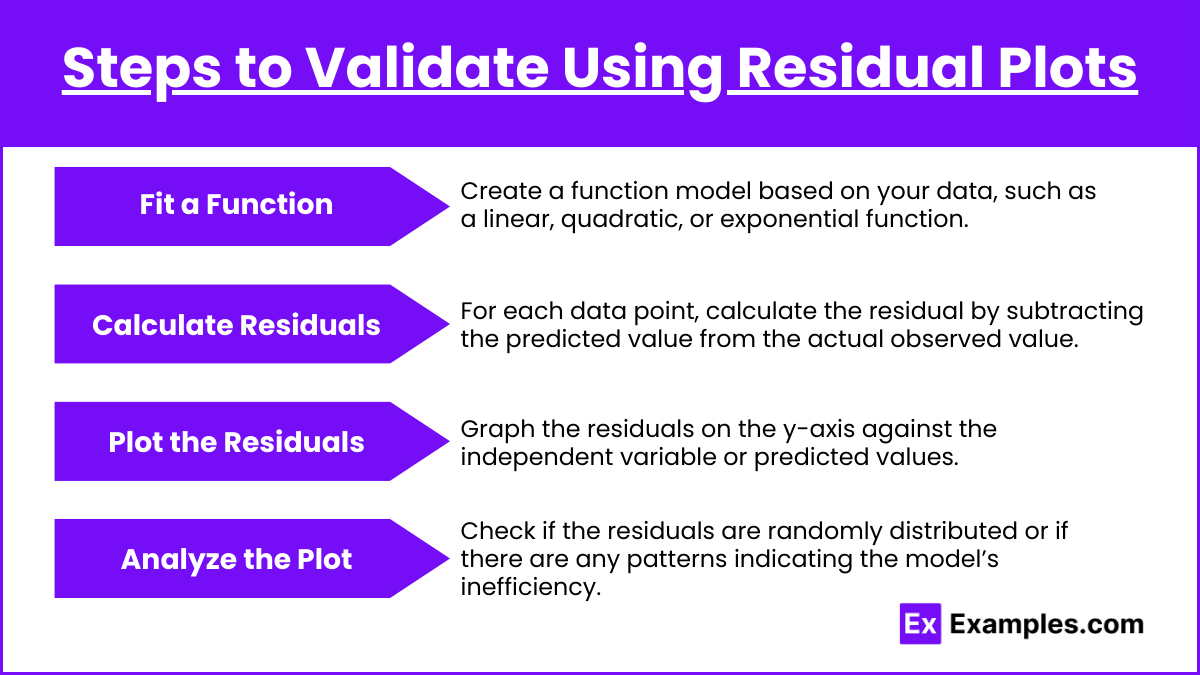
- Fit a Function: Create a function model based on your data, such as a linear, quadratic, or exponential function.
- Calculate Residuals: For each data point, calculate the residual by subtracting the predicted value from the actual observed value.
- Plot the Residuals: Graph the residuals on the y-axis against the independent variable or predicted values.
- Analyze the Plot: Check if the residuals are randomly distributed or if there are any patterns indicating the model’s inefficiency.
Examples
Example 1: Linear Function Model
Suppose you have a data set showing the relationship between hours studied and test scores, and you apply a linear model to predict the test scores. After calculating the residuals and plotting them, you find that the residuals are randomly scattered around zero, with no discernible pattern. This indicates that the linear model is a good fit for the data, as it captures the trend accurately.
Example 2: Quadratic Function Model
Consider a scenario where you’re modeling the trajectory of a ball thrown into the air using a quadratic function. After plotting the residuals, you notice a random distribution of points around the x-axis, with no specific pattern. This validates that the quadratic model appropriately represents the parabolic shape of the ball’s motion and effectively predicts the data.
Example 3: Exponential Function Model
Imagine you’re modeling population growth using an exponential function. After constructing a residual plot, you observe that the residuals form a pattern resembling a curve. This indicates that the exponential model is not capturing the underlying trend properly. The pattern in the residuals suggests a systematic error, and the model may need to be adjusted, possibly considering a logistic model instead.
Example 4: Cubic Function Model
For a data set representing the relationship between temperature and the rate of a chemical reaction, you apply a cubic function model. Upon plotting the residuals, you notice that they cluster around zero with no clear pattern. This suggests that the cubic function is a suitable model, accurately capturing the nuances of the temperature-reaction relationship.
Example 5: Logarithmic Function Model
When modeling the time it takes for a substance to decay as a function of its mass using a logarithmic model, you create a residual plot. The plot shows residuals increasing in magnitude as the mass increases, forming a pattern. This indicates that the logarithmic model may not be appropriate, as the errors grow larger with larger values. You might need to consider a different model to better fit the data.
Multiple Choice Questions
Question 1
What does it indicate if the residuals in a residual plot are randomly scattered around the horizontal axis (y = 0)?
A) The function model is overfitting the data.
B) The function model is underfitting the data.
C) The function model fits the data well.
D) The function model does not account for the outliers.
Answer: C) The function model fits the data well.
Explanation: When residuals are randomly scattered around the horizontal axis (y = 0), it means that the errors between the predicted and observed values are random, with no discernible pattern. This indicates that the function model has captured the overall trend of the data effectively. A good model should have residuals that show no specific structure or systematic bias, confirming that it fits the data well.
Question 2
Which of the following would suggest that a function model does NOT accurately fit the data when analyzing a residual plot?
A) Residuals are close to zero but randomly distributed.
B) Residuals exhibit a clear curved pattern.
C) Residuals are randomly scattered around the x-axis.
D) Residuals are all positive and large.
Answer: B) Residuals exhibit a clear curved pattern.
Explanation: A curved pattern in a residual plot suggests that the model is systematically overestimating or underestimating the values in specific regions, indicating that the model is not capturing the relationship between variables correctly. This could mean that the chosen model (e.g., a linear model) is not appropriate for the data, and a more complex function (e.g., quadratic) may be necessary. Residuals should ideally be randomly distributed without any clear pattern for a well-fitting model.
Question 3
What might large residuals in a residual plot indicate about the model?
A) The model is making predictions that are very close to the observed data points.
B) The model is highly accurate and fits the data well.
C) The model has outliers that significantly affect the predictions.
D) The model is correctly accounting for all variability in the data.
Answer: C) The model has outliers that significantly affect the predictions.
Explanation: Large residuals indicate that the predicted values are far from the observed values, suggesting that there are outliers or data points that the model is not accurately predicting. These outliers can have a large impact on the performance of the model. A model with large residuals may require adjustments, such as handling outliers or choosing a different function type to better represent the data.