
The Application of Research Design and Statistical Analysis in Psychology

Understanding research design and statistical analysis is crucial for interpreting and conducting studies. Research design provides the framework for collecting and analyzing data, with key types including experimental, correlational, and descriptive designs. Statistical analysis helps in summarizing data (descriptive statistics) and making inferences (inferential statistics) about a population based on sample data. Mastery of these concepts is essential for success in AP Psychology, allowing students to critically evaluate psychological research and its findings
Learning Objectives
When studying the application of research design and statistical analysis in psychology, you should learn to understand different research designs (experimental, correlational, descriptive, and quasi-experimental), the principles of hypothesis testing, and the use of statistical methods (descriptive and inferential statistics) to analyze data. This includes grasping concepts such as independent and dependent variables, sampling methods, significance levels, p-values, confidence intervals, and how to interpret and report results to draw valid and reliable conclusions.
Research Design

Research design in psychology refers to the structured plan for collecting, measuring, and analyzing data to investigate hypotheses, including experimental, correlational, and descriptive methodologies.
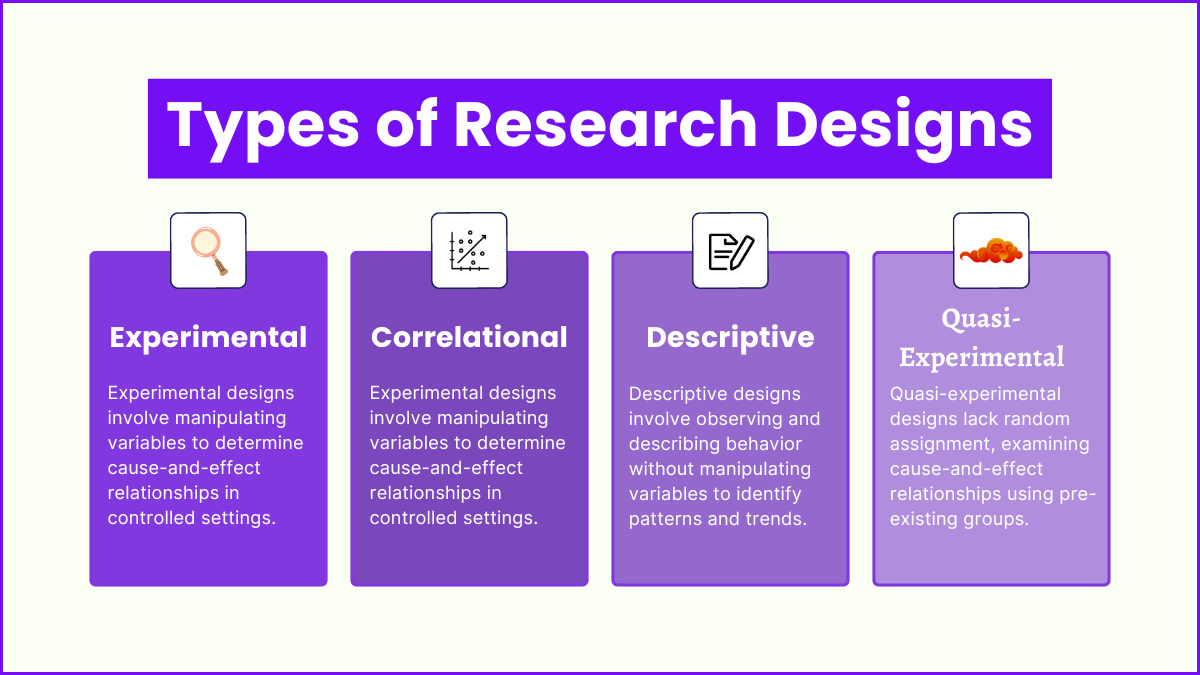
Types of Research Designs
1. Experimental Designs
Definition : Experimental designs are structured approaches in psychological research where one or more independent variables are manipulated to observe the effect on a dependent variable. The primary goal of experimental designs is to establish cause-and-effect relationships by controlling extraneous variables and ensuring that changes in the dependent variable are due to the manipulation of the independent variable.
Key Components of Experimental Designs
- Independent Variable (IV)
- Definition: The variable that is deliberately manipulated by the researcher.
- Example: Type of therapy used in a treatment study (e.g., cognitive-behavioral therapy vs. psychodynamic therapy).
- Dependent Variable (DV)
- Definition: The variable that is measured to assess the effect of the IV.
- Example: Level of anxiety in patients after treatment.
- Control Group
- Definition: A group that does not receive the experimental treatment and is used for comparison.
- Example: Patients receiving a placebo or no treatment.
- Random Assignment
- Definition: The process of randomly assigning participants to different groups to ensure each group is comparable.
- Purpose: To reduce selection bias and increase the validity of the results.
- Control of Extraneous Variables
- Definition: Strategies to ensure that other variables do not influence the outcome.
- Example: Keeping the environment consistent across all experimental conditions.
2. Correlational Designs
Definition : Correlational designs are research methods used in psychology to identify and assess the relationship between two or more variables without manipulating them. Unlike experimental designs, correlational studies do not determine causation but rather describe the strength and direction of associations between variables.
Key Components of Correlational Designs
- Variables
- Definition: Attributes or characteristics that are measured and analyzed to determine if a relationship exists.
- Example: Stress levels and sleep quality.
- Correlation Coefficient
- Definition: A statistical measure that describes the strength and direction of a relationship between two variables.
- Types:
- Positive Correlation: Both variables increase or decrease together (e.g., hours studied and test scores).
- Negative Correlation: One variable increases while the other decreases (e.g., stress levels and sleep quality).
- No Correlation: No predictable relationship between the variables (e.g., shoe size and intelligence).
- Scatterplot
- Definition: A graphical representation of the relationship between two variables.
- Purpose: To visually assess the correlation between variables and identify patterns.
3. Descriptive Designs
Definition : Descriptive designs are research methods used in psychology to systematically describe behaviors, characteristics, and phenomena without manipulating variables. The primary goal is to provide a comprehensive and accurate depiction of the subject under study, often serving as a foundation for further hypothesis-driven research.
Key Components of Descriptive Designs
- Objective Observation
- Definition: Collecting data in a way that is free from researcher bias.
- Example: Recording the frequency of social interactions in a classroom without influencing the behavior of students.
- Detailed Data Collection
- Definition: Gathering extensive and precise information about the subject of study.
- Example: Conducting in-depth interviews to explore individual experiences of depression.
- Contextual Understanding
- Definition: Understanding the context in which the behavior or phenomenon occurs.
- Example: Observing the behavior of children in different playground environments to understand the influence of setting on social interactions.
4. Quasi-Experimental Designs
Definition : Quasi-experimental designs are research methods that resemble experimental designs but lack random assignment to groups. They are used when randomization is impractical or unethical, allowing researchers to infer causality while still controlling for some variables.
Key Components of Quasi-Experimental Designs
- Independent Variable (IV)
- Definition: The variable that is manipulated or categorized to observe its effect.
- Example: Introduction of a new teaching method in a classroom.
- Dependent Variable (DV)
- Definition: The variable that is measured to assess the impact of the IV.
- Example: Students’ test scores after the implementation of the new teaching method.
- Non-Random Assignment
- Definition: Participants are not randomly assigned to conditions or groups.
- Example: Assigning classes rather than individual students to different teaching methods.
- Control of Extraneous Variables
- Definition: Strategies to minimize the influence of variables other than the IV.
- Example: Matching groups on key characteristics such as age or prior academic performance.
Statistical Analysis
Statistical analysis is used to interpret data collected from psychological research, helping to understand patterns and relationships among variables.
Types of Statistical Analysis
1. Descriptive Statistics
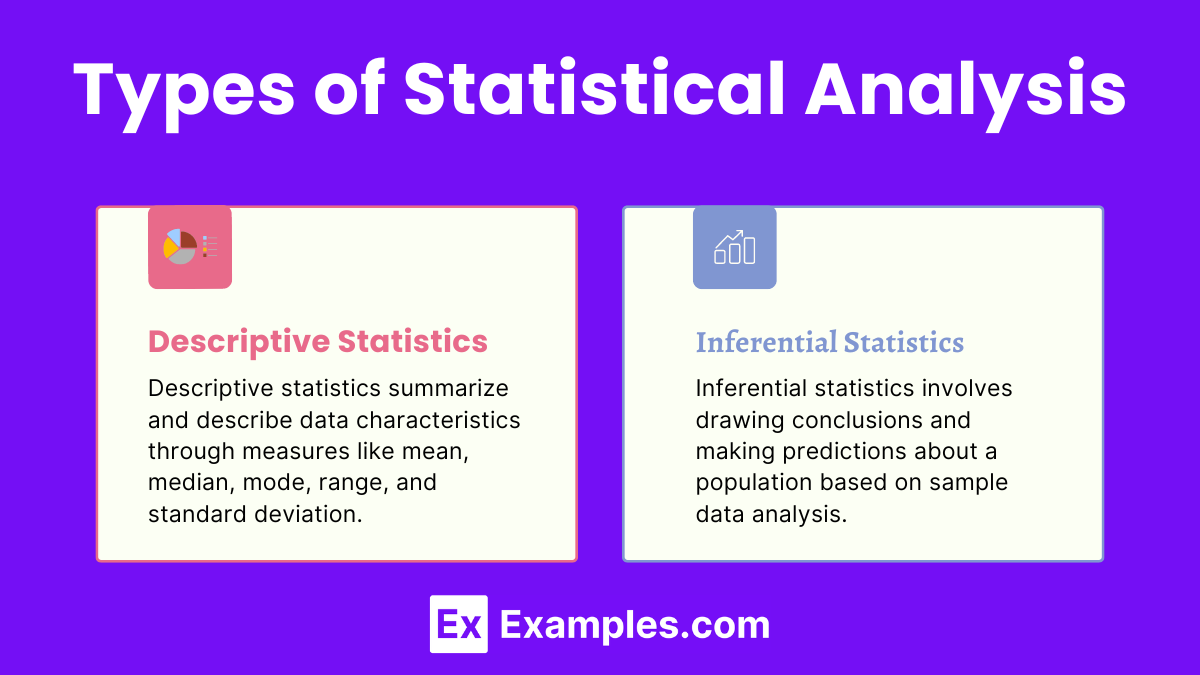
Definition : Descriptive statistics are numerical and graphical methods used to summarize and describe the features of a dataset. They provide a simple overview of the sample and the measures. In psychology, descriptive statistics help researchers understand patterns, central tendencies, and variability within their data.
Key Components of Descriptive Statistics
- Measures of Central Tendency
- Mean: The average of all data points.
- Median: The middle value when data points are arranged in ascending or descending order.
- Mode: The most frequently occurring value in the dataset.
- Measures of Variability
- Range: The difference between the highest and lowest values.
- Variance: The average of the squared differences from the mean.
- Standard Deviation: The square root of the variance, indicating the average distance from the mean.
- Measures of Distribution Shape
- Skewness: The degree to which the distribution of data points is asymmetrical.
- Kurtosis: The sharpness of the peak of a frequency-distribution curve.
- Graphical Representations
- Histograms: Bar graphs representing the frequency distribution of data.
- Bar Charts: Graphs displaying categorical data with rectangular bars.
- Pie Charts: Circular charts divided into sectors representing proportional data.
- Box Plots: Graphs showing the distribution of data based on a five-number summary (minimum, first quartile, median, third quartile, and maximum).
2. Inferential Statistics
Inferential statistics are techniques that allow psychologists to make inferences and draw conclusions about a population based on data collected from a sample. Unlike descriptive statistics, which simply summarize data, inferential statistics help determine whether observed patterns are likely to generalize to the broader population. They are essential for hypothesis testing, making predictions, and determining relationships between variables.
Key Components of Inferential Statistics
- Population and Sample
- Population: The entire group of individuals or instances about whom we hope to learn.
- Sample: A subset of the population selected for study.
- Hypothesis Testing
- Null Hypothesis (H0): A statement that there is no effect or no difference.
- Alternative Hypothesis (H1): A statement that there is an effect or a difference.
- Example: Testing whether a new therapy reduces symptoms of depression compared to no treatment.
- Significance Level (α)
- Definition: The threshold for rejecting the null hypothesis, typically set at 0.05.
- Purpose: To control the probability of making a Type I error (false positive).
- P-Value
- Definition: The probability of obtaining test results at least as extreme as the observed results, assuming the null hypothesis is true.
- Interpretation: If the p-value is less than α, the null hypothesis is rejected.
- Confidence Intervals
- Definition: A range of values that is likely to contain the population parameter with a specified level of confidence, usually 95%.
- Purpose: To estimate the precision of the sample statistic.
Steps in Statistical Analysis
- Data Cleaning: Checking for and handling missing or inconsistent data.
- Descriptive Analysis: Summarizing the main features of the data.
- Hypothesis Testing: Using statistical tests to determine if the data supports the hypothesis.
- Interpretation of Results: Understanding the implications of the findings.
- Reporting Findings: Presenting results in tables, graphs, and reports.
Importance of Research Design and Statistical Analysis
- Validity and Reliability: Ensuring the accuracy and consistency of research findings.
- Ethical Research Practices: Upholding ethical standards and protecting participants.
- Generalization of Results: Enhancing the applicability of findings to broader populations.
- Advancement of Knowledge: Contributing to the understanding and development of psychological theories and practices.