AP® Statistics Cheat Sheet

At examples.com, we provide a comprehensive AP Statistics cheat sheet covering essential topics like probability, sampling distributions, and regression models, designed to help students excel in their exams.
Free AP Statistics Practice Test
Download AP Statistics Cheat sheet – Pdf
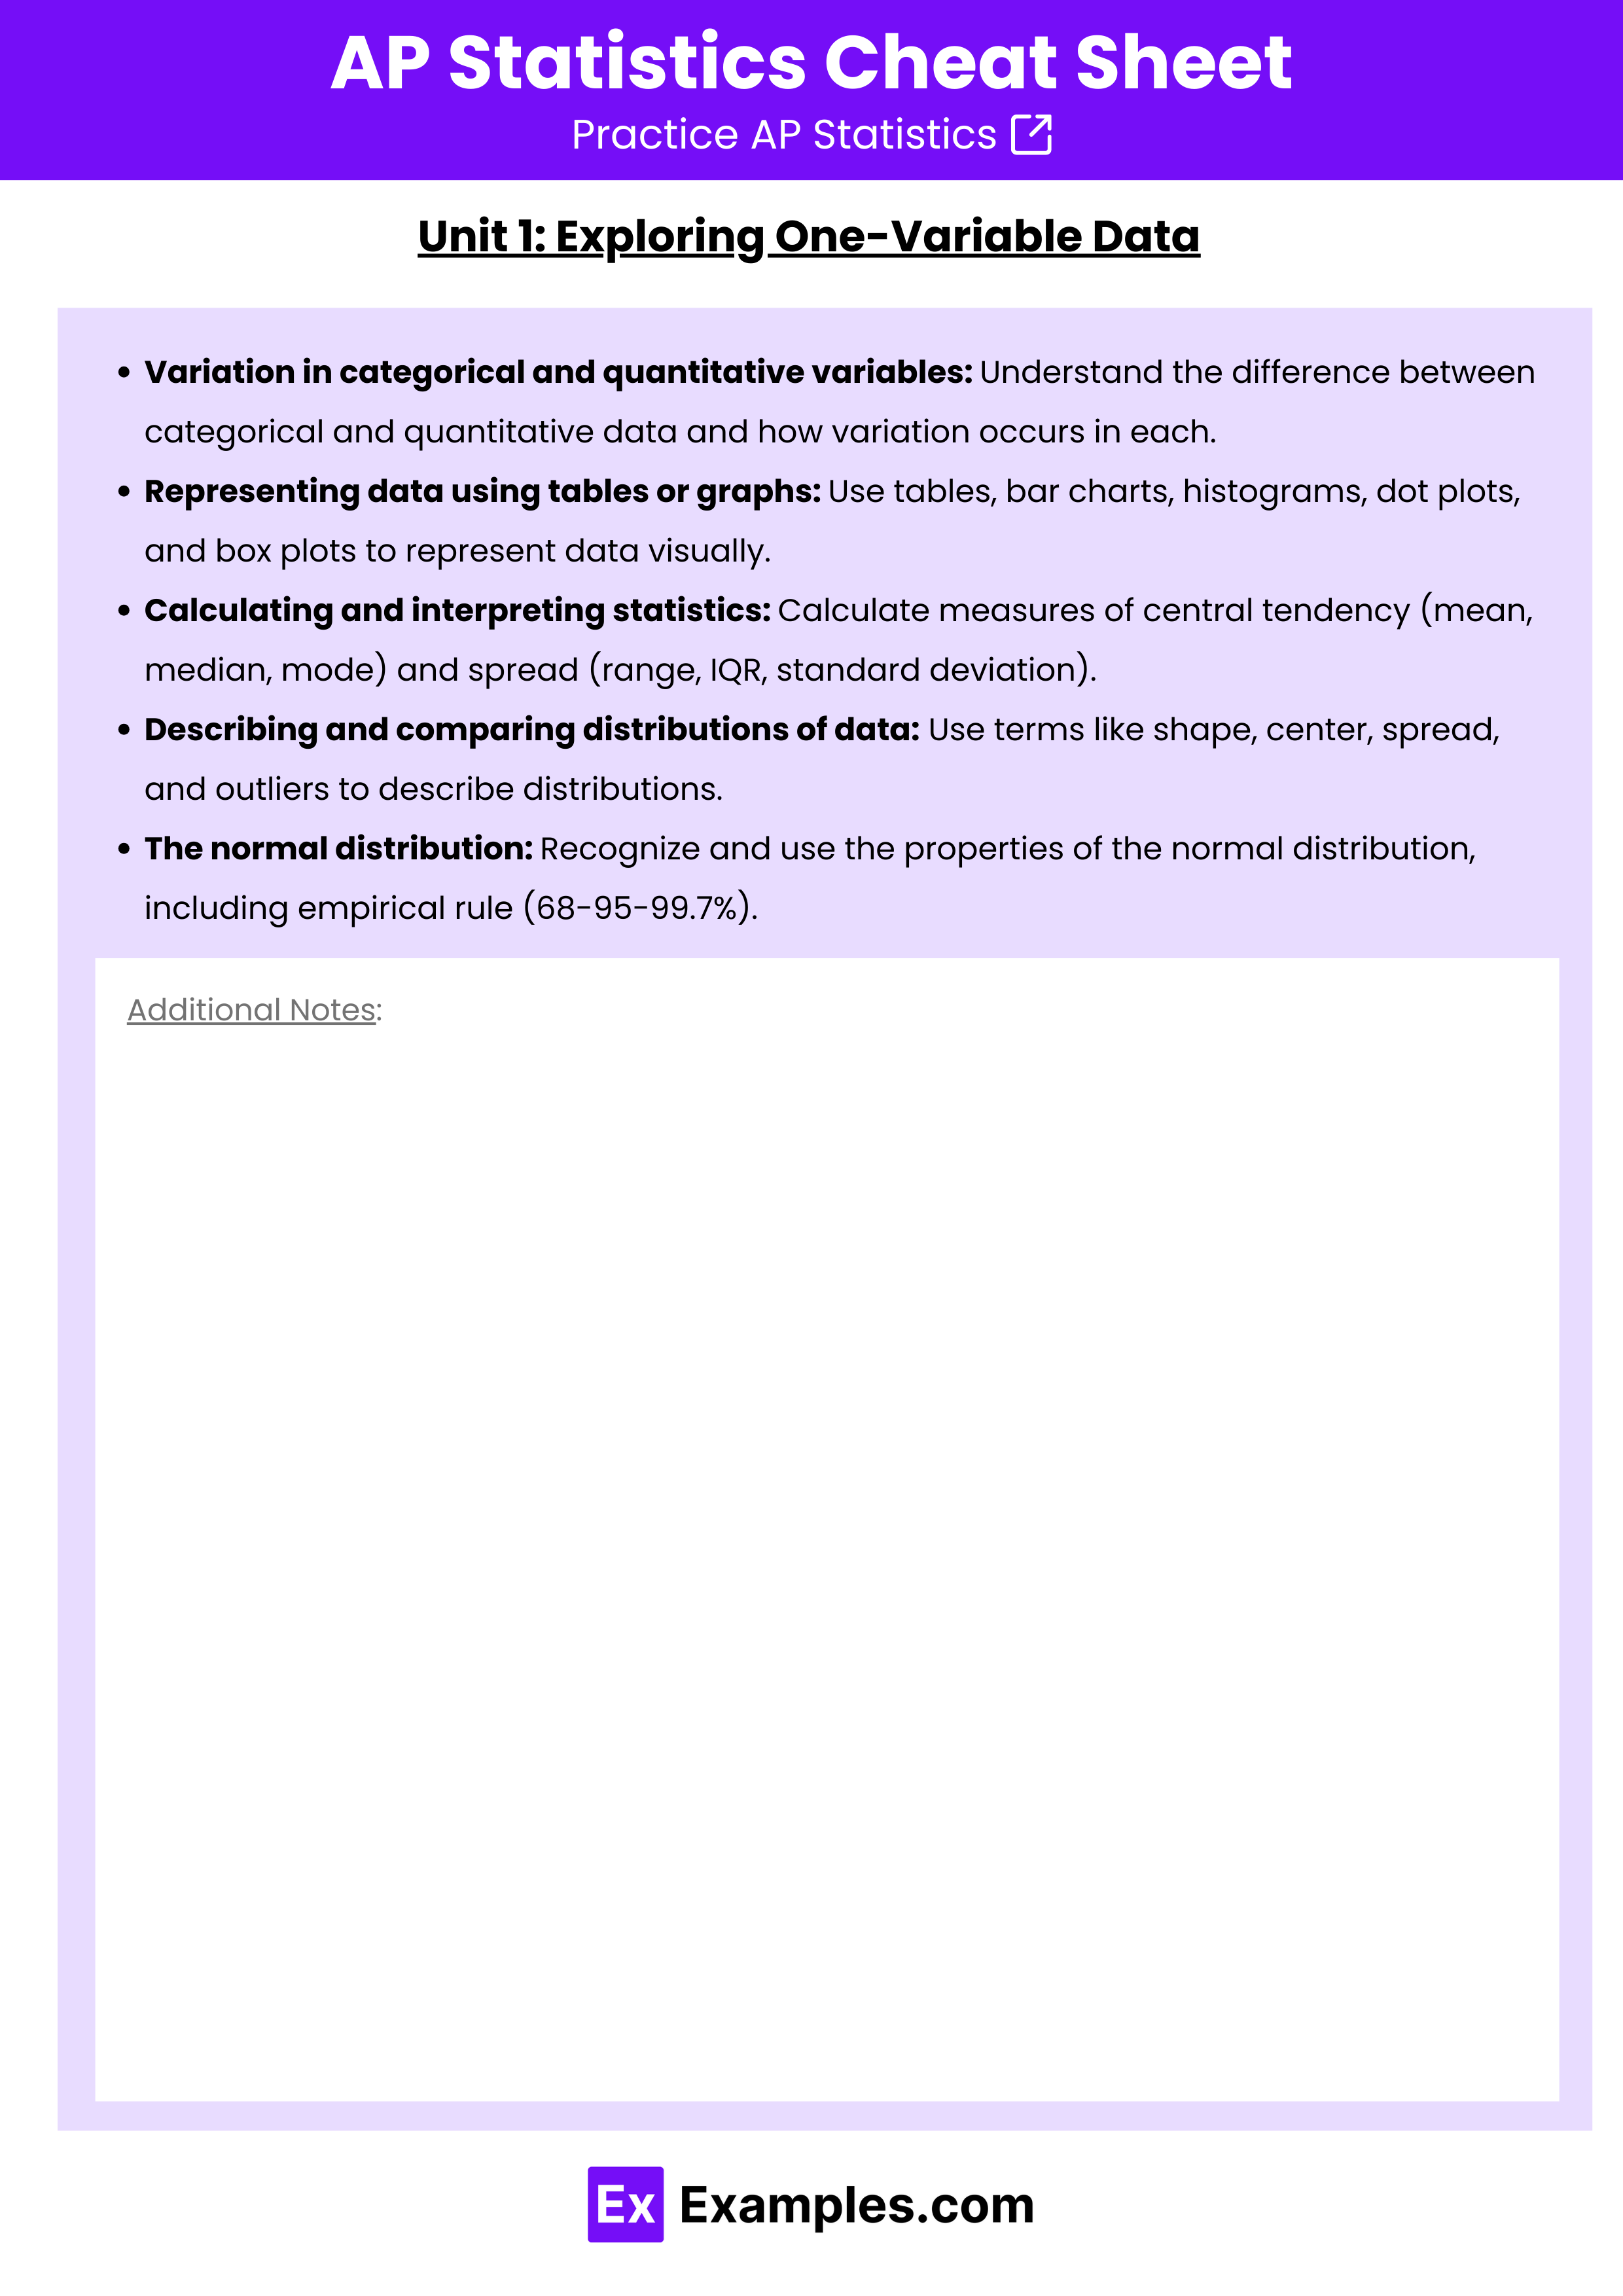
Unit 1: Exploring One-Variable Data
- Variation in categorical and quantitative variables: Understand the difference between categorical and quantitative data and how variation occurs in each.
- Representing data using tables or graphs: Use tables, bar charts, histograms, dot plots, and box plots to represent data visually.
- Calculating and interpreting statistics: Calculate measures of central tendency (mean, median, mode) and spread (range, IQR, standard deviation).
- Describing and comparing distributions of data: Use terms like shape, center, spread, and outliers to describe distributions.
- The normal distribution: Recognize and use the properties of the normal distribution, including empirical rule (68-95-99.7%).
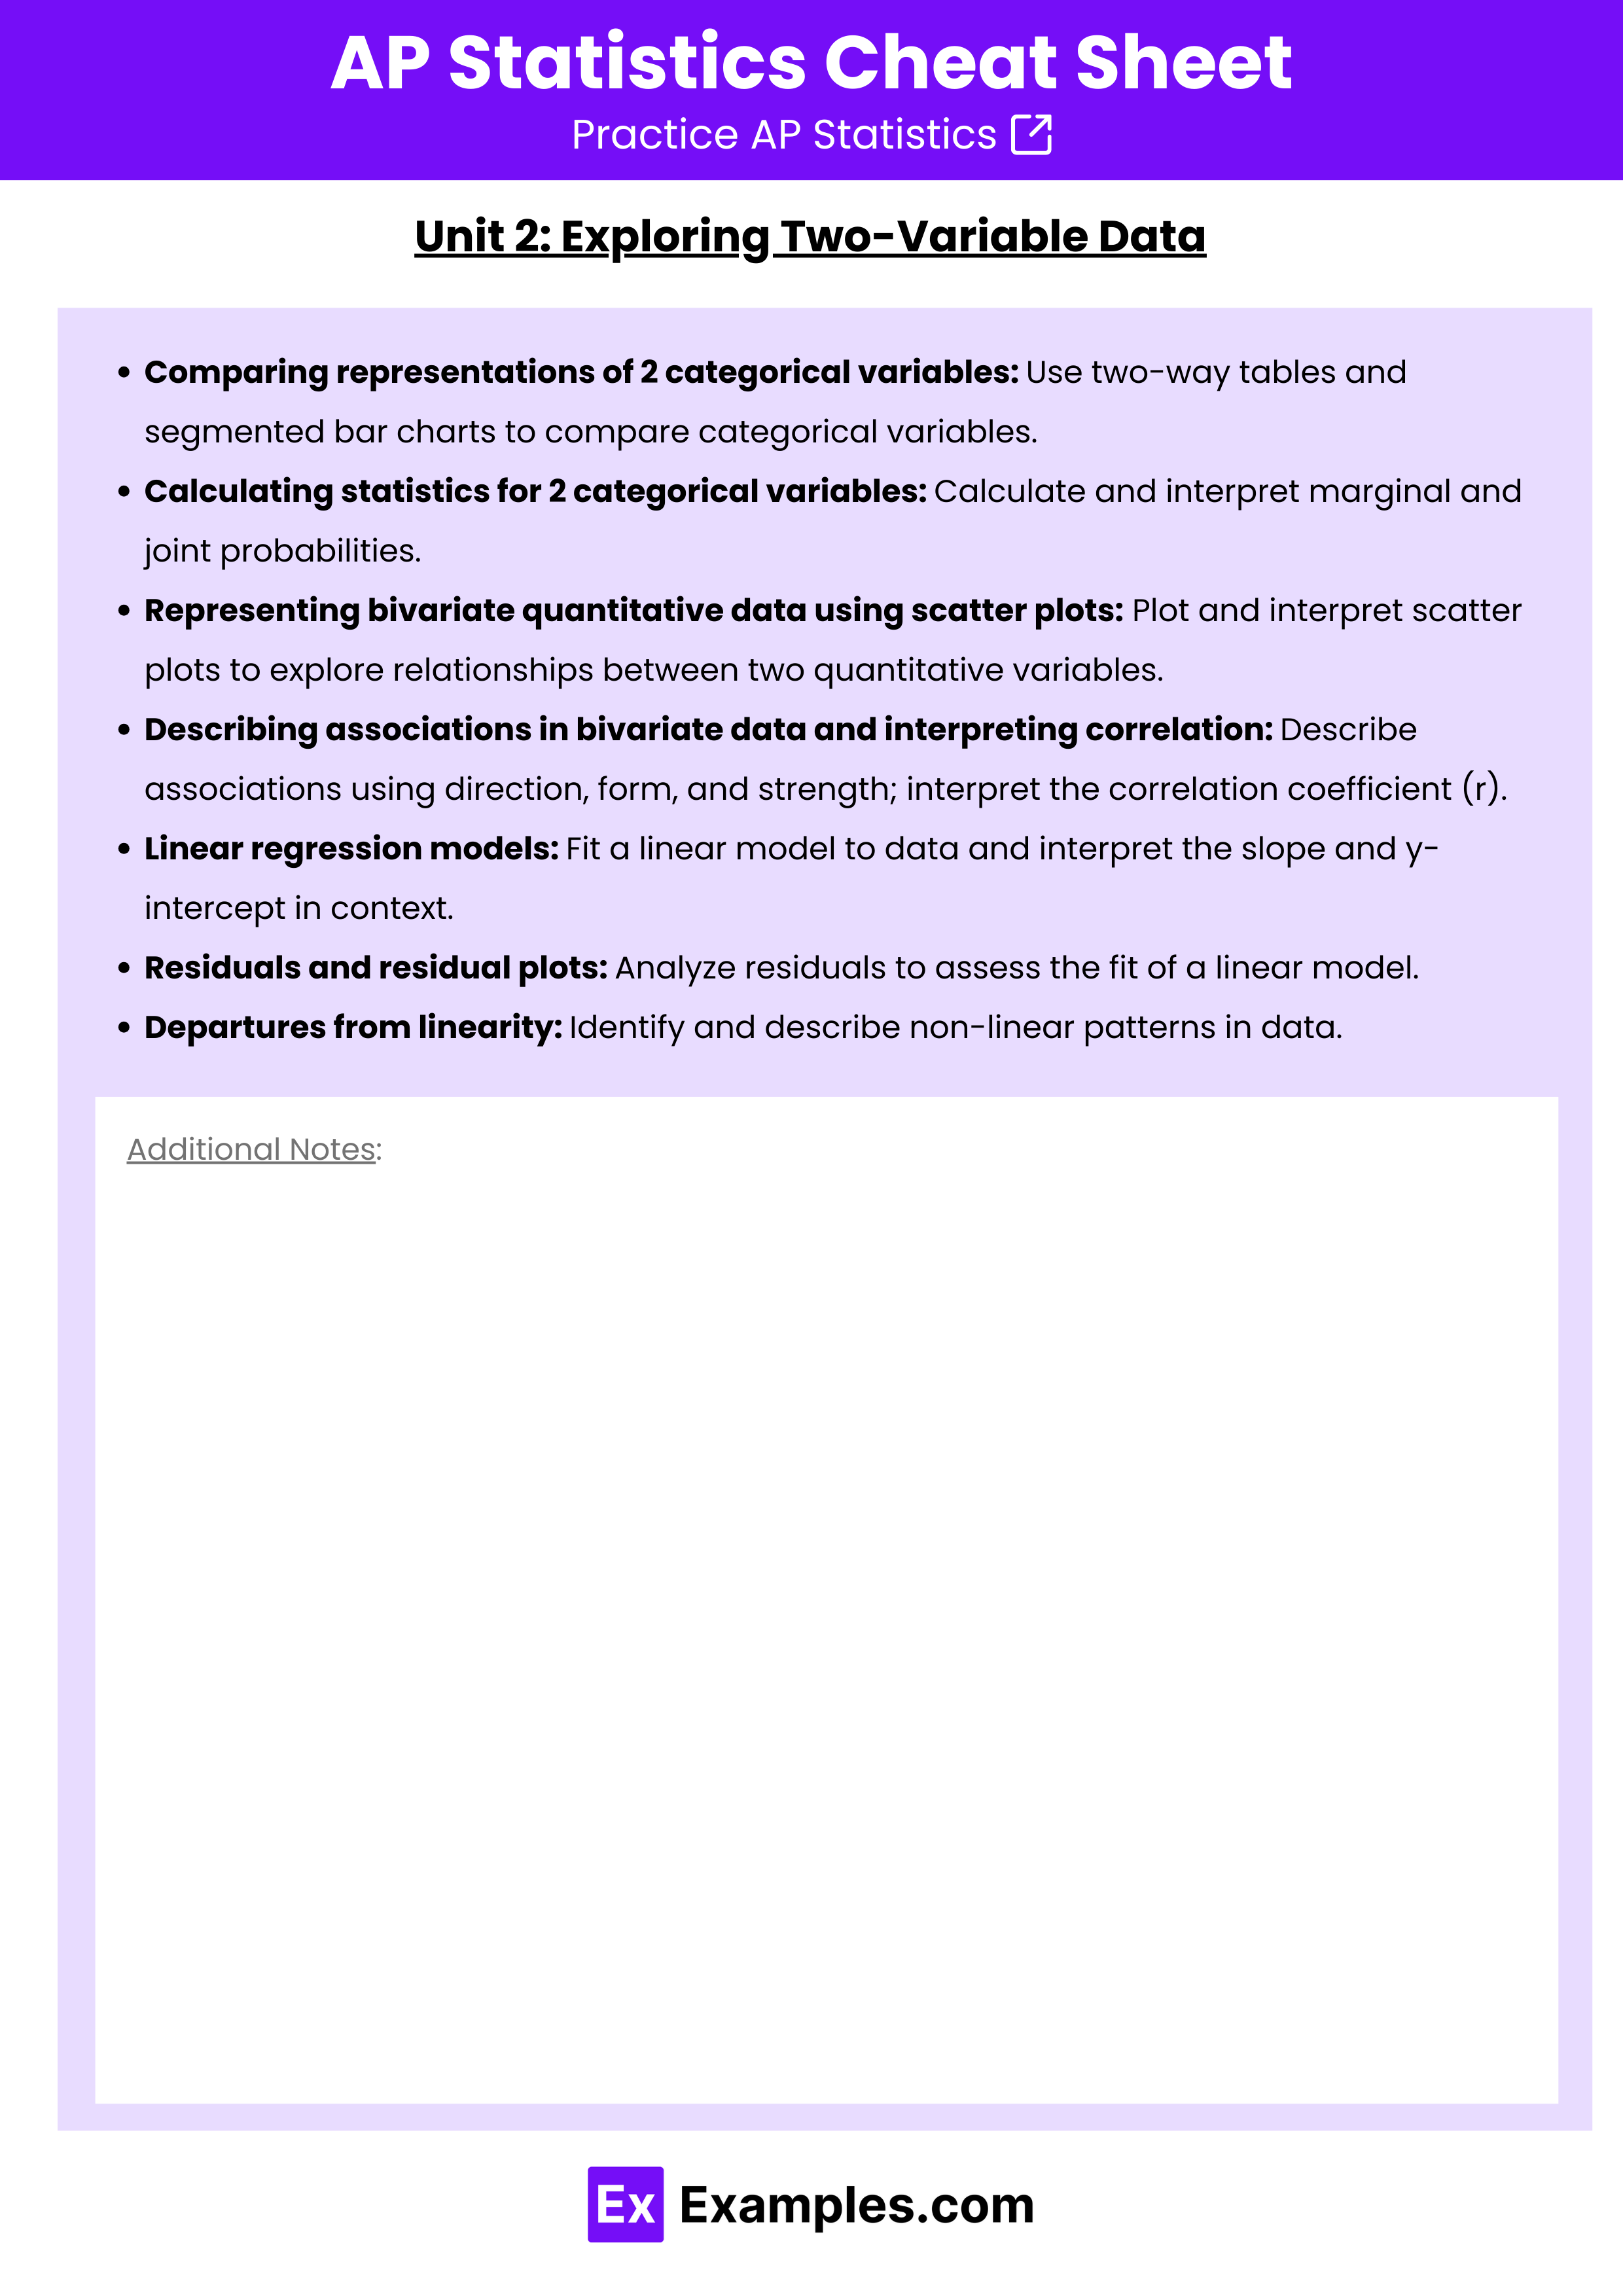
Unit 2: Exploring Two-Variable Data
- Comparing representations of 2 categorical variables: Use two-way tables and segmented bar charts to compare categorical variables.
- Calculating statistics for 2 categorical variables: Calculate and interpret marginal and joint probabilities.
- Representing bivariate quantitative data using scatter plots: Plot and interpret scatter plots to explore relationships between two quantitative variables.
- Describing associations in bivariate data and interpreting correlation: Describe associations using direction, form, and strength; interpret the correlation coefficient (r).
- Linear regression models: Fit a linear model to data and interpret the slope and y-intercept in context.
- Residuals and residual plots: Analyze residuals to assess the fit of a linear model.
- Departures from linearity: Identify and describe non-linear patterns in data.
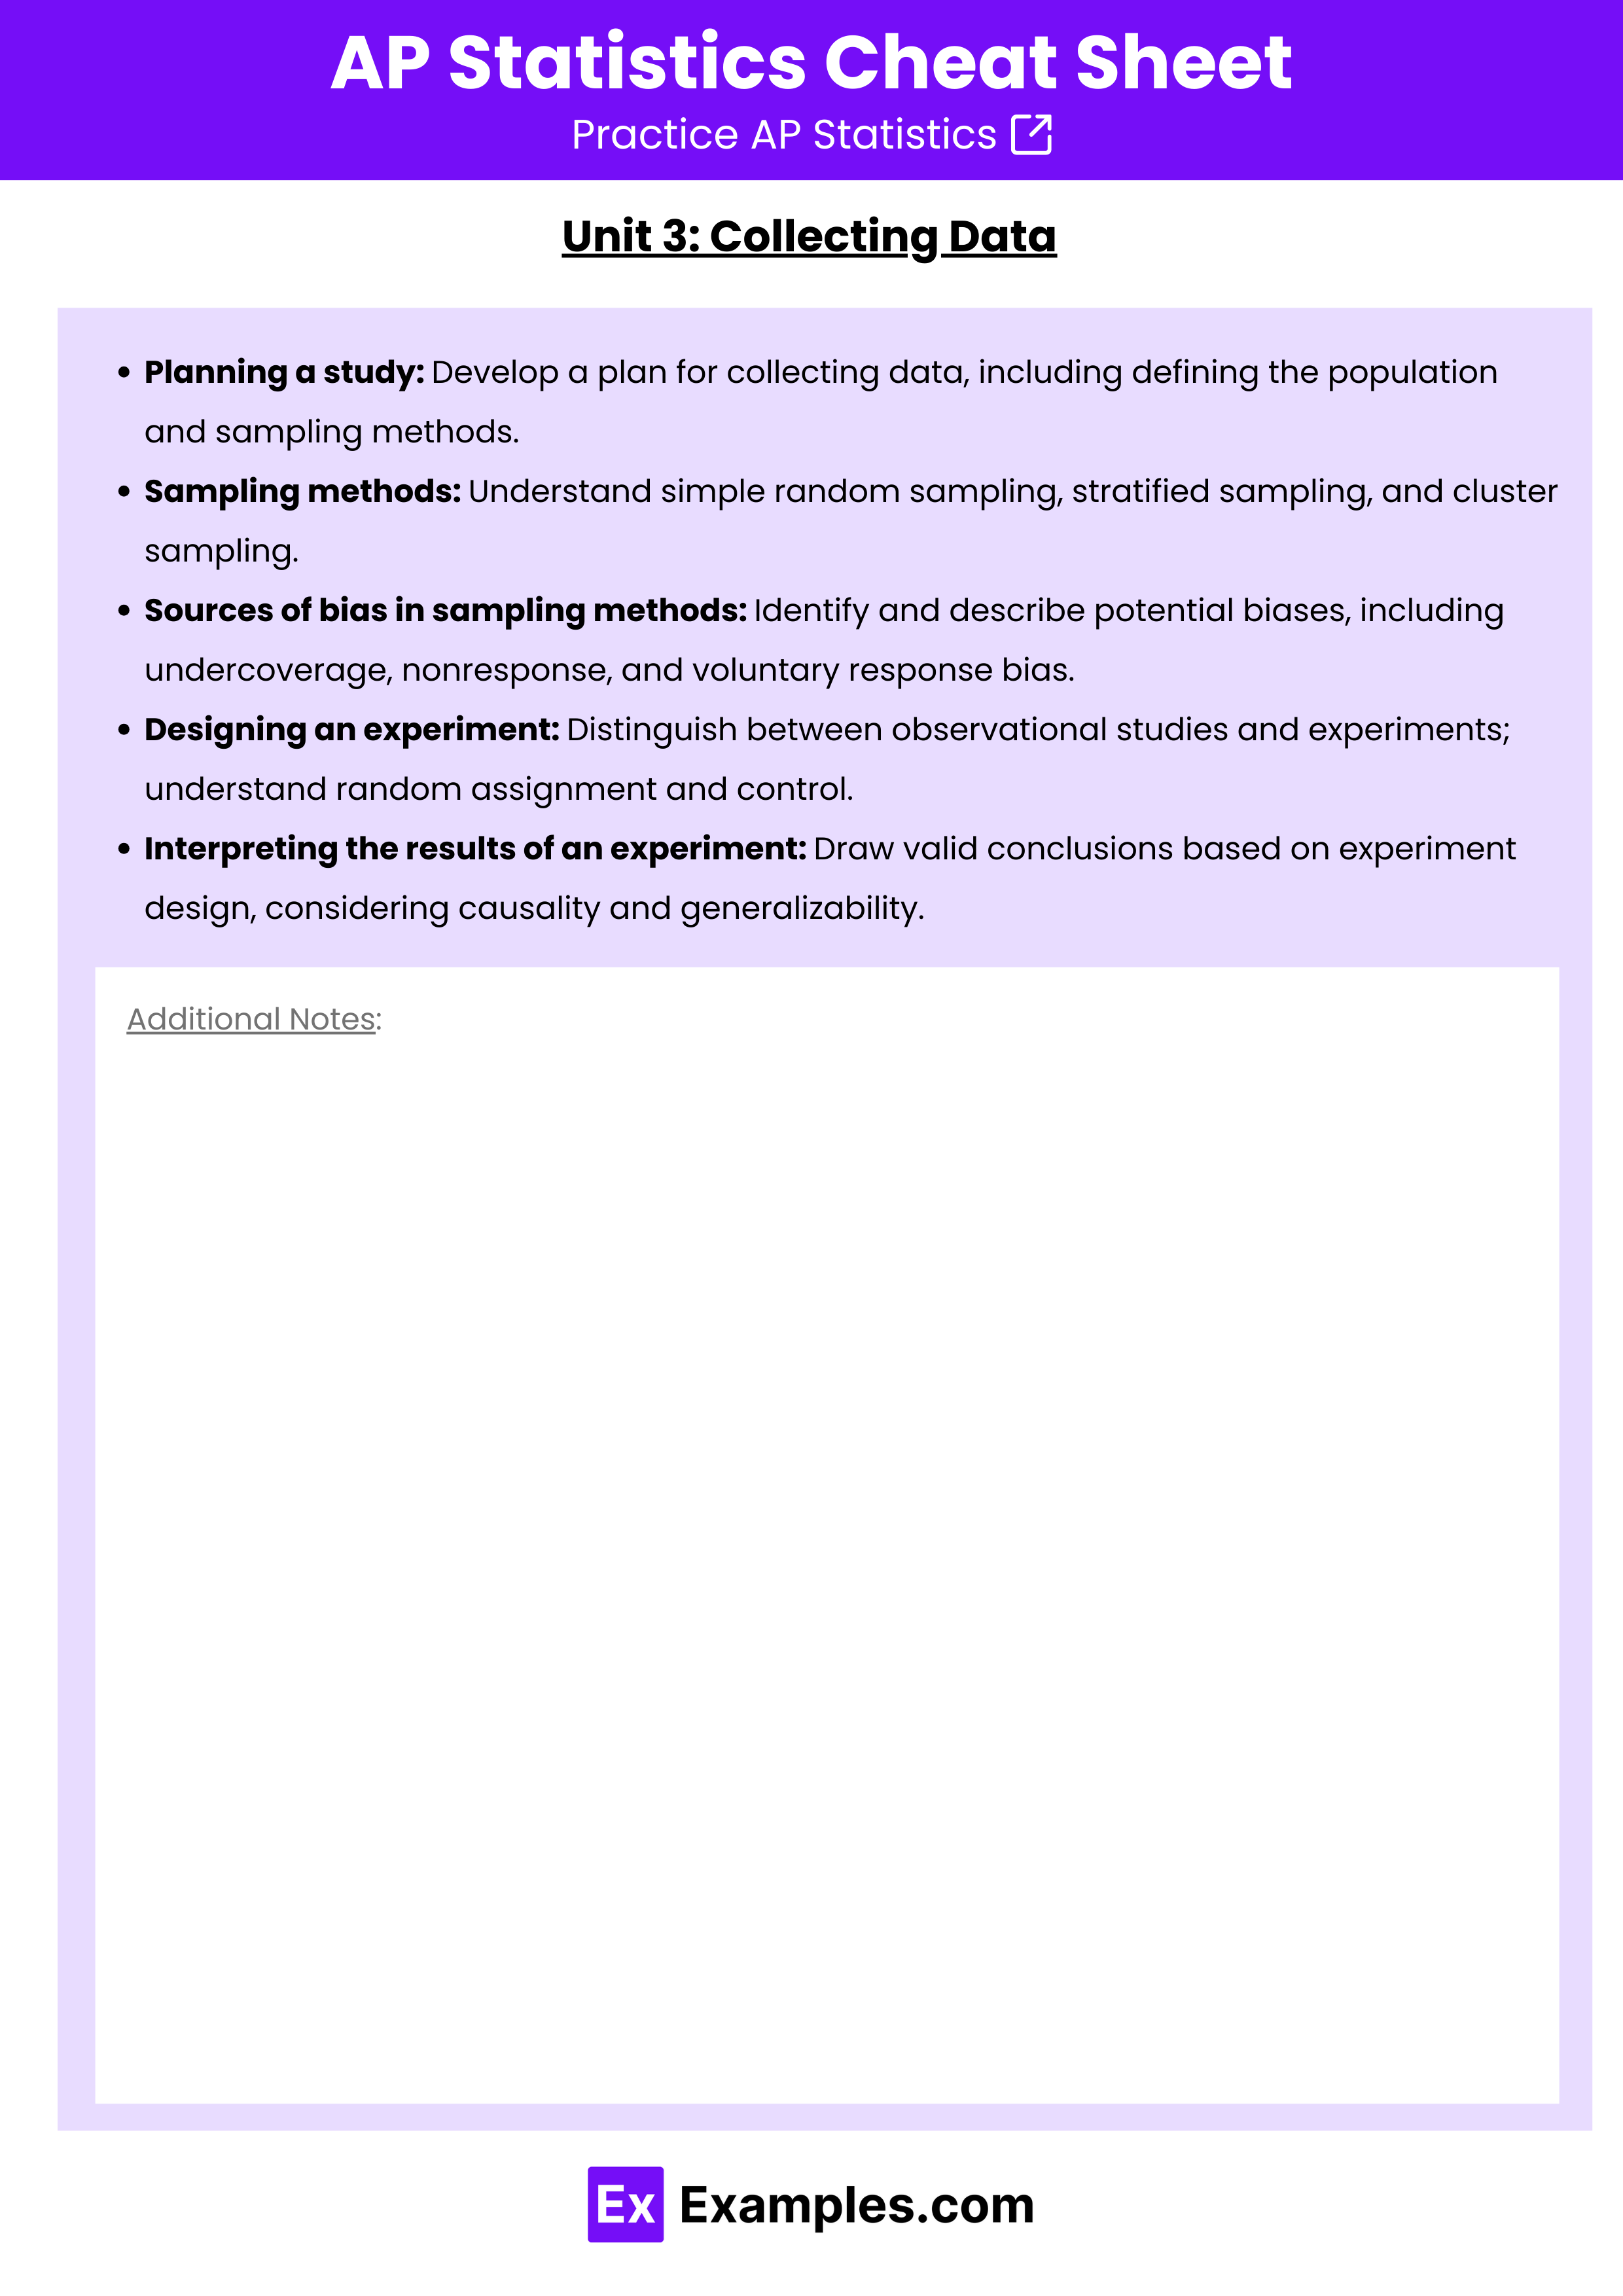
Unit 3: Collecting Data
- Planning a study: Develop a plan for collecting data, including defining the population and sampling methods.
- Sampling methods: Understand simple random sampling, stratified sampling, and cluster sampling.
- Sources of bias in sampling methods: Identify and describe potential biases, including undercoverage, nonresponse, and voluntary response bias.
- Designing an experiment: Distinguish between observational studies and experiments; understand random assignment and control.
- Interpreting the results of an experiment: Draw valid conclusions based on experiment design, considering causality and generalizability.
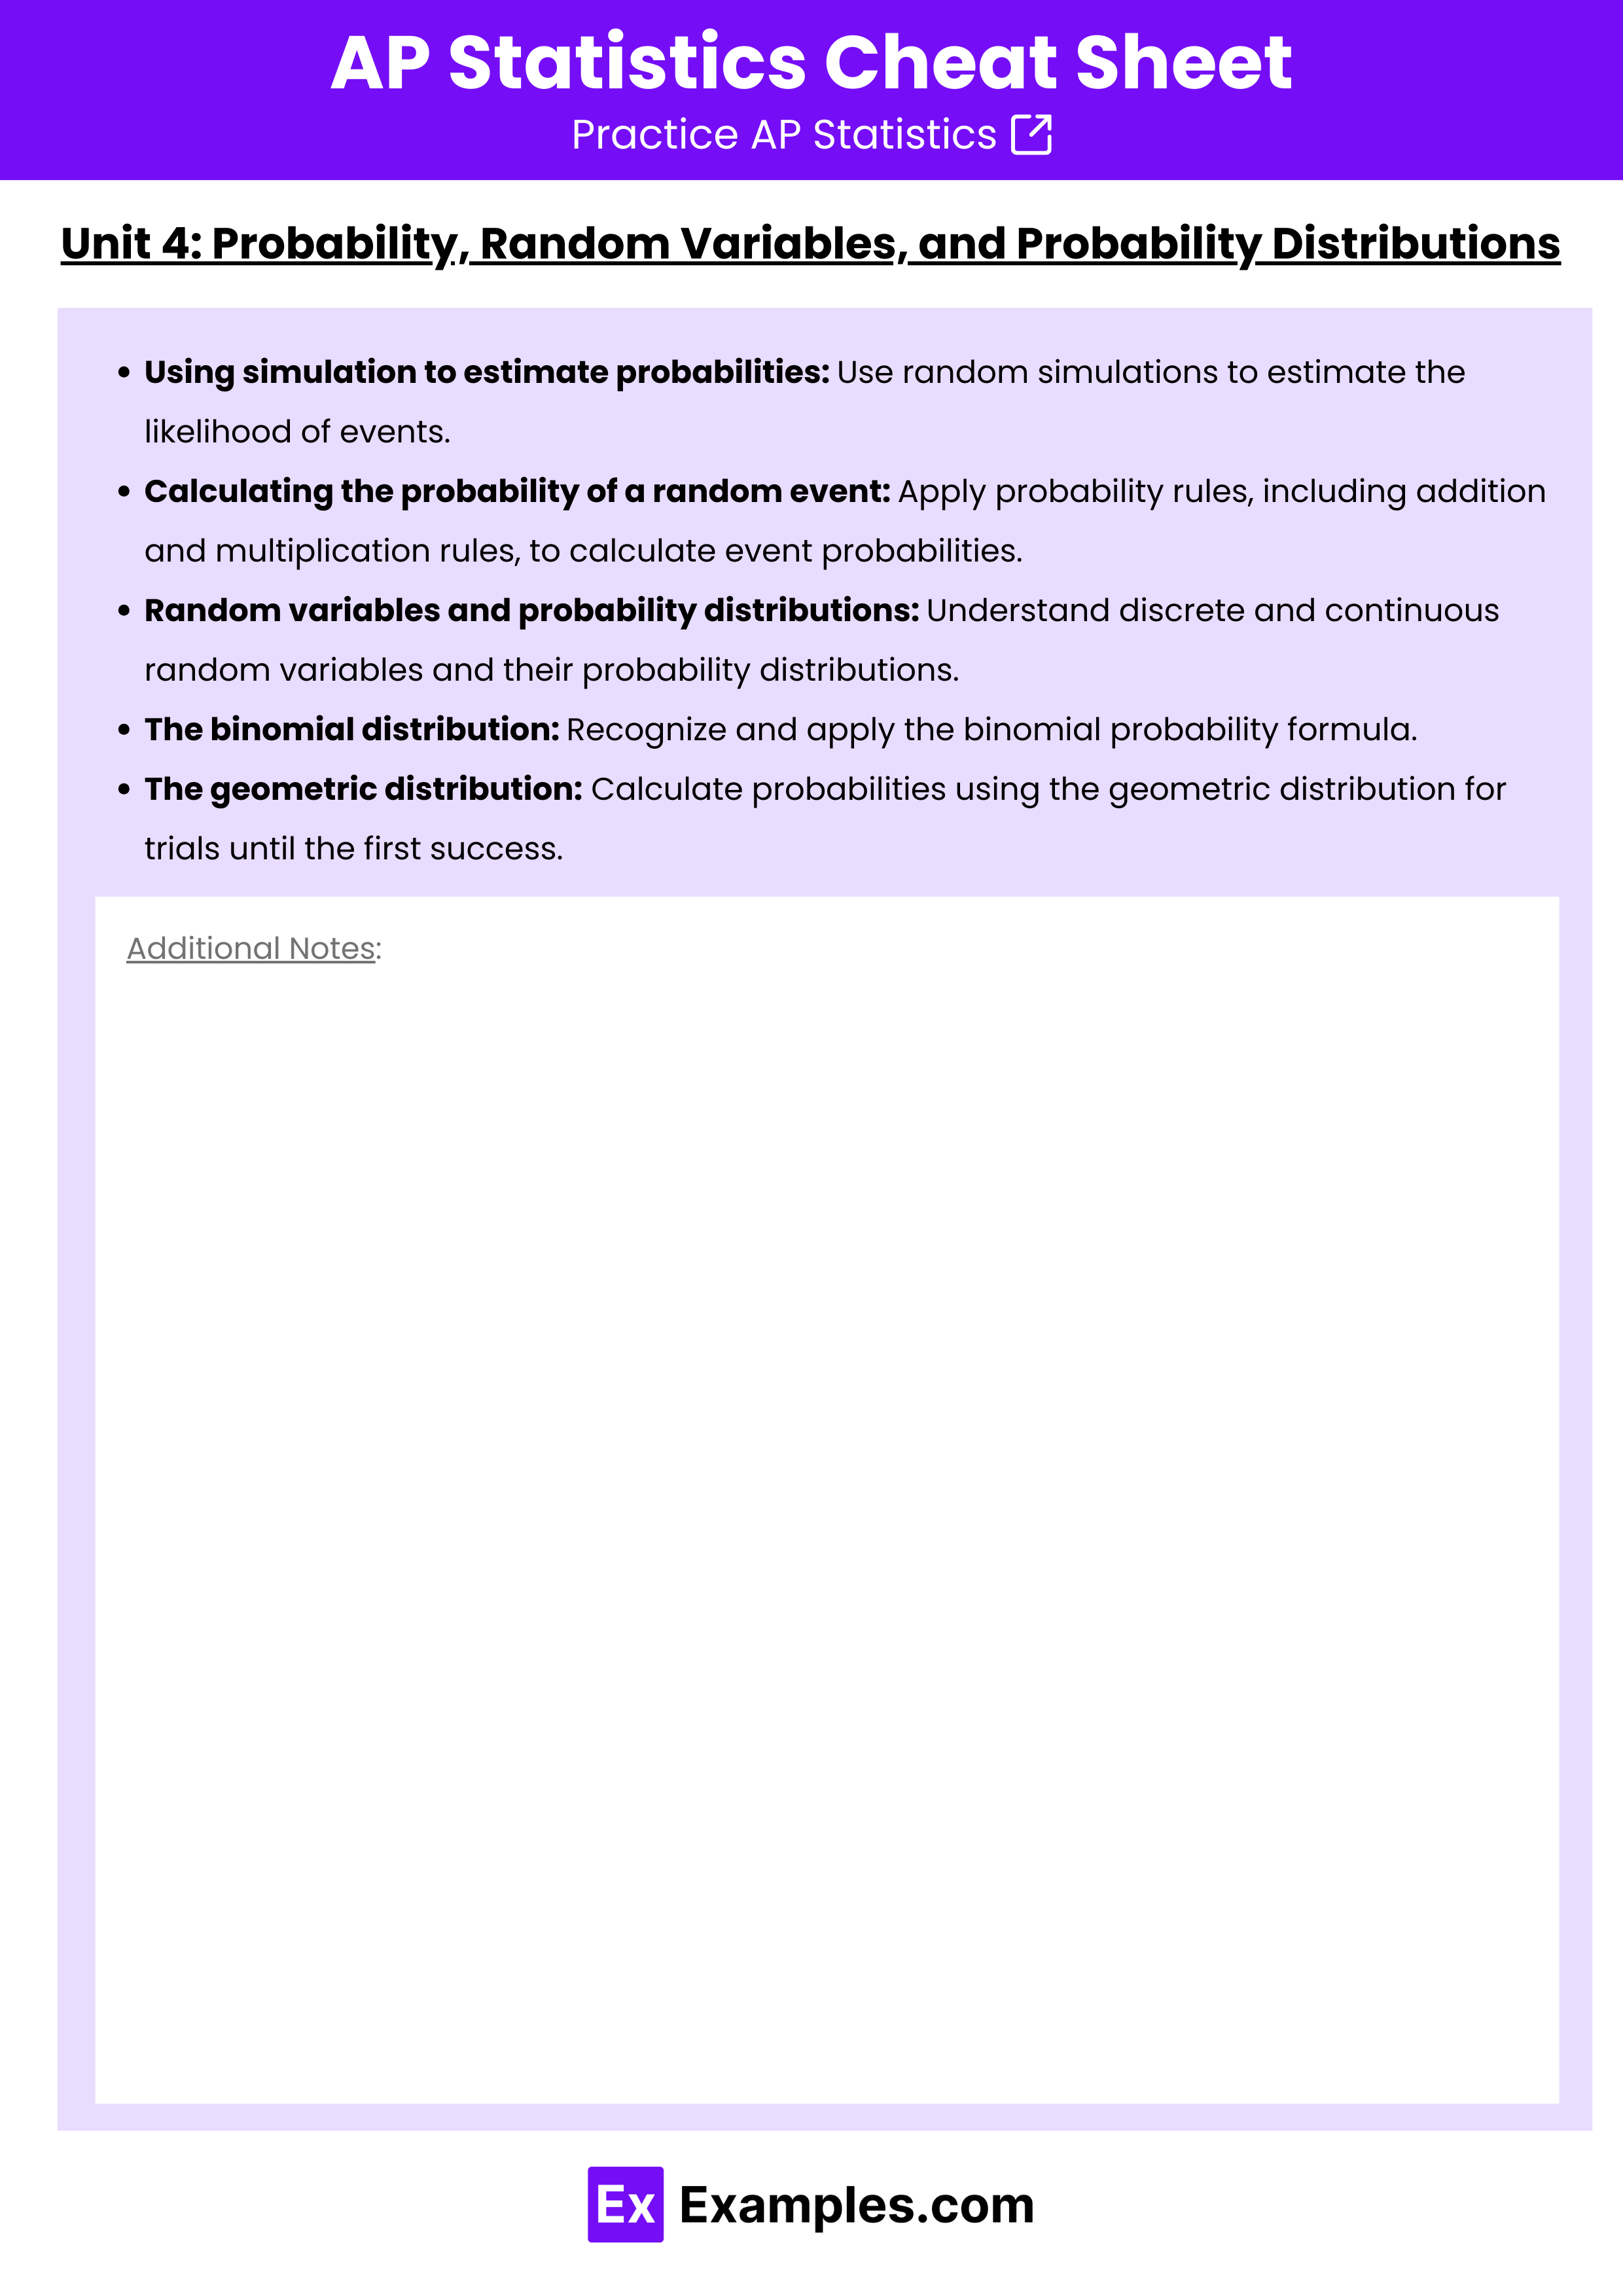
Unit 4: Probability, Random Variables, and Probability Distributions
- Using simulation to estimate probabilities: Use random simulations to estimate the likelihood of events.
- Calculating the probability of a random event: Apply probability rules, including addition and multiplication rules, to calculate event probabilities.
- Random variables and probability distributions: Understand discrete and continuous random variables and their probability distributions.
- The binomial distribution: Recognize and apply the binomial probability formula.
- The geometric distribution: Calculate probabilities using the geometric distribution for trials until the first success.
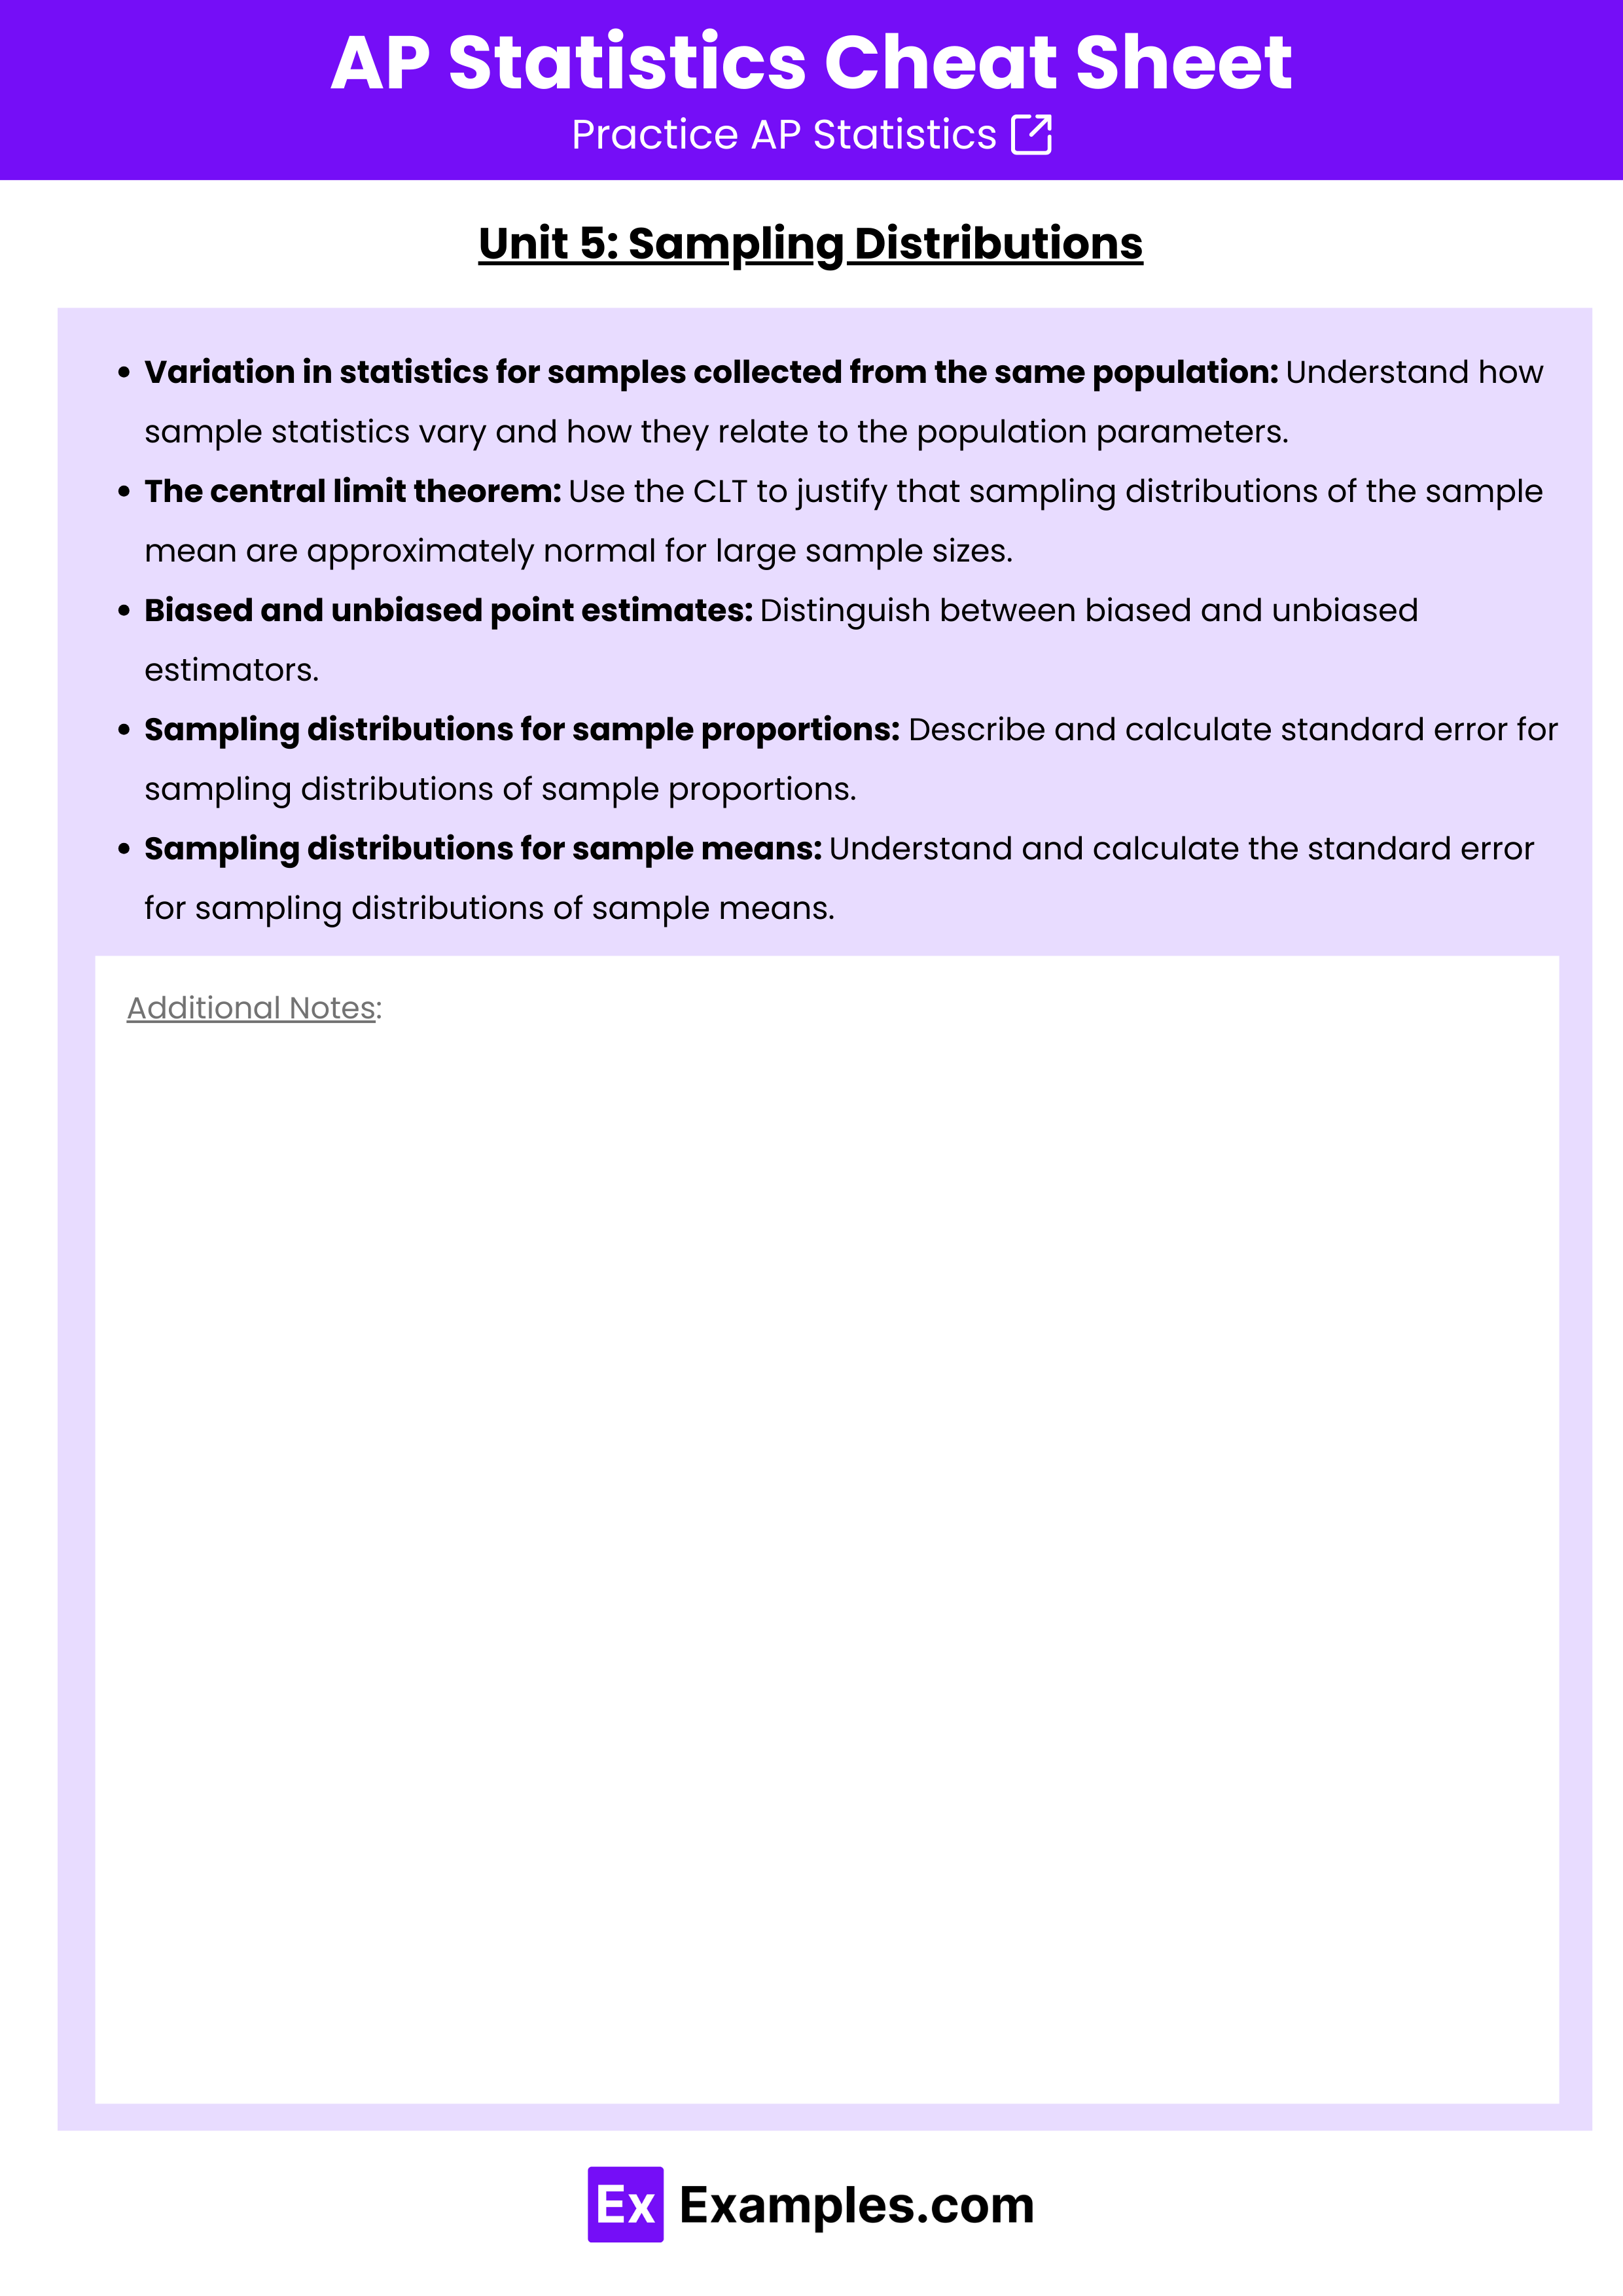
Unit 5: Sampling Distributions
- Variation in statistics for samples collected from the same population: Understand how sample statistics vary and how they relate to the population parameters.
- The central limit theorem: Use the CLT to justify that sampling distributions of the sample mean are approximately normal for large sample sizes.
- Biased and unbiased point estimates: Distinguish between biased and unbiased estimators.
- Sampling distributions for sample proportions: Describe and calculate standard error for sampling distributions of sample proportions.
- Sampling distributions for sample means: Understand and calculate the standard error for sampling distributions of sample means.
Unit 6: Inference for Categorical Data: Proportions
- Constructing and interpreting a confidence interval for a population proportion: Use sample data to construct confidence intervals for population proportions.
- Setting up and carrying out a test for a population proportion: Perform hypothesis tests for population proportions, interpreting p-values correctly.
- Interpreting a p-value and justifying a claim about a population proportion: Use p-values to make decisions about population proportions.
- Type I and Type II errors in significance testing: Understand and differentiate between Type I and Type II errors.
- Confidence intervals and tests for the difference of 2 proportions: Construct and interpret confidence intervals and tests for comparing two population proportions.
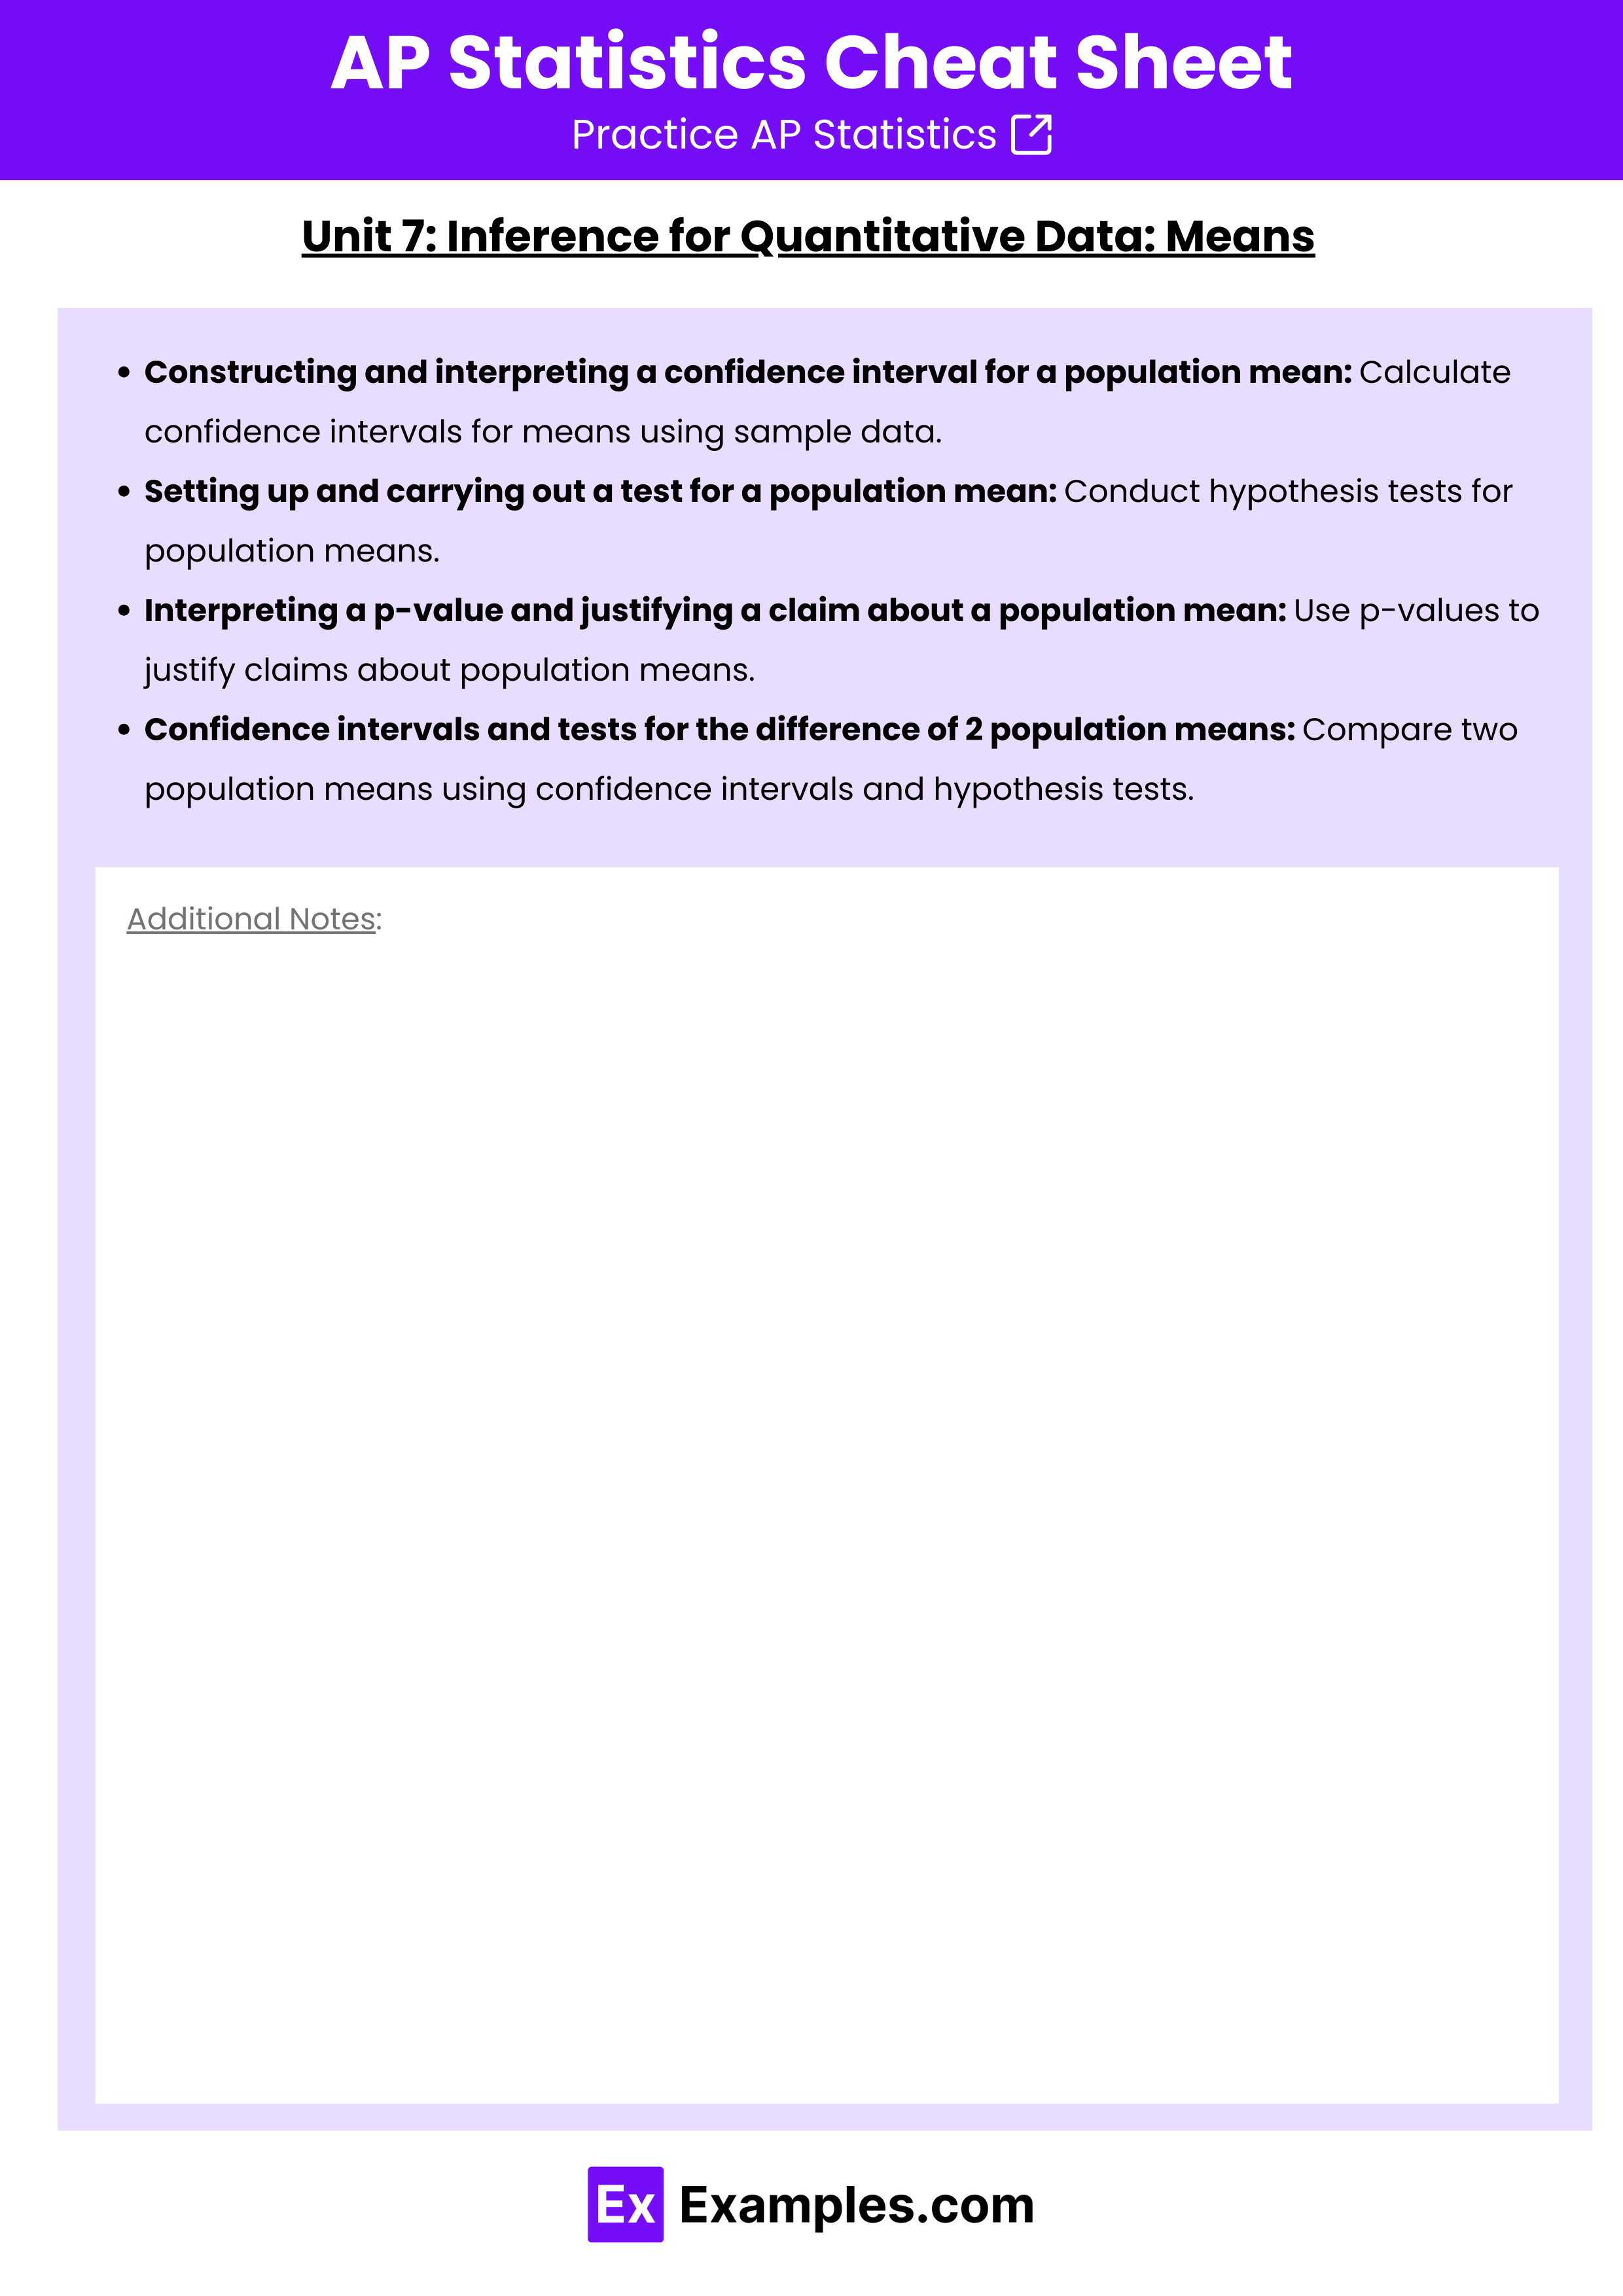
Unit 7: Inference for Quantitative Data: Means
- Constructing and interpreting a confidence interval for a population mean: Calculate confidence intervals for means using sample data.
- Setting up and carrying out a test for a population mean: Conduct hypothesis tests for population means.
- Interpreting a p-value and justifying a claim about a population mean: Use p-values to justify claims about population means.
- Confidence intervals and tests for the difference of 2 population means: Compare two population means using confidence intervals and hypothesis tests.
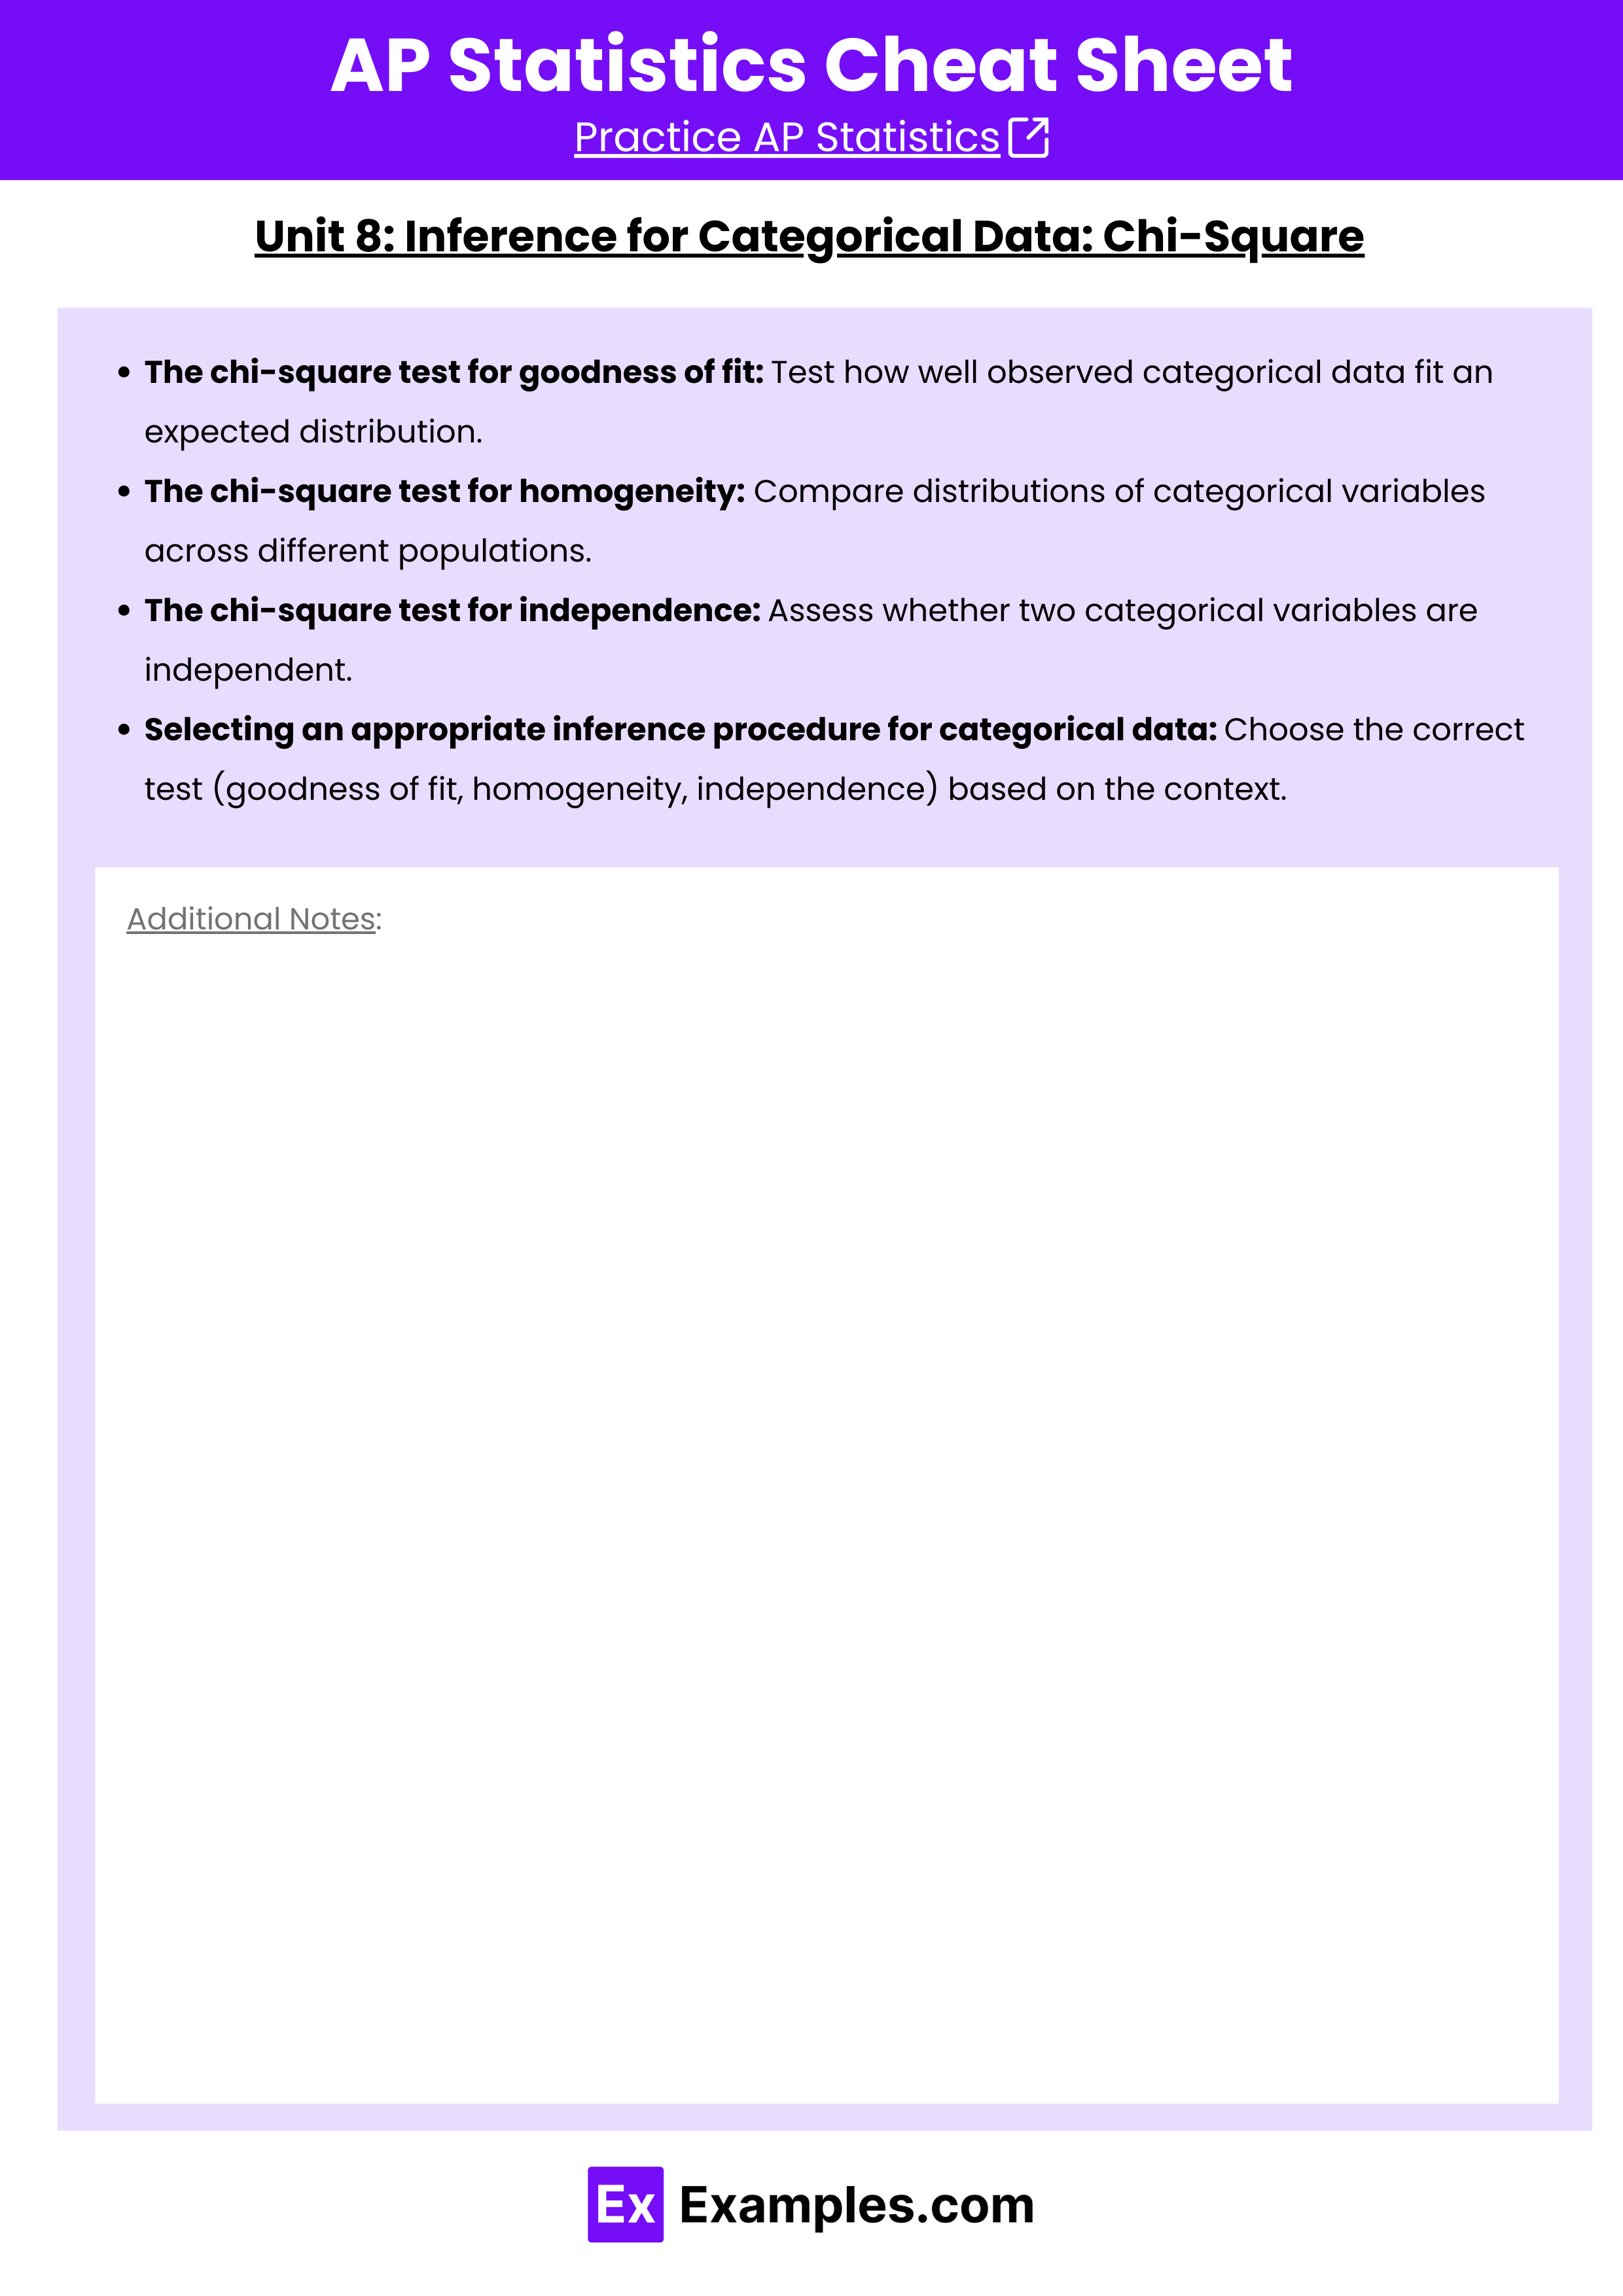
Unit 8: Inference for Categorical Data: Chi-Square
- The chi-square test for goodness of fit: Test how well observed categorical data fit an expected distribution.
- The chi-square test for homogeneity: Compare distributions of categorical variables across different populations.
- The chi-square test for independence: Assess whether two categorical variables are independent.
- Selecting an appropriate inference procedure for categorical data: Choose the correct test (goodness of fit, homogeneity, independence) based on the context.
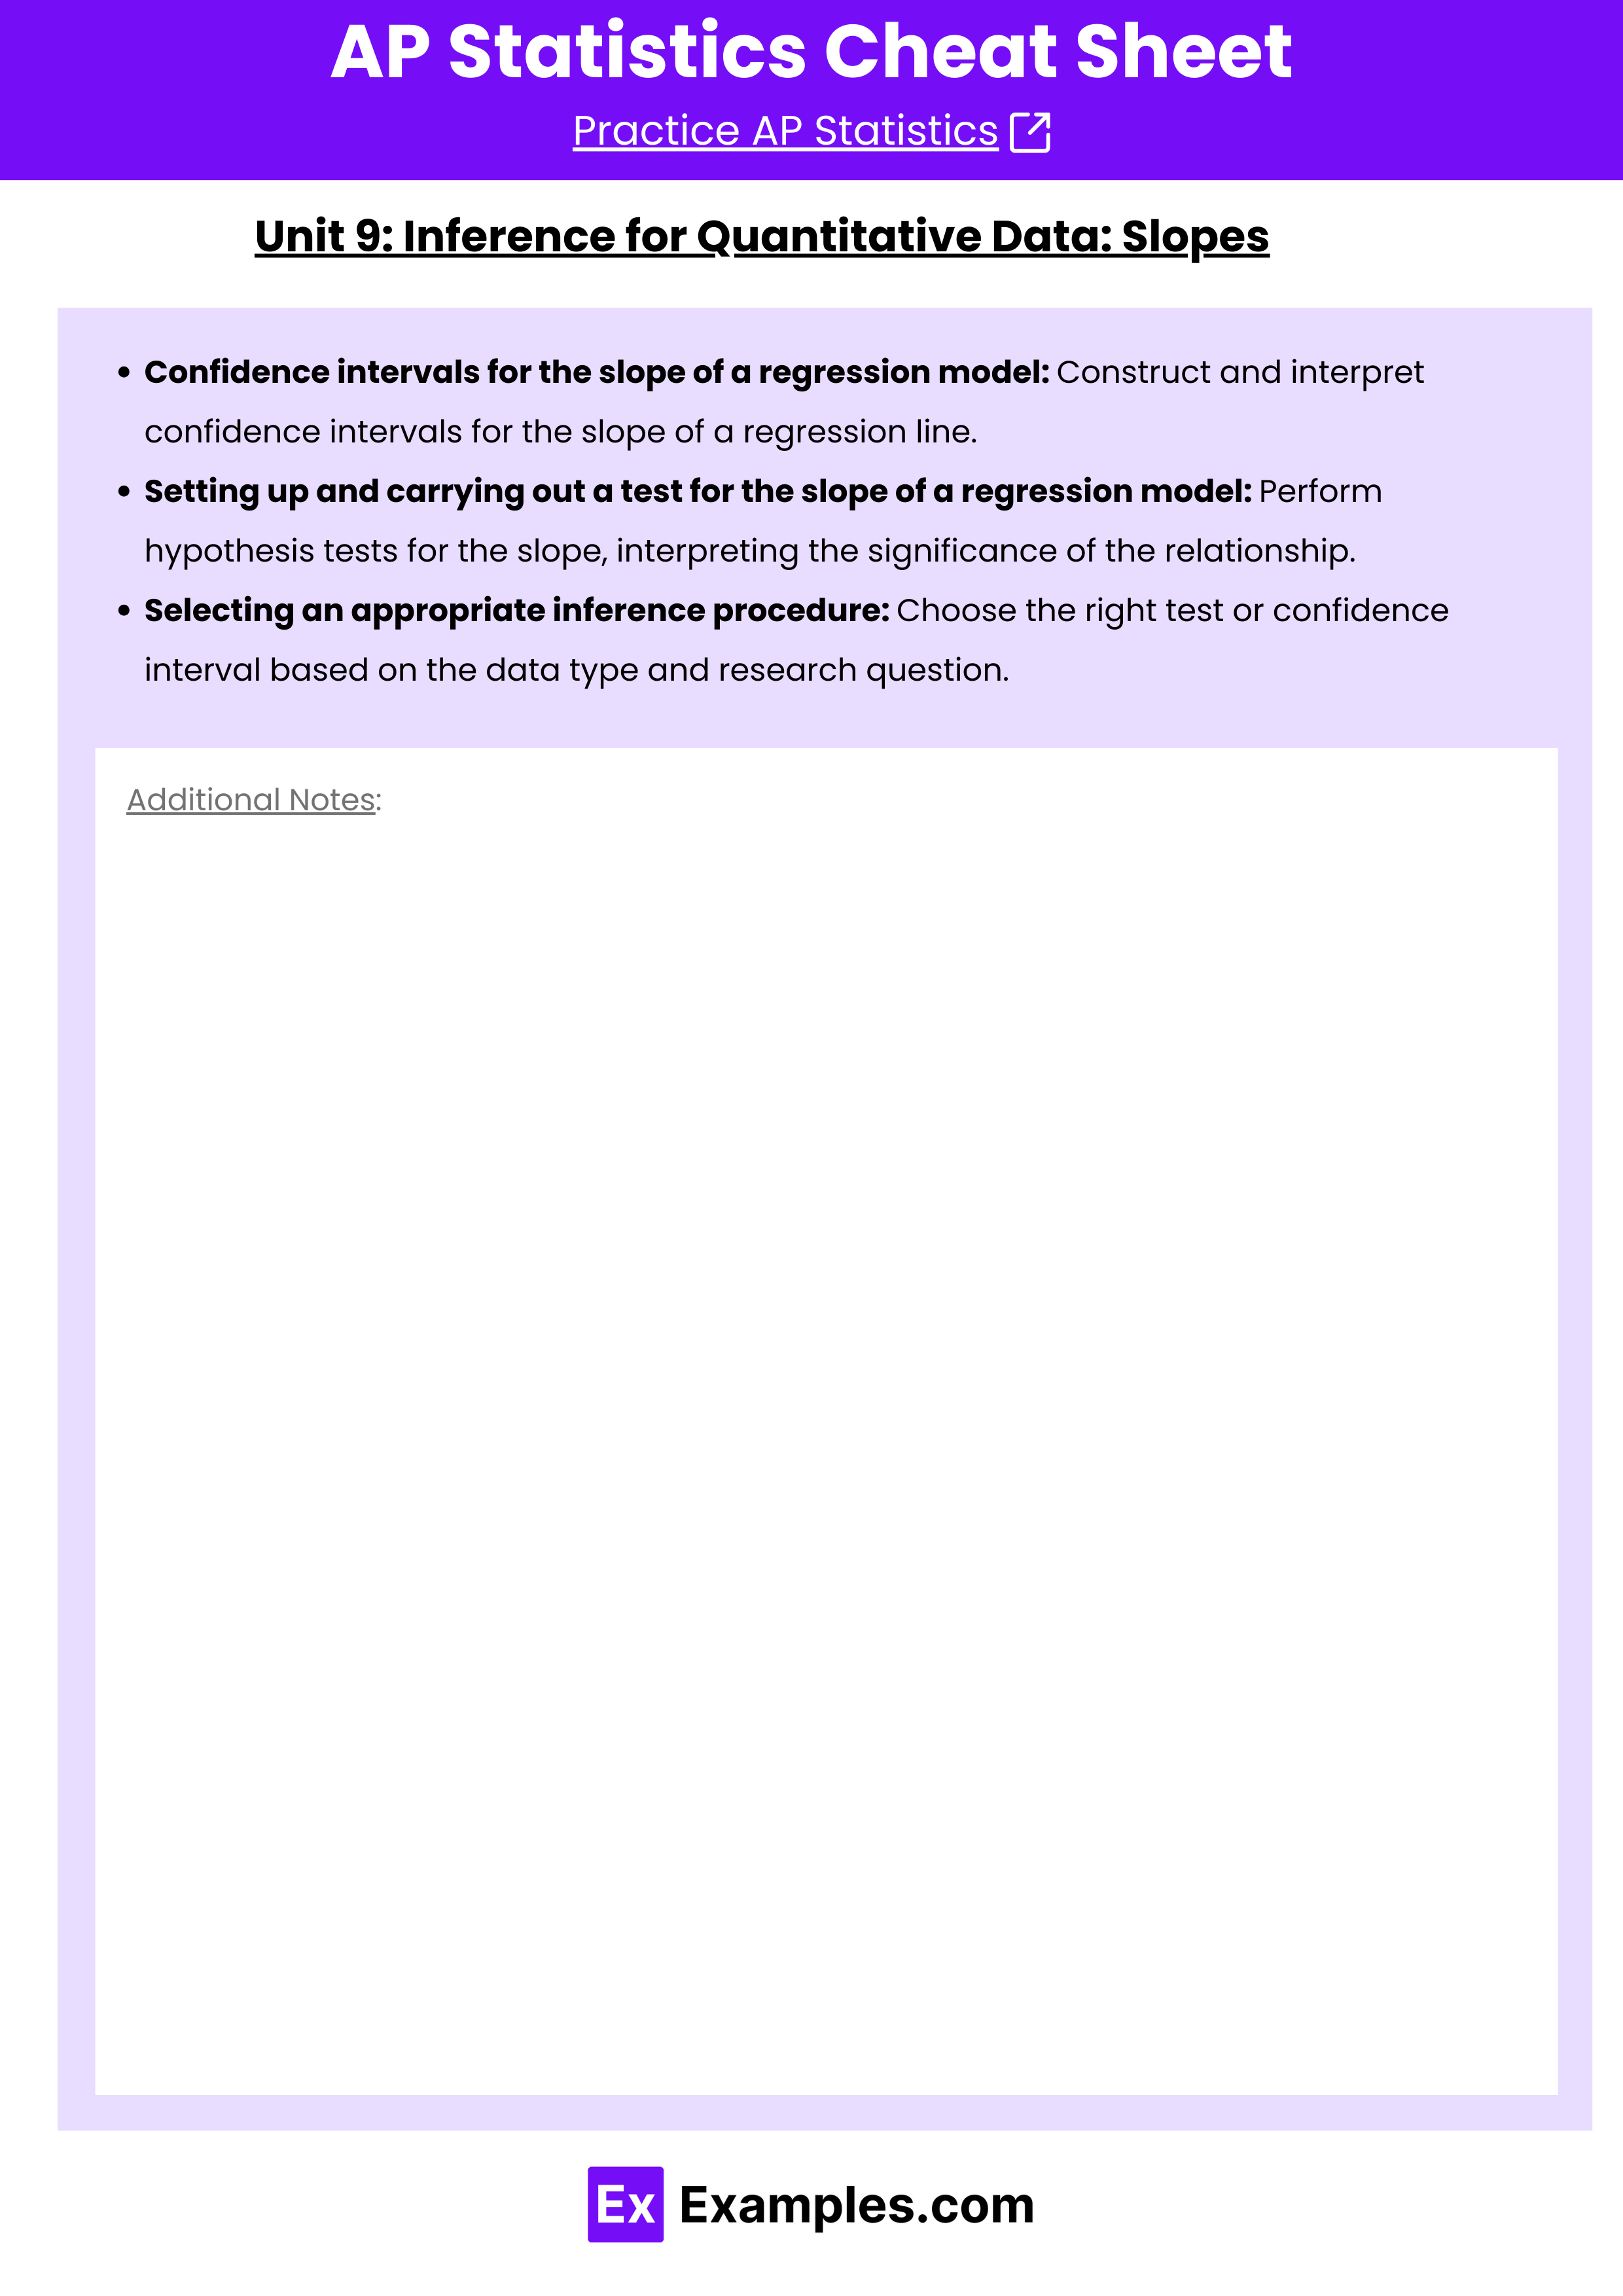
Unit 9: Inference for Quantitative Data: Slopes
- Confidence intervals for the slope of a regression model: Construct and interpret confidence intervals for the slope of a regression line.
- Setting up and carrying out a test for the slope of a regression model: Perform hypothesis tests for the slope, interpreting the significance of the relationship.
- Selecting an appropriate inference procedure: Choose the right test or confidence interval based on the data type and research question.