
Biased and Unbiased Point Estimates

 for the population mean
  and the sample proportion
  for the population proportion (p).
 .
. is a biased estimator of the population variance
  because its expected value is not
  .
.
 , which estimates the population mean μ\muμ.
 , estimating the true proportion
  .
. .
. with (n-1\) in the denominator to get an unbiased estimator:
  .
.In AP Statistics, understanding biased and unbiased point estimates is crucial for accurately interpreting data. A point estimate is a single value used to estimate a population parameter. An unbiased estimator, like the sample mean, accurately reflects the true parameter, with its expected value equal to the parameter. In contrast, a biased estimator consistently overestimates or underestimates the parameter. Recognizing these differences helps in selecting appropriate statistical methods and ensuring reliable data analysis.
Learning Objective
In this topic on biased and unbiased point estimates, you will be introduced to the key concepts and definitions, understand how to differentiate between biased and unbiased estimators, learn how to calculate common point estimates such as the sample mean and sample variance, and recognize the importance of using unbiased estimators in data analysis to ensure accurate representation of population parameters. Additionally, you will practice identifying and correcting biased estimators through real-world examples and multiple-choice questions.
Biased and Unbiased Point Estimates
Definition
Point Estimate: A single value estimate of a population parameter. Common point estimates include the sample mean for the population mean and the sample proportion for the population proportion (p).
Unbiased Estimates
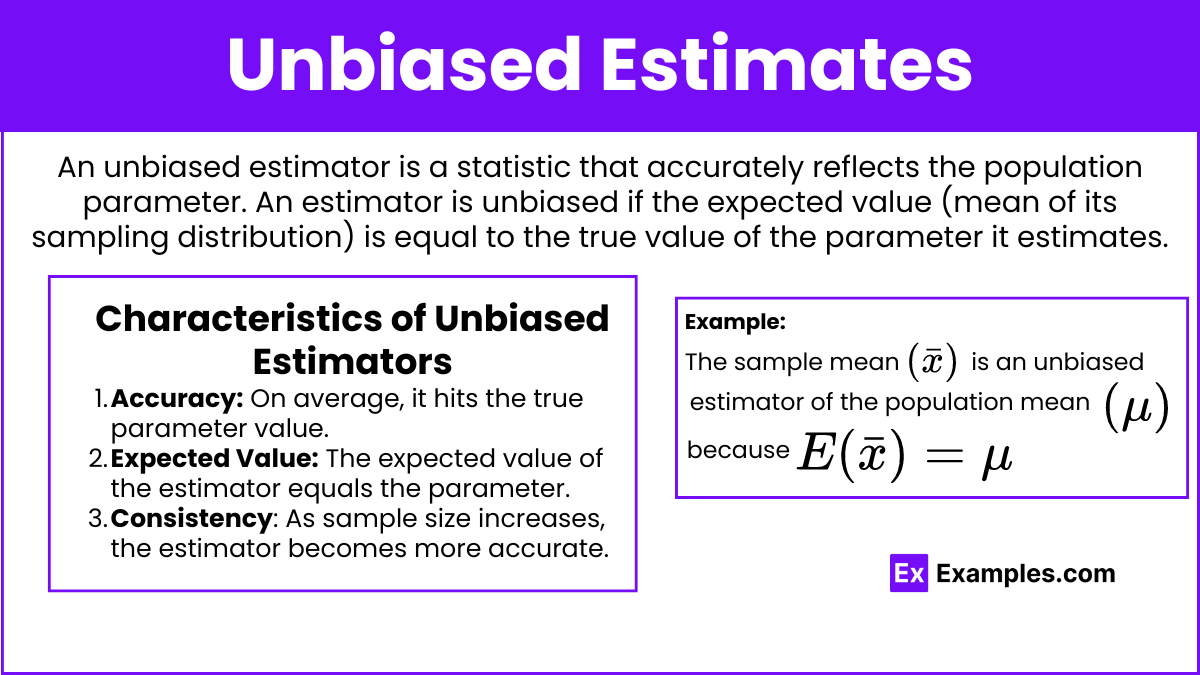
An unbiased estimator is a statistic that accurately reflects the population parameter. An estimator is unbiased if the expected value (mean of its sampling distribution) is equal to the true value of the parameter it estimates.
Example: The sample mean is an unbiased estimator of the population mean because .
Characteristics of Unbiased Estimators
Accuracy: On average, it hits the true parameter value.
Expected Value: The expected value of the estimator equals the parameter.
Consistency: As sample size increases, the estimator becomes more accurate.
Biased Estimates
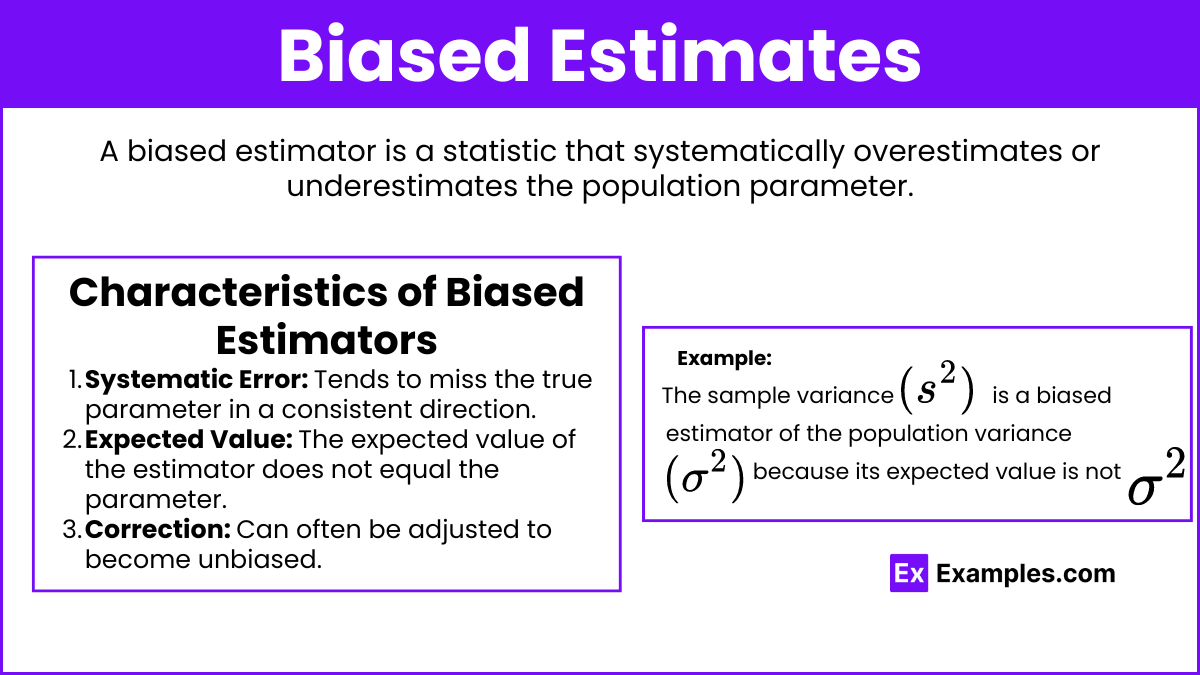
A biased estimator is a statistic that systematically overestimates or underestimates the population parameter.
Example: The sample variance is a biased estimator of the population variance because its expected value is not .
Characteristics of Biased Estimators
Systematic Error: Tends to miss the true parameter in a consistent direction.
Expected Value: The expected value of the estimator does not equal the parameter.
Correction: Can often be adjusted to become unbiased.
Examples
Sample Mean
Unbiased Estimator: The sample mean is an unbiased estimator of the population mean.
Example Calculation: If you sample 5 students' scores: 70, 75, 80, 85, 90, the sample mean is , which estimates the population mean μ\muμ.
Sample Proportion
Unbiased Estimator: The sample proportion is an unbiased estimator of the population proportion.
Example Calculation: In a sample of 100 voters, if 60 support a candidate, , estimating the true proportion .
Sample Variance (s²)
Biased Estimator: The sample variance is biased as .
Bias Adjustment: Use with (n-1s^2 = \frac{\sum (x_i - \bar{x})^2}{n-1}$.
Sample Median
Biased/Unbiased: The sample median can be biased or unbiased depending on the population distribution.
Example Calculation: For the sample 3, 5, 7, 9, the median is 6.
Sample Range
Biased Estimator: The sample range is typically biased because it underestimates the population range.
Example Calculation: For data 2, 4, 6, 8, 10, the range is 8.
Multiple-Choice Questions (MCQs)
Which of the following is an unbiased estimator of the population mean (μ\muμ)?
A) Sample median
B) Sample mean
C) Sample variance
D) Sample range
Answer: B) Sample mean
Explanation: The sample mean is an unbiased estimator of the population mean (μ\muμ), as its expected value equals the population mean.
2. Which statement is true about biased estimators?
A) They have an expected value equal to the population parameter.
B) They always underestimate the population parameter.
C) They systematically miss the true parameter in one direction.
D) They are more accurate than unbiased estimators.
Answer: C) They systematically miss the true parameter in one direction.
Explanation: Biased estimators consistently overestimate or underestimate the true parameter value.
3. If a statistic consistently underestimates a parameter, it is:
A) Unbiased
B) Biased
C) Consistent
D) Efficient
Answer: B) Biased
Explanation: A statistic that systematically underestimates a parameter is biased because it does not accurately reflect the true value of the parameter.