
Calculating Statistics For 2 Categorical Variables

![\[\text{Male}\]](https://www.examples.com/wp-content/ql-cache/quicklatex.com-6da3df1f53da6173c24b6994dc9a558e_l3.svg "Rendered by QuickLaTeX.com")
![\[\text{Math } \dfrac{10}{45}\]](https://www.examples.com/wp-content/ql-cache/quicklatex.com-81d1d88d10e8ddd63704ff2ab6a8b21a_l3.svg "Rendered by QuickLaTeX.com")
![\[\text{Science } \dfrac{20}{45}\]](https://www.examples.com/wp-content/ql-cache/quicklatex.com-e53722d9a4b6de15434248b1f18508a9_l3.svg "Rendered by QuickLaTeX.com")
![\[\text{English } \dfrac{15}{45}\]](https://www.examples.com/wp-content/ql-cache/quicklatex.com-261fb41e2bdf6908c1b36534833345b4_l3.svg "Rendered by QuickLaTeX.com")
![\[H_0\]](https://www.examples.com/wp-content/ql-cache/quicklatex.com-f7b13c5d6cd5560b1dd5c6b2877d9781_l3.svg "Rendered by QuickLaTeX.com")
![\[H_1\]](https://www.examples.com/wp-content/ql-cache/quicklatex.com-619cc67cdf7f5f4ff5805f761a23be2f_l3.svg "Rendered by QuickLaTeX.com")
![\[\text{Expected Frequencies:}\]](https://www.examples.com/wp-content/ql-cache/quicklatex.com-5a220e0f7a522e5c34801c63cb2dbf5b_l3.svg "Rendered by QuickLaTeX.com")
![\[E_{\text{Math, Male}} = \dfrac{45 \times 30}{100} = 13.5\]](https://www.examples.com/wp-content/ql-cache/quicklatex.com-adaa3a4b3ee10aefc1245c0b5cd841fc_l3.svg "Rendered by QuickLaTeX.com")
![\[E_{\text{Science, Male}} = \dfrac{45 \times 35}{100} = 15.75\]](https://www.examples.com/wp-content/ql-cache/quicklatex.com-61f1bbc013478646132426861a10ca4d_l3.svg "Rendered by QuickLaTeX.com")
![\[E_{\text{English, Male}} = \dfrac{45 \times 35}{100} = 15.75\]](https://www.examples.com/wp-content/ql-cache/quicklatex.com-0a7041008e3a7454a2e2dc8d18cafd9b_l3.svg "Rendered by QuickLaTeX.com")
![\[\text{Chi-Square Statistic:}\]](https://www.examples.com/wp-content/ql-cache/quicklatex.com-b94b0bbcc22861f099a2f8b33f806b59_l3.svg "Rendered by QuickLaTeX.com")
![\[\chi^2 = \sum \dfrac{(O_i - E_i)^2}{E_i} = \dfrac{(10 - 13.5)^2}{13.5} + \dfrac{(20 - 15.75)^2}{15.75} + \dfrac{(15 - 15.75)^2}{15.75} + \cdots\]](https://www.examples.com/wp-content/ql-cache/quicklatex.com-21da5e7114e1792506b7e7283c7ab9a8_l3.svg "Rendered by QuickLaTeX.com")
![\[E_i = \dfrac{(\text{row total} \times \text{column total})}{\text{grand total}}\]](https://www.examples.com/wp-content/ql-cache/quicklatex.com-d0120541b5148e8efd9f0a9110b55ba6_l3.svg "Rendered by QuickLaTeX.com")
In AP Statistics, calculating statistics for two categorical variables is essential for understanding relationships and dependencies between them. This topic involves using contingency tables, marginal and joint distributions, conditional distributions, and the chi-square test of independence. These tools allow you to analyze the interaction between two categorical variables, identify patterns, and determine if a significant association exists. Mastering these techniques is crucial for effectively interpreting data and drawing meaningful conclusions in the AP Statistics exam.
Learning Objectives
By studying how to calculate statistics for two categorical variables, you will learn to use contingency tables, marginal and joint distributions, and conditional distributions. You will also master performing the chi-square test of independence. These skills will enable you to analyze interactions between categorical variables, identify patterns, and determine significant associations. This knowledge is crucial for effectively interpreting data and drawing meaningful conclusions, preparing you for success in the AP Statistics exam.
Contingency Tables
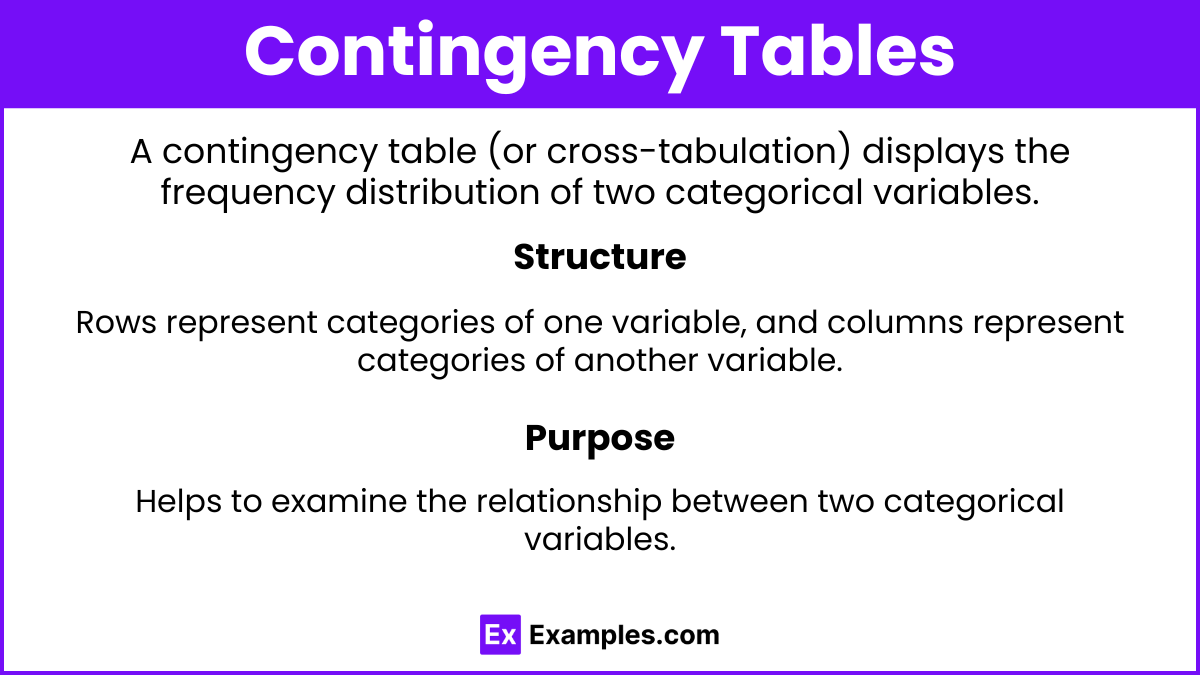
Definition: A contingency table (or cross-tabulation) displays the frequency distribution of two categorical variables.
Structure: Rows represent categories of one variable, and columns represent categories of another variable.
Purpose: Helps to examine the relationship between two categorical variables.
Marginal Distribution
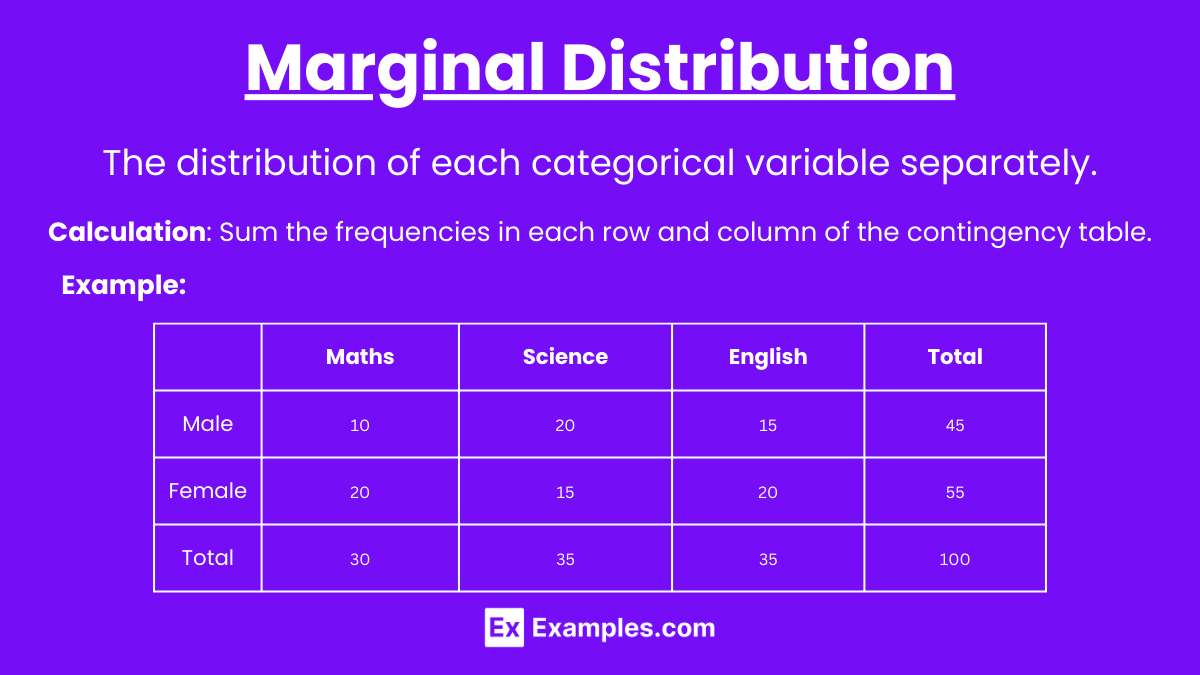
Definition: The distribution of each categorical variable separately.
Calculation: Sum the frequencies in each row and column of the contingency table.
Example:
Math | Science | English | Total | |
Male | 10 | 20 | 15 | 45 |
Female | 20 | 15 | 20 | 55 |
Total | 30 | 35 | 35 | 100 |
Joint Distribution
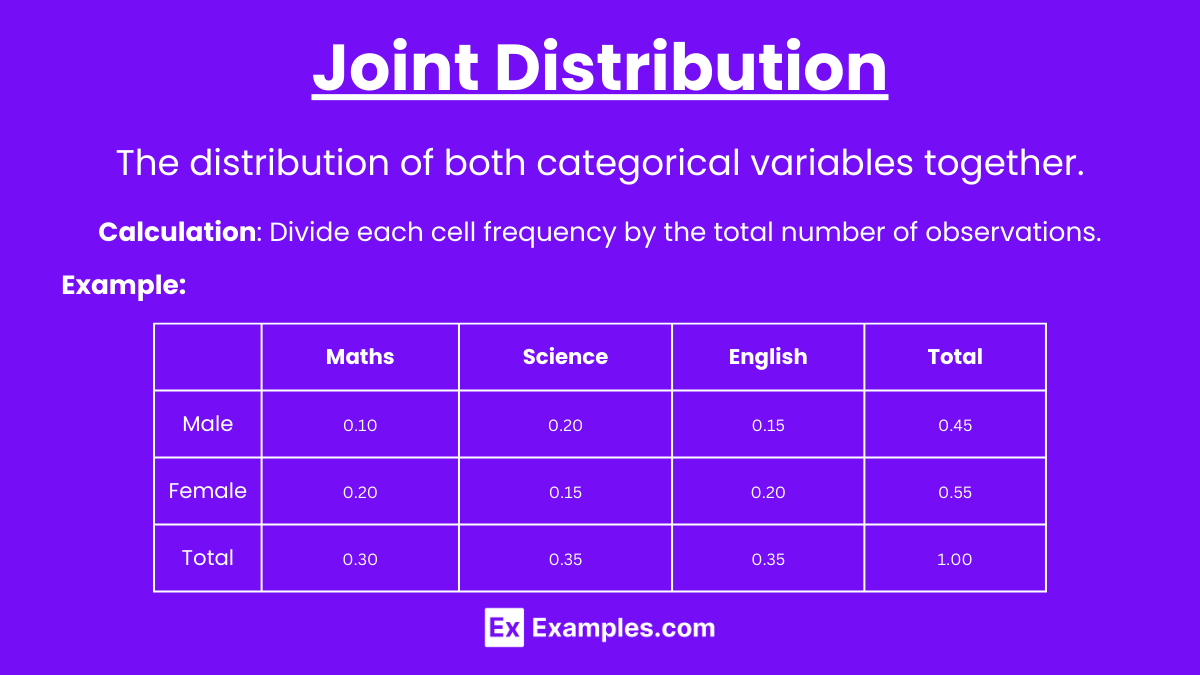
Definition: The distribution of both categorical variables together.
Calculation: Divide each cell frequency by the total number of observations.
Example:
Math | Science | English | Total | |
Male | 0.10 | 0.20 | 0.15 | 0.45 |
Female | 0.20 |
| 0.20 | 0.55 |
Total | 0.30 | 0.35 | 0.35 | 1.00 |
Conditional Distribution
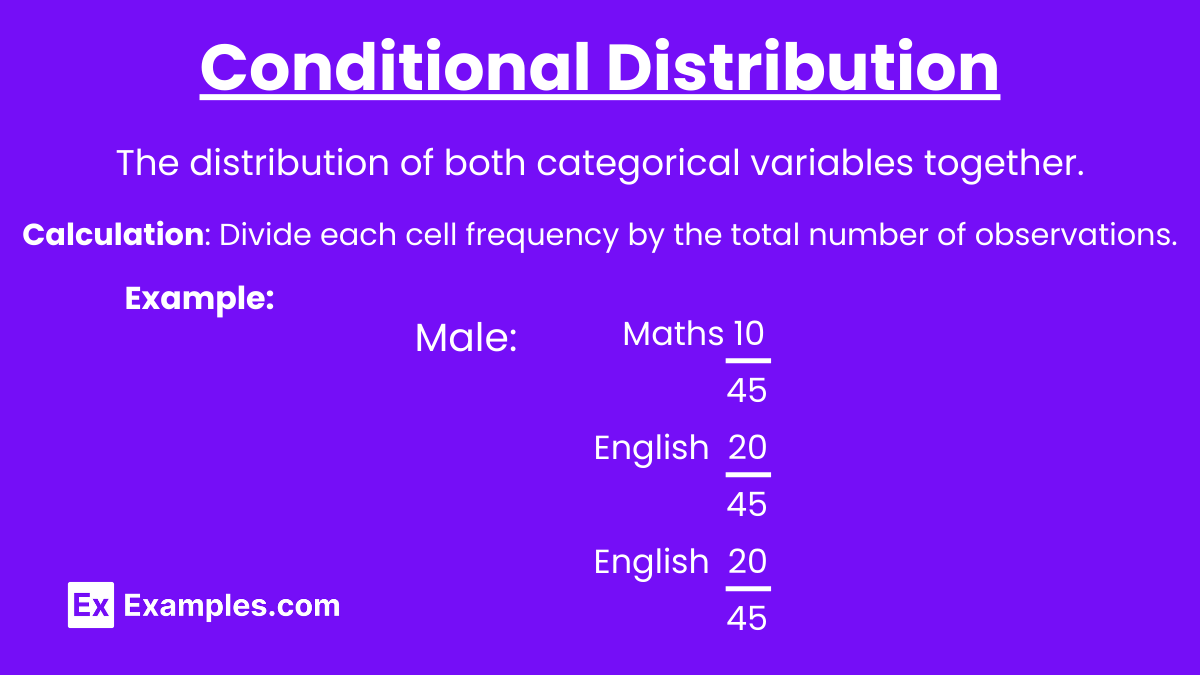
Definition: The distribution of one categorical variable for each level of the other categorical variable.
Calculation: Divide the cell frequency by the row or column total.
Example:
For Males:
\text{Male}
\text{Math } \dfrac{10}{45}
\text{Science } \dfrac{20}{45}
\text{English } \dfrac{15}{45}
Chi-Square Test of Independence
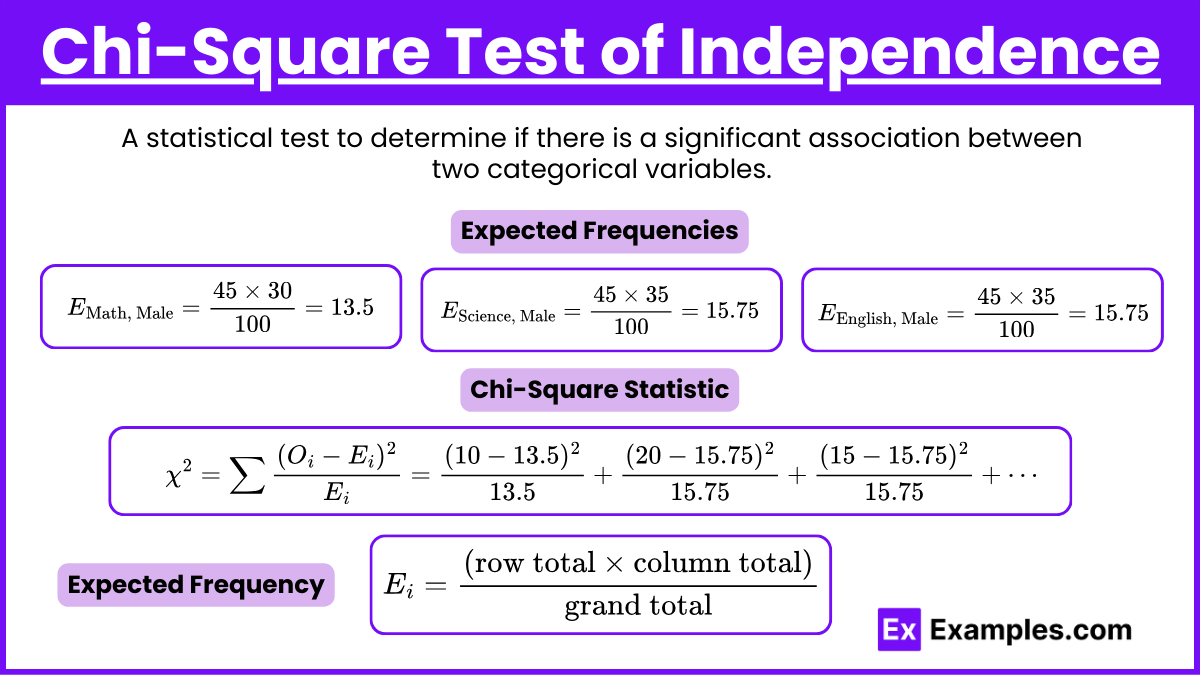
Definition: A statistical test to determine if there is a significant association between two categorical variables.
Hypotheses:
H_0: The two variables are independent.
H_1: The two variables are not independent.
Formula:
\text{Expected Frequencies:}
E_{\text{Math, Male}} = \dfrac{45 \times 30}{100} = 13.5
E_{\text{Science, Male}} = \dfrac{45 \times 35}{100} = 15.75
E_{\text{English, Male}} = \dfrac{45 \times 35}{100} = 15.75
\text{Chi-Square Statistic:}
\chi^2 = \sum \dfrac{(O_i - E_i)^2}{E_i} = \dfrac{(10 - 13.5)^2}{13.5} + \dfrac{(20 - 15.75)^2}{15.75} + \dfrac{(15 - 15.75)^2}{15.75} + \cdots
Expected Frequency:
E_i = \dfrac{(\text{row total} \times \text{column total})}{\text{grand total}}
Examples
Example 1: Contingency Table
Data: Survey of 100 students on gender (Male, Female) and favorite subject (Math, Science, English).
Table:
Math | Science | English | Total | |
Male | 10 | 20 | 15 | 45 |
Female | 20 | 15 | 20 | 55 |
Total | 30 | 35 | 35 | 100 |
Example 2: Marginal Distribution
Calculation: Sum the frequencies in each row and column of the contingency table.
Result:
Math | Science | English | Total | |
Male | 10 | 20 | 15 | 45 |
Female | 20 | 15 | 20 | 55 |
Total | 30 | 35 | 35 | 100 |
Example 3: Joint Distribution
Calculation: Divide each cell frequency by the total number of observations.
Result:
Math | Science | English | Total | |
Male | 0.10 | 0.20 | 0.15 | 0.45 |
Female | 0.20 | 0.15 | 0.20 | 0.55 |
Total | 0.30 | 0.35 | 0.35 | 1.00 |
Example 4: Conditional Distribution
Calculation: Divide the cell frequency by the row or column total.
Result:
For Males:
\text{Male}
\text{Math } \dfrac{10}{45}
\text{Science } \dfrac{20}{45}
\text{English } \dfrac{15}{45}
Example 5: Chi-Square Test of Independence
Data: Use the contingency table from Example 1.
Calculation:
Expected Frequencies:
E_{\text{Math, Male}} = \dfrac{45 \times 30}{100} = 13.5
E_{\text{Science, Male}} = \dfrac{45 \times 35}{100} = 15.75
E_{\text{English, Male}} = \dfrac{45 \times 35}{100} = 15.75
Chi-Square Statistic:
\chi^2 = \sum \dfrac{(O_i - E_i)^2}{E_i} = \dfrac{(10 - 13.5)^2}{13.5} + \dfrac{(20 - 15.75)^2}{15.75} + \dfrac{(15 - 15.75)^2}{15.75} + \cdots
Calculate the sum to get the chi-square value.
Multiple Choice Questions
Question 1: What does a contingency table display?
A. The frequency distribution of a single categorical variable
B. The relationship between two categorical variables
C. The distribution of a quantitative variable
D. The correlation between two quantitative variables
Answer: B. The relationship between two categorical variables
Explanation: A contingency table displays the frequency distribution of two categorical variables, showing their relationship.
Question 2: What is the purpose of the chi-square test of independence?
A. To determine the mean of two categorical variables
B. To find the correlation between two quantitative variables
C. To test if there is a significant association between two categorical variables
D. To compare the variances of two samples
Answer: C. To test if there is a significant association between two categorical variables
Explanation: The chi-square test of independence determines if there is a significant association between two categorical variables.
Question 3: How do you calculate the expected frequency in a contingency table?
A. Divide the cell frequency by the total number of observations
B. Multiply the row total by the column total and divide by the grand total
C. Subtract the mean from the observed frequency
D. Sum the frequencies of all cells in the table
Answer: B. Multiply the row total by the column total and divide by the grand total
Explanation: The expected frequency in a contingency table is calculated by multiplying the row total by the column total and then dividing by the grand total.