In AP Statistics, confidence intervals for the slope of a regression model are used to estimate the range within which the true slope of the population regression line is likely to fall, based on sample data. This interval provides a measure of the precision of the slope estimate and reflects the uncertainty due to sampling variability. The slope itself represents the relationship between the independent variable X and the dependent variable Y, indicating the expected change in Y for a one-unit change in X. By constructing a confidence interval, students can assess whether this relationship is statistically significant and estimate the true strength of the association within a specified level of confidence, typically 95%. Understanding and interpreting these intervals is crucial for making informed conclusions about the data in real-world contexts.
Learning Objectives
By studying confidence intervals for the slope of a regression model, you will be able to interpret the range within which the true slope of the population regression line is likely to fall. The process of calculating and constructing these intervals will be understood, along with their significance in determining the reliability of the estimated slope. Additionally, you will gain the ability to assess whether the relationship between variables is statistically significant and apply this knowledge in various real-world scenarios.
Linear Regression Model

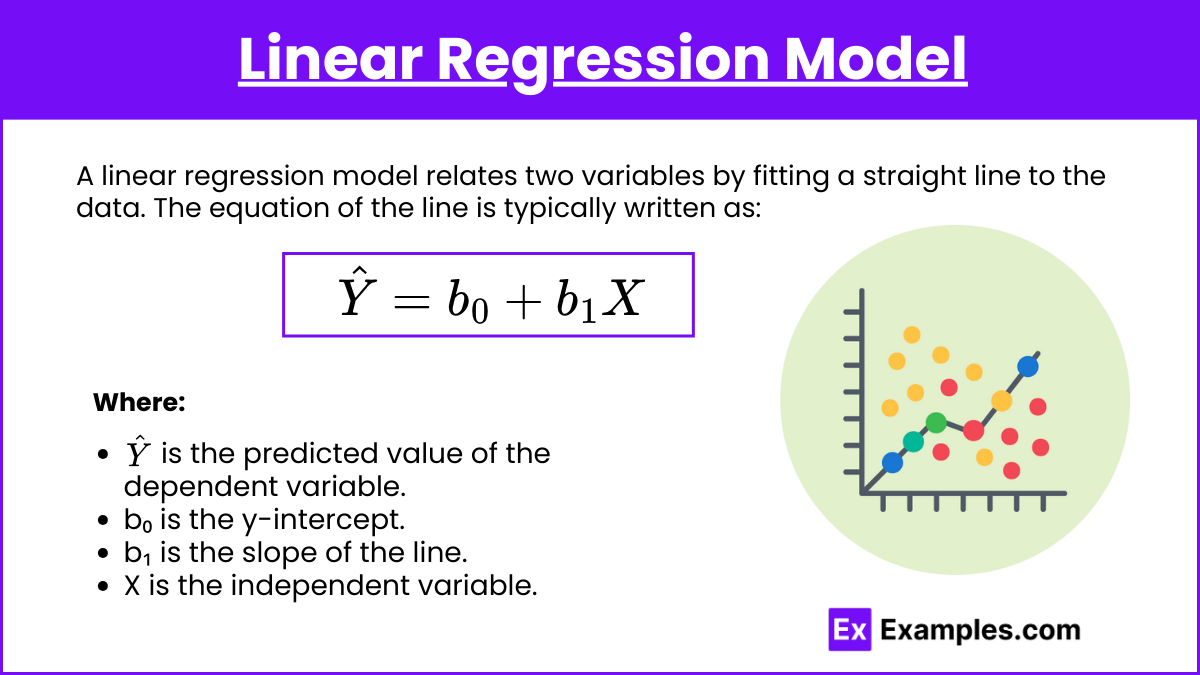
A linear regression model relates two variables by fitting a straight line to the data. The equation of the line is typically written as:
Where:
is the predicted value of the dependent variable.
b₀ is the y-intercept.
b₁ is the slope of the line.
X is the independent variable.
Interpretation of the Slope
The slope b₁ indicates the expected change in the dependent variable Y for a one-unit change in the independent variable X.
Standard Error of the Slope

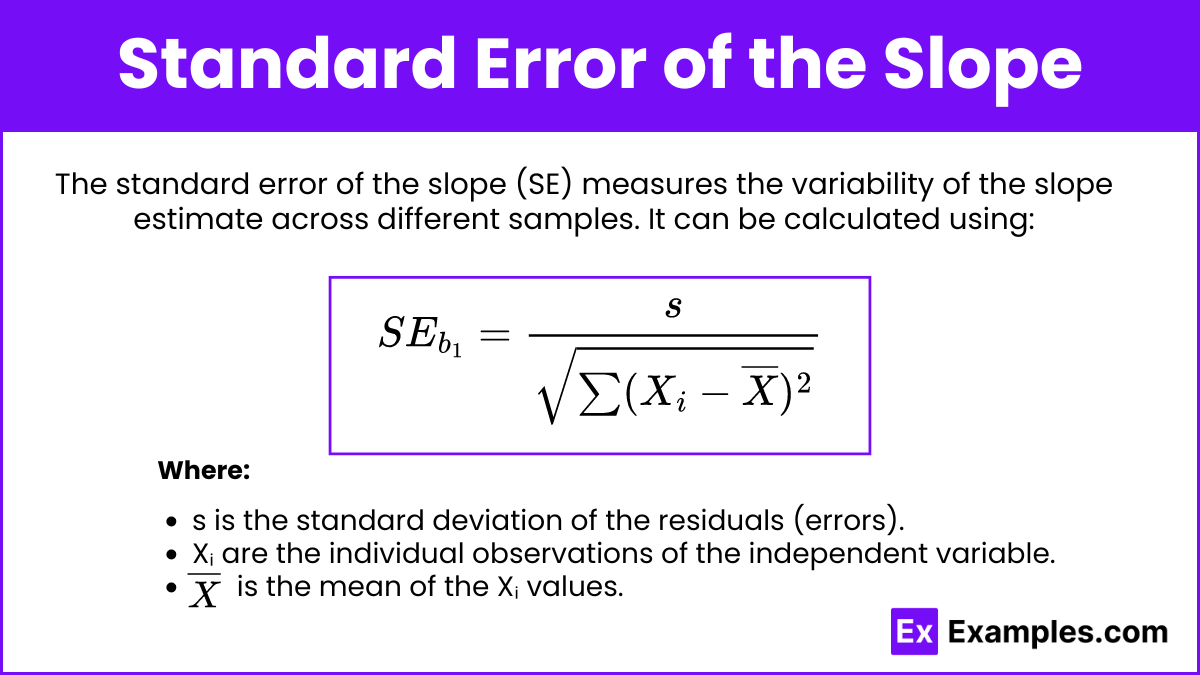
The standard error of the slope (SE) measures the variability of the slope estimate across different samples. It can be calculated using:
Where:
s is the standard deviation of the residuals (errors).
Xᵢ are the individual observations of the independent variable.
is the mean of the Xᵢ values.
Confidence Interval Formula
The confidence interval for the slope b₁ is given by:
Where:
b₁ is the sample estimate of the slope.
t* is the critical value from the t-distribution, depending on the confidence level (e.g., 95%) and degrees of freedom (df=n−2, where n is the sample size).
Interpreting the Confidence Interval
A 95% confidence interval for the slope suggests that if we took many samples and calculated the interval for each, approximately 95% of those intervals would contain the true slope of the population regression line.
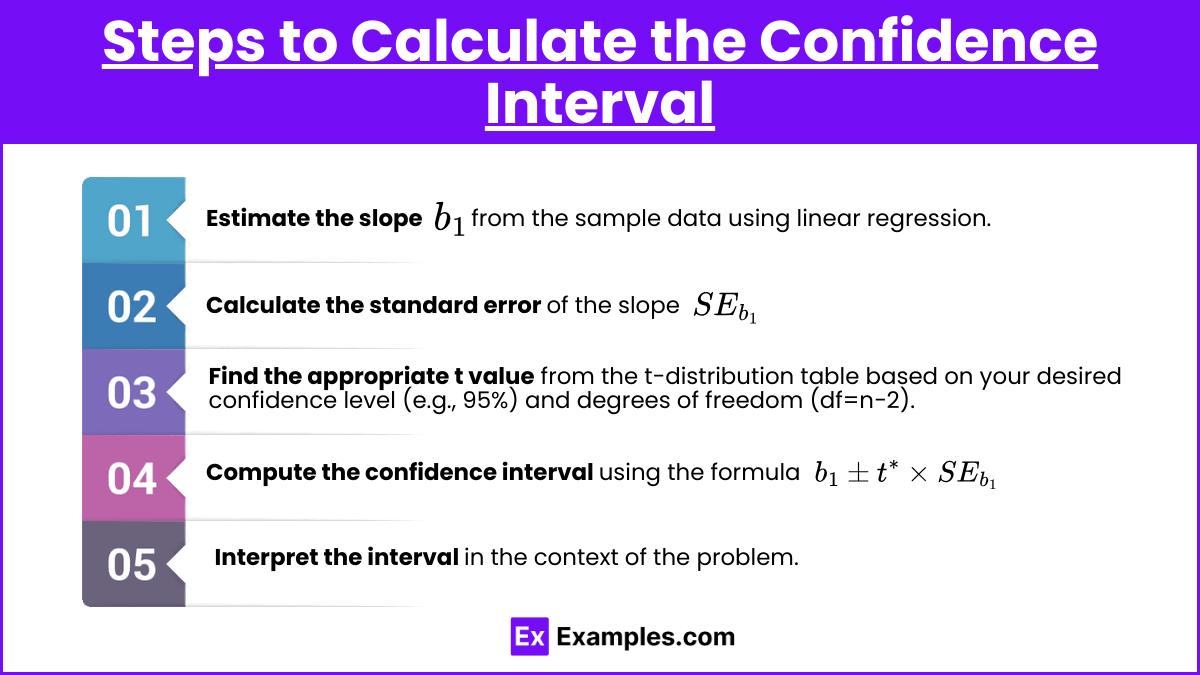
Steps to Calculate the Confidence Interval

Estimate the slope from the sample data using linear regression.
Calculate the standard error of the slope .
Find the appropriate t value from the t-distribution table based on your desired confidence level (e.g., 95%) and degrees of freedom (df=n−2).
Compute the confidence interval using the formula .
Interpret the interval in the context of the problem.
Examples
Example 1
A study measures the relationship between hours studied and test scores. The estimated slope of the regression line is b₁=2.5, with a standard error . For a 95% confidence interval and df=18, the t* value is 2.101.
Solution:
Confidence Interval: [1.45,3.55][1.45, 3.55][1.45,3.55]
Example 2
An economist examines the relationship between income and expenditure. The slope b₁=0.8 with . For a 90% confidence level and df=28, the t* value is 1.701.
Solution:
Confidence Interval: [0.4598,1.1402][0.4598, 1.1402][0.4598,1.1402]
Example 3
A biologist studies the effect of temperature on plant growth. The estimated slope is b₁=−1.3, with a standard error of . For a 99% confidence interval and df=15, the t* value is 2.947.
Solution:
Confidence Interval: [−2.1841,−0.4159][-2.1841, -0.4159][−2.1841,−0.4159]
Example 4
A researcher finds a slope b₁=1.75 with a standard error of for the relationship between two chemical concentrations. Using a 95% confidence interval and df=12, t*=2.179.
Solution:
Confidence Interval: [1.20525,2.29475][1.20525, 2.29475][1.20525,2.29475]
Example 5
A sociologist studies the impact of education level on salary. The estimated slope b₁=0.45 with a standard error . For a 95% confidence interval and df=10, t* is 2.228.
Solution:
Confidence Interval: [0.2272,0.6728][0.2272, 0.6728][0.2272,0.6728]
Multiple Choice Questions (MCQs)
MCQ 1
Question: If the slope of a regression line is 3.2 with a standard error of 0.6, and the t* value for a 95% confidence interval is 2.042, what is the confidence interval for the slope?
a) [2.08,4.32][2.08, 4.32][2.08,4.32]
b) [2.58,3.82][2.58, 3.82][2.58,3.82]
c) [1.98,4.42][1.98, 4.42][1.98,4.42]
d) [1.52,4.88][1.52, 4.88][1.52,4.88]
Answer: b) [2.58,3.82][2.58, 3.82][2.58,3.82]
Explanation:
Confidence interval: [2.58,3.82][2.58, 3.82][2.58,3.82].
MCQ 2
Question: What does the confidence interval for the slope in a regression model estimate?
a) The range of values for the dependent variable Y.
b) The range of values for the intercept of the regression line.
c) The range of values for the slope of the population regression line.
d) The mean value of the independent variable X.
Answer: c) The range of values for the slope of the population regression line.
Explanation:
The confidence interval estimates the plausible range of values for the true slope of the population regression line.
MCQ 3
Question: If the confidence interval for the slope of a regression model does not include zero, what can be inferred?
a) The independent variable X has no effect on Y.
b) There is no linear relationship between X and Y.
c) The independent variable X is significantly associated with Y.
d) The regression model is not appropriate.
Answer: c) The independent variable X is significantly associated with Y.
Explanation:
If the confidence interval does not include zero, it suggests a significant linear relationship between the variables, meaning that X has an effect on Y.


