Share :

Constructing and Interpreting a Confidence Interval for a Population Mean

In AP Statistics, confidence intervals and hypothesis tests for the difference of two proportions are essential tools for comparing two population proportions. These techniques help us determine whether the observed difference between sample proportions is statistically significant or if it could have occurred by random chance. By constructing a confidence interval, we estimate the range in which the true difference between the two population proportions lies, with a specified level of confidence. Hypothesis testing, on the other hand, allows us to formally assess whether there is enough evidence to conclude that the population proportions differ. These methods are widely used in real-world scenarios, such as comparing success rates in different treatments or preferences between two groups.
Learning Objectives
By studying this topic, you will be able to construct and interpret confidence intervals for a population mean effectively. You will learn to calculate confidence intervals using both the Z-distribution and t-distribution, depending on whether the population standard deviation is known. The importance of selecting appropriate confidence levels and understanding the margin of error will be emphasized. Additionally, you will be guided on how to interpret the interval in context, helping you make informed inferences about the population mean.
What is a Confidence Interval?
A confidence interval is a range of values, derived from sample data, that is likely to contain the population mean. The interval has an associated confidence level that quantifies the level of confidence that the interval contains the population parameter. This is a fundamental concept in inferential statistics, especially in estimating the mean of a population based on a sample.
Confidence Level
The confidence level is the probability that the confidence interval actually includes the population mean. Common confidence levels include 90%, 95%, and 99%. A 95% confidence level means that if we were to take 100 different samples and compute a confidence interval for each, we would expect about 95 of the intervals to contain the population mean.
Formula for Confidence Interval
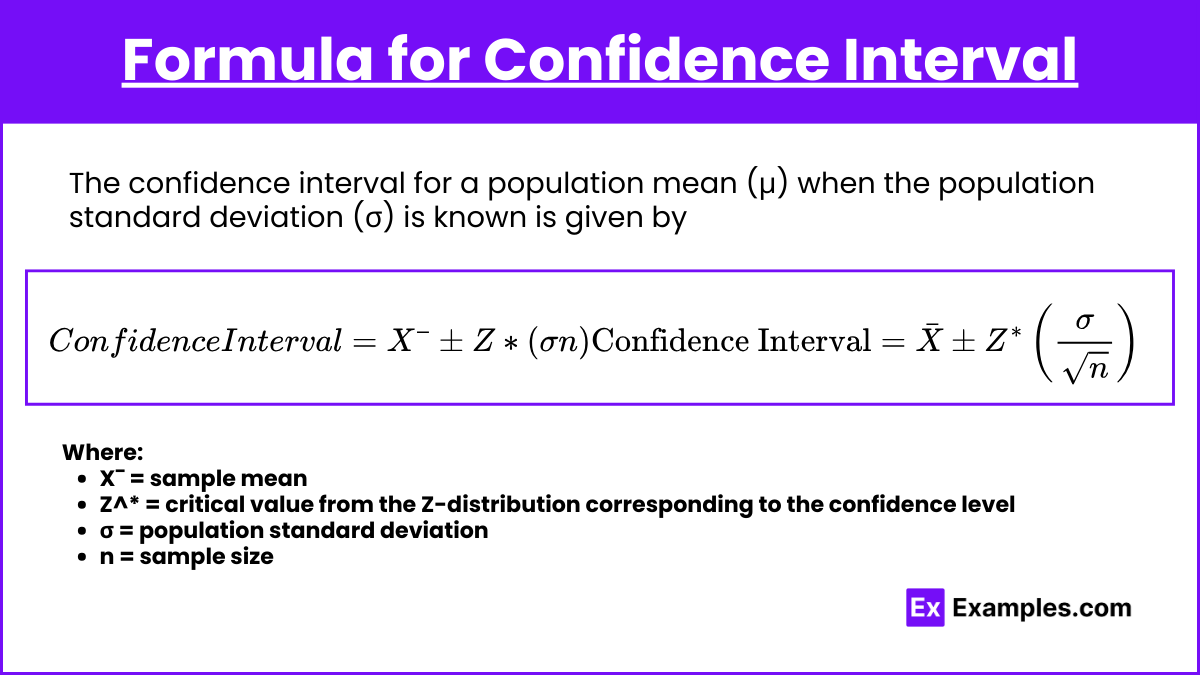
The confidence interval for a population mean (μ) when the population standard deviation (σ) is known is given by:
Confidence Interval=Xˉ±Z∗(σn)\text{Confidence Interval} = \bar{X} \pm Z^* \left(\frac{\sigma}{\sqrt{n}}\right)
Where:
- Xˉ = sample mean
- Z^* = critical value from the Z-distribution corresponding to the confidence level
- σ = population standard deviation
- n = sample size
If the population standard deviation (σ) is unknown, the sample standard deviation (s) is used, and the t-distribution is applied instead of the Z-distribution:
Confidence Interval=Xˉ±t∗(sn)\text{Confidence Interval} = \bar{X} \pm t^* \left(\frac{s}{\sqrt{n}}\right)Confidence Interval=Xˉ±t∗(ns)
Where:
- t^* = critical value from the t-distribution corresponding to the confidence level and degrees of freedom (df = n – 1)
Steps to Construct a Confidence Interval
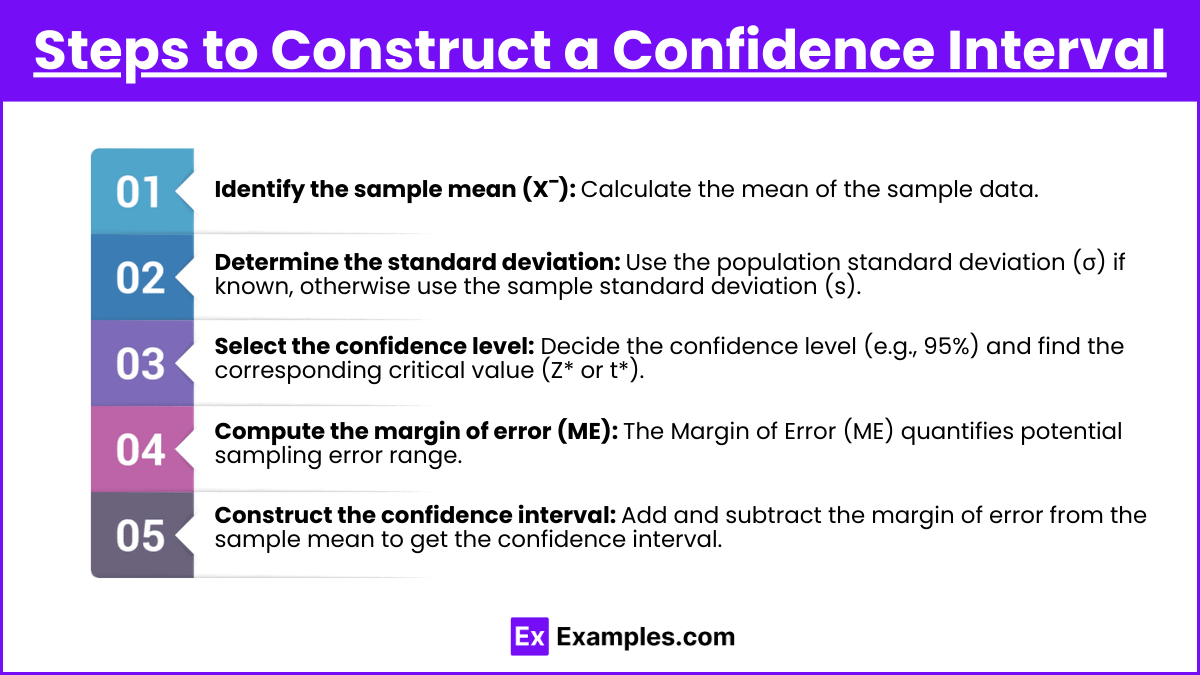
- Identify the sample mean (Xˉ): Calculate the mean of the sample data.
- Determine the standard deviation: Use the population standard deviation (σ) if known, otherwise use the sample standard deviation (s).
- Select the confidence level: Decide the confidence level (e.g., 95%) and find the corresponding critical value (Z* or t*).
- Compute the margin of error (ME): Calculate the margin of error using the formula ME=Z∗(σn)ME = Z^* \left(\frac{\sigma}{\sqrt{n}}\right)ME=Z∗(nσ) or ME=t∗(sn)ME = t^* \left(\frac{s}{\sqrt{n}}\right)ME=t∗(ns).
- Construct the confidence interval: Add and subtract the margin of error from the sample mean to get the confidence interval.
Interpreting a Confidence Interval
When interpreting a confidence interval, it’s important to understand that the interval provides a range of plausible values for the population mean. For example, if we compute a 95% confidence interval for the mean height of adult men as 68 ± 2 inches, we can say, “We are 95% confident that the true mean height of adult men is between 66 and 70 inches.”
Examples
Example 1: Known Population Standard Deviation
A company wants to estimate the average weight of their product. They randomly sample 50 units and find a sample mean of 10.2 kg with a known population standard deviation of 0.5 kg. Construct a 95% confidence interval for the true mean weight.
- Xˉ=10.2\bar{X} = 10.2Xˉ=10.2 kg
- σ=0.5\sigma = 0.5σ=0.5 kg
- n=50n = 50n=50
- Z∗=1.96Z^* = 1.96Z∗=1.96 (for 95% confidence level)
ME=1.96×(0.550)=0.138ME = 1.96 \times \left(\frac{0.5}{\sqrt{50}}\right) = 0.138ME=1.96×(500.5)=0.138 Confidence Interval=10.2±0.138=(10.062,10.338)\text{Confidence Interval} = 10.2 \pm 0.138 = (10.062, 10.338)Confidence Interval=10.2±0.138=(10.062,10.338)
Interpretation: We are 95% confident that the true mean weight of the product is between 10.062 kg and 10.338 kg.
Example 2: Unknown Population Standard Deviation
Suppose the same company does not know the population standard deviation and uses the sample standard deviation of 0.6 kg instead. Construct a 95% confidence interval for the true mean weight.
- s=0.6s = 0.6s=0.6 kg
- t∗t^*t∗ (with df = 49) ≈ 2.009
ME=2.009×(0.650)=0.17ME = 2.009 \times \left(\frac{0.6}{\sqrt{50}}\right) = 0.17ME=2.009×(500.6)=0.17 Confidence Interval=10.2±0.17=(10.03,10.37)\text{Confidence Interval} = 10.2 \pm 0.17 = (10.03, 10.37)Confidence Interval=10.2±0.17=(10.03,10.37)
Interpretation: We are 95% confident that the true mean weight of the product is between 10.03 kg and 10.37 kg.
Example 3: Small Sample Size
A researcher wants to estimate the average time spent on homework by high school students. They sample 10 students, finding a mean of 3 hours with a standard deviation of 1 hour. Construct a 90% confidence interval for the true mean time.
- Xˉ=3\bar{X} = 3Xˉ=3 hours
- s=1s = 1s=1 hour
- n=10n = 10n=10
- t∗t^*t∗ (with df = 9) ≈ 1.833
ME=1.833×(110)=0.58ME = 1.833 \times \left(\frac{1}{\sqrt{10}}\right) = 0.58ME=1.833×(101)=0.58 Confidence Interval=3±0.58=(2.42,3.58)\text{Confidence Interval} = 3 \pm 0.58 = (2.42, 3.58)Confidence Interval=3±0.58=(2.42,3.58)
Interpretation: We are 90% confident that the true mean time spent on homework by high school students is between 2.42 and 3.58 hours.
Example 4: Large Sample Size
A survey is conducted to estimate the average amount of money spent on textbooks by college students per semester. A random sample of 200 students finds an average of $300 with a standard deviation of $75. Construct a 99% confidence interval for the population mean.
- Xˉ=300\bar{X} = 300Xˉ=300 dollars
- s=75s = 75s=75 dollars
- n=200n = 200n=200
- t∗t^*t∗ (with df = 199) ≈ 2.576
ME=2.576×(75200)=13.64ME = 2.576 \times \left(\frac{75}{\sqrt{200}}\right) = 13.64ME=2.576×(20075)=13.64 Confidence Interval=300±13.64=(286.36,313.64)\text{Confidence Interval} = 300 \pm 13.64 = (286.36, 313.64)Confidence Interval=300±13.64=(286.36,313.64)
Interpretation: We are 99% confident that the true mean amount of money spent on textbooks by college students per semester is between $286.36 and $313.64.
Example 5: Proportions and Means
A teacher wants to estimate the average test score in her class. She randomly selects 25 test scores and calculates a mean of 78 and a standard deviation of 8. Construct a 95% confidence interval for the true mean test score.
- Xˉ=78\bar{X} = 78Xˉ=78
- s=8s = 8s=8
- n=25n = 25n=25
- t∗t^*t∗ (with df = 24) ≈ 2.064
ME=2.064×(825)=3.30ME = 2.064 \times \left(\frac{8}{\sqrt{25}}\right) = 3.30ME=2.064×(258)=3.30 Confidence Interval=78±3.30=(74.7,81.3)\text{Confidence Interval} = 78 \pm 3.30 = (74.7, 81.3)Confidence Interval=78±3.30=(74.7,81.3)
Interpretation: We are 95% confident that the true mean test score is between 74.7 and 81.3.
Multiple Choice Questions
Question 1
Which of the following statements correctly interprets a 95% confidence interval of (15, 25) for a population mean?
A) The probability that the true mean is between 15 and 25 is 0.95.
B) 95% of the sample data falls between 15 and 25.
C) We are 95% confident that the sample mean is between 15 and 25.
D) We are 95% confident that the true population mean is between 15 and 25.
Answer: D
Explanation: The correct interpretation of a 95% confidence interval is that we are 95% confident that the interval contains the true population mean.
Question 2
If you increase the confidence level from 90% to 99%, what happens to the width of the confidence interval?
A) The interval width decreases.
B) The interval width stays the same.
C) The interval width increases.
D) The effect on the width cannot be determined.
Answer: C
Explanation: Increasing the confidence level increases the critical value, which in turn increases the margin of error, resulting in a wider confidence interval.
Question 3
A 95% confidence interval for a population mean is calculated as (50, 60). What does this mean in context?
A) The sample mean is 55.
B) The population mean is definitely between 50 and 60.
C) 95% of the sample data lies between 50 and 60.
D) We are 95% confident that the population mean lies between 50 and 60.
Answer: D
Explanation: The correct interpretation of the confidence interval is that we are 95% confident that the interval from 50 to 60 contains the true population mean.