
Constructing and Interpreting a Confidence interval for a population proportion


 is the sample proportion.
 is the critical value from the standard normal distribution for the desired confidence level.


 .
.


![0.60 \pm 0.0678 = [0.5322, 0.6678]](https://www.examples.com/wp-content/ql-cache/quicklatex.com-b42c1b478438605bedb0efd6a5b9731e_l3.svg "Rendered by QuickLaTeX.com")


![0.55 \pm 0.036 = [0.514, 0.586]](https://www.examples.com/wp-content/ql-cache/quicklatex.com-05e5db806361d067ffacaaeb45aaedfc_l3.svg "Rendered by QuickLaTeX.com")


![0.40 \pm 0.045 = [0.355, 0.445]](https://www.examples.com/wp-content/ql-cache/quicklatex.com-f3badb554c8d5f72a683b629411e6729_l3.svg "Rendered by QuickLaTeX.com")


![0.70 \pm 0.038 = [0.662, 0.738]](https://www.examples.com/wp-content/ql-cache/quicklatex.com-741c2ba8b2020612e9a2854305756078_l3.svg "Rendered by QuickLaTeX.com")


![0.70 \pm 0.035 = [0.665, 0.735]](https://www.examples.com/wp-content/ql-cache/quicklatex.com-c668f2c11fc2b2004fab8e05f0b430b8_l3.svg "Rendered by QuickLaTeX.com")


![0.50 \pm 0.025 = [0.475, 0.525]](https://www.examples.com/wp-content/ql-cache/quicklatex.com-774589fa541437bd574d77d57548b2d5_l3.svg "Rendered by QuickLaTeX.com")


![0.60 \pm 0.049 = [0.551, 0.649]](https://www.examples.com/wp-content/ql-cache/quicklatex.com-0a5fd7cd7986a4f71aa7cf071f9b0605_l3.svg "Rendered by QuickLaTeX.com")
In AP Statistics, constructing and interpreting a confidence interval for a population proportion is crucial for estimating the true proportion within a population based on sample data. A confidence interval provides a range of plausible values for the population proportion, offering a measure of the estimate's reliability. This topic involves calculating the sample proportion, determining the margin of error, and using critical values to establish the interval, enabling statisticians to make informed decisions with a specified level of confidence.
Learning Objectives
You will be able to understand the concept of a population proportion and the importance of estimating it accurately. The process of calculating sample proportions will be learned, along with determining critical values for different confidence levels. You will be guided through the steps of constructing a confidence interval and interpreting its meaning in the context of real-world data. Additionally, the ability to assess the reliability of the interval through the margin of error will be developed.
Key Concepts
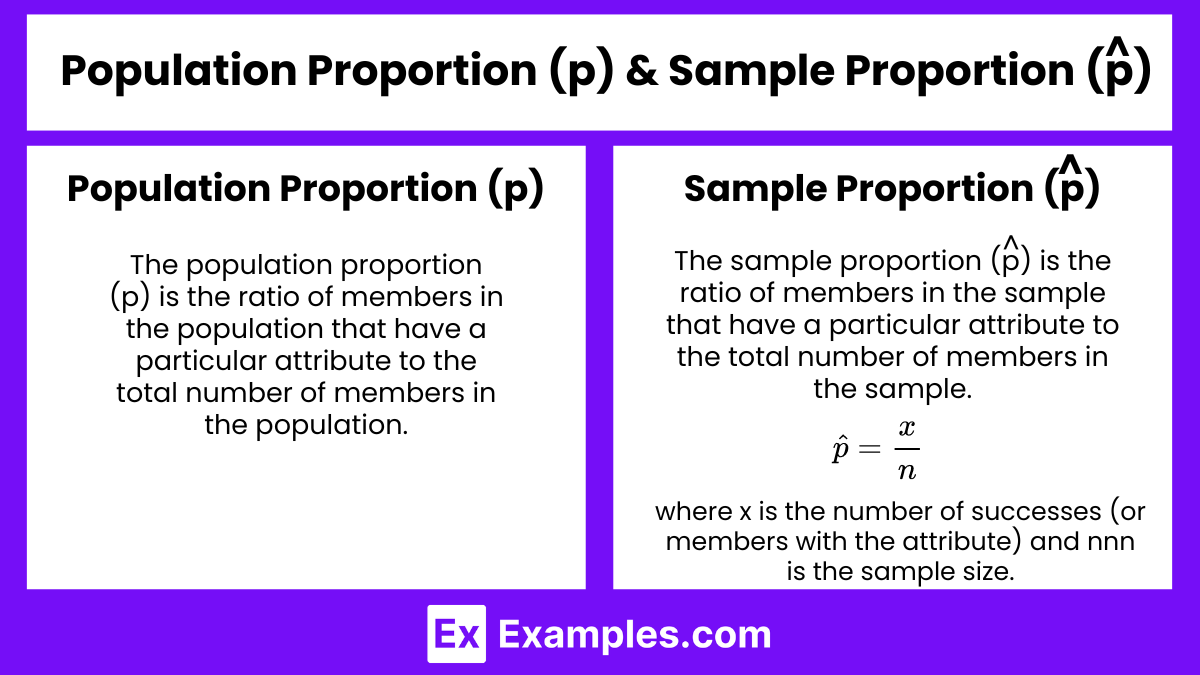
Population Proportion (p)
The population proportion (p) is the ratio of members in the population that have a particular attribute to the total number of members in the population.
Sample Proportion
The sample proportion is the ratio of members in the sample that have a particular attribute to the total number of members in the sample.
where x is the number of successes (or members with the attribute) and nnn is the sample size.
Confidence Interval Formula
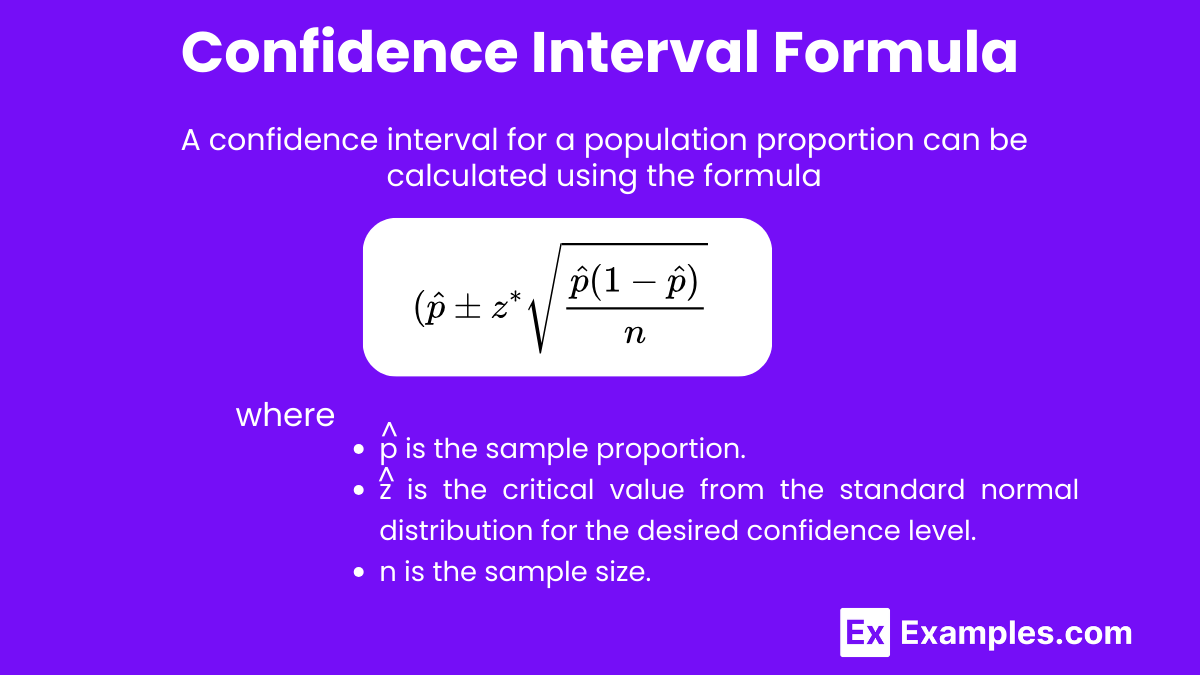
A confidence interval for a population proportion can be calculated using the formula:
where:
is the sample proportion.
is the critical value from the standard normal distribution for the desired confidence level.
n is the sample size.
Critical Value
The critical value depends on the confidence level (CCC):
For a 90\% confidence level,
For a 95\% confidence level,
For a 99\% confidence level,
Margin of Error (ME)
The margin of error is the range above and below the sample proportion and is calculated as:
Interpreting the Confidence Interval
A confidence interval gives a range within which we can be reasonably certain the population proportion lies. For example, a 95% confidence interval means we are 95% confident that the interval contains the true population proportion.
Steps to Construct a Confidence Interval
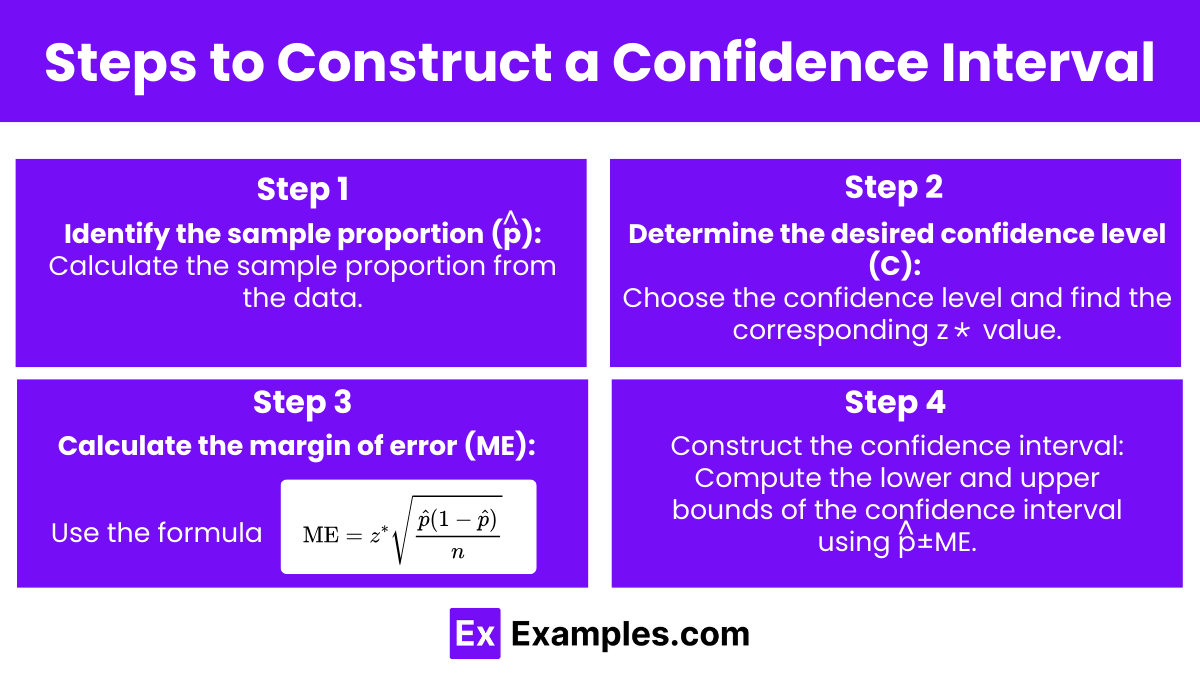
Identify the sample proportion : Calculate the sample proportion from the data.
Determine the desired confidence level (CCC): Choose the confidence level and find the corresponding value.
Calculate the margin of error (ME): Use the formula
Construct the confidence interval: Compute the lower and upper bounds of the confidence interval using .
Examples
Example 1
A survey of 200 people finds that 120 prefer brand A. Construct a 95% confidence interval for the proportion of the population that prefers brand A.
Sample proportion =
Confidence level=
Margin of error=
Confidence interval=
Example 2
In a poll of 500 voters, 275 say they support a new policy. Construct a 90% confidence interval for the population proportion that supports the policy.
Sample proportion =
Confidence level =
Margin of error =
Confidence interval &=
Example 3
Out of 800 surveyed individuals, 320 are in favor of a new law. Construct a 99% confidence interval for the population proportion that supports the law.
Sample proportion = \frac{320}{800} = 0.40 $
Confidence level=
Margin of error=
Confidence interval=
Example 4
A company finds that 150 out of 600 sampled customers are satisfied with their service. Construct a 95% confidence interval for the proportion of satisfied customers.
Sample proportion =
Confidence level =
Margin of error =
Confidence interval =
Example 5
A researcher surveys 1,000 people and finds that 700 believe in climate change. Construct a 99% confidence interval for the proportion of people who believe in climate change.
Sample proportion =
Confidence level =
Margin of error =
Confidence interval =
Multiple-Choice Questions (MCQs)
Question 1
A sample of 400 students finds that 280 favor a new cafeteria menu. What is the 95% confidence interval for the proportion of students favoring the new menu?
A. [0.665, 0.735]
B. [0.665, 0.775]
C. [0.675, 0.725]
D. [0.645, 0.755]
Answer: A
Explanation:
Sample proportion =
Margin of error =
Confidence interval=
Question 2
In a survey of 1,200 people, 600 express satisfaction with a product. What is the 90% confidence interval for the proportion of satisfied customers?
A. [0.465, 0.535]
B. [0.485, 0.515]
C. [0.465, 0.515]
D. [0.485, 0.535]
Answer: C
Explanation:
Sample proportion &=
Margin of error=
Confidence interval=
Question 3
A survey of 500 voters shows that 300 support a particular candidate. Construct a 99% confidence interval for the proportion of voters who support the candidate.
A. [0.561, 0.639]
B. [0.531, 0.669]
C. [0.551, 0.649]
D. [0.541, 0.659]
Answer: C
Explanation:
Sample proportion =
Margin of error=
Confidence interval= $0.60 \pm 0.049 = [0.551, 0.649]$