
Departures From Linearity

![\[x = [1, 2, 3, 4, 5] \]](https://www.examples.com/wp-content/ql-cache/quicklatex.com-0e770714e3330301d95dcb743f19c0d8_l3.svg "Rendered by QuickLaTeX.com")
![\[y = [2, 4, 9, 16, 25]\]](https://www.examples.com/wp-content/ql-cache/quicklatex.com-ede32ba2fbeff6866bfd0e3e6a0a2118_l3.svg "Rendered by QuickLaTeX.com")
![\[y = x^2\]](https://www.examples.com/wp-content/ql-cache/quicklatex.com-ef78422a955d90d074bb4630ab565160_l3.svg "Rendered by QuickLaTeX.com")
![\[y = [2, 4, 8, 16, 32]\]](https://www.examples.com/wp-content/ql-cache/quicklatex.com-d1545a9820fd921fd5fe5fce1205f7b6_l3.svg "Rendered by QuickLaTeX.com")
![\[y = 2x\]](https://www.examples.com/wp-content/ql-cache/quicklatex.com-f651d4cd7fbbf4ce8c5cf947eacc4153_l3.svg "Rendered by QuickLaTeX.com")
![\[y = [0.7, 1.0, 1.2, 1.4, 1.5]\]](https://www.examples.com/wp-content/ql-cache/quicklatex.com-6f88e10388723423bd08ac6568270490_l3.svg "Rendered by QuickLaTeX.com")
![\[ y = \log(x)\]](https://www.examples.com/wp-content/ql-cache/quicklatex.com-a82c5579db160937313df830fb8c35c7_l3.svg "Rendered by QuickLaTeX.com")
![\[y = [1, 2, 3, 4, 10]\]](https://www.examples.com/wp-content/ql-cache/quicklatex.com-51d2ee2b0be218eff37ae49685e6d0e3_l3.svg "Rendered by QuickLaTeX.com")
![\[x = [1, 2, 3, 4, 5, 6] \]](https://www.examples.com/wp-content/ql-cache/quicklatex.com-f8f958bf47e995fb4c25f001ba808935_l3.svg "Rendered by QuickLaTeX.com")
![\[y = [2, 4, 6, 8, 10, 50]\]](https://www.examples.com/wp-content/ql-cache/quicklatex.com-690456a58f04e69fa1d6c61ef235817b_l3.svg "Rendered by QuickLaTeX.com")
In AP Statistics, understanding departures from linearity is essential for accurately analyzing data. Departures occur when the relationship between variables cannot be represented by a straight line, indicating that a linear model may not be suitable. Identifying these deviations involves examining residual plots for patterns such as curvature, heteroscedasticity, outliers, and clusters. Recognizing and addressing these departures ensures the use of appropriate models, enhancing the accuracy and reliability of statistical analyses.
Learning Objectives
By studying departures from linearity, I will learn how to identify when data does not fit a linear model in AP Statistics. I will analyze residual plots to detect patterns like curvature, heteroscedasticity, outliers, and clusters. Understanding these departures will help me choose appropriate models and apply transformations to improve accuracy. Mastering these skills will enable me to accurately interpret data and enhance my statistical analysis capabilities.
Definition of Linearity
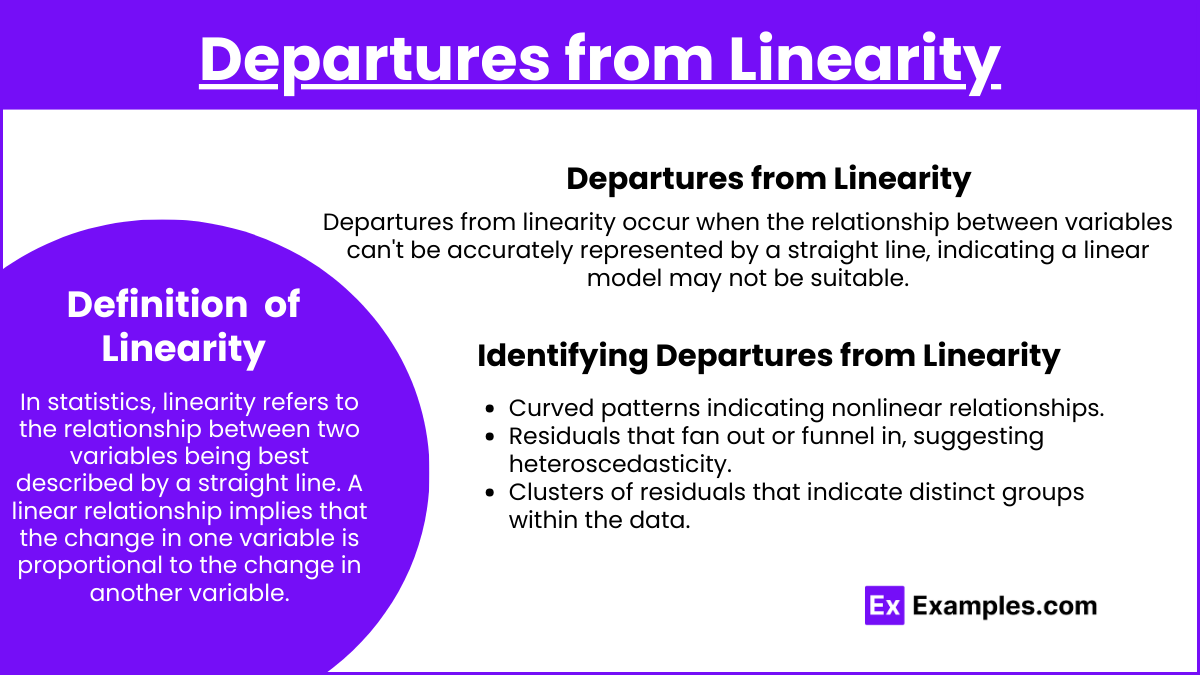
In statistics, linearity refers to the relationship between two variables being best described by a straight line. A linear relationship implies that the change in one variable is proportional to the change in another variable.
Departures from Linearity
Departures from linearity occur when the relationship between the independent and dependent variables cannot be accurately represented by a straight line. These departures indicate that a linear model may not be appropriate for the data.
Types of Departures from Linearity
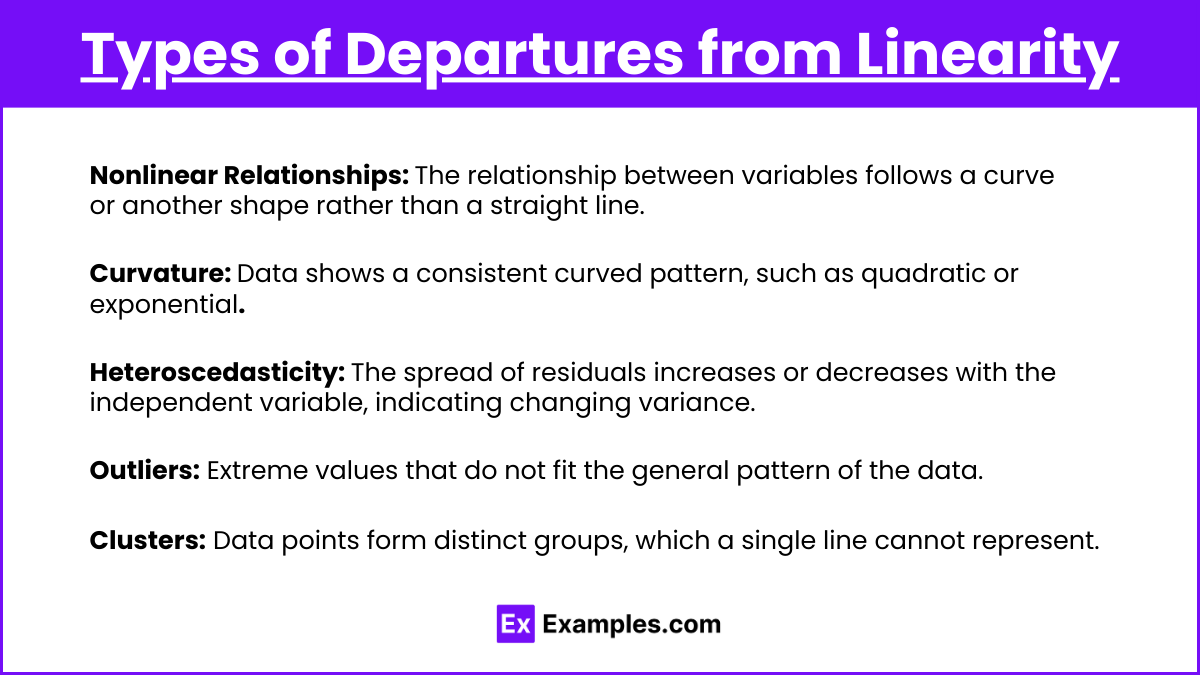
Nonlinear Relationships: The relationship between variables follows a curve or another shape rather than a straight line.
Curvature: Data shows a consistent curved pattern, such as quadratic or exponential.
Heteroscedasticity: The spread of residuals increases or decreases with the independent variable, indicating changing variance.
Outliers: Extreme values that do not fit the general pattern of the data.
Clusters: Data points form distinct groups, which a single line cannot represent.
Identifying Departures from Linearity
To identify departures from linearity, analyze residual plots and look for patterns or trends that deviate from random scatter. Common signs include:
Curved patterns indicating nonlinear relationships.
Residuals that fan out or funnel in, suggesting heteroscedasticity.
Clusters of residuals that indicate distinct groups within the data.
Methods to Address Departures from Linearity
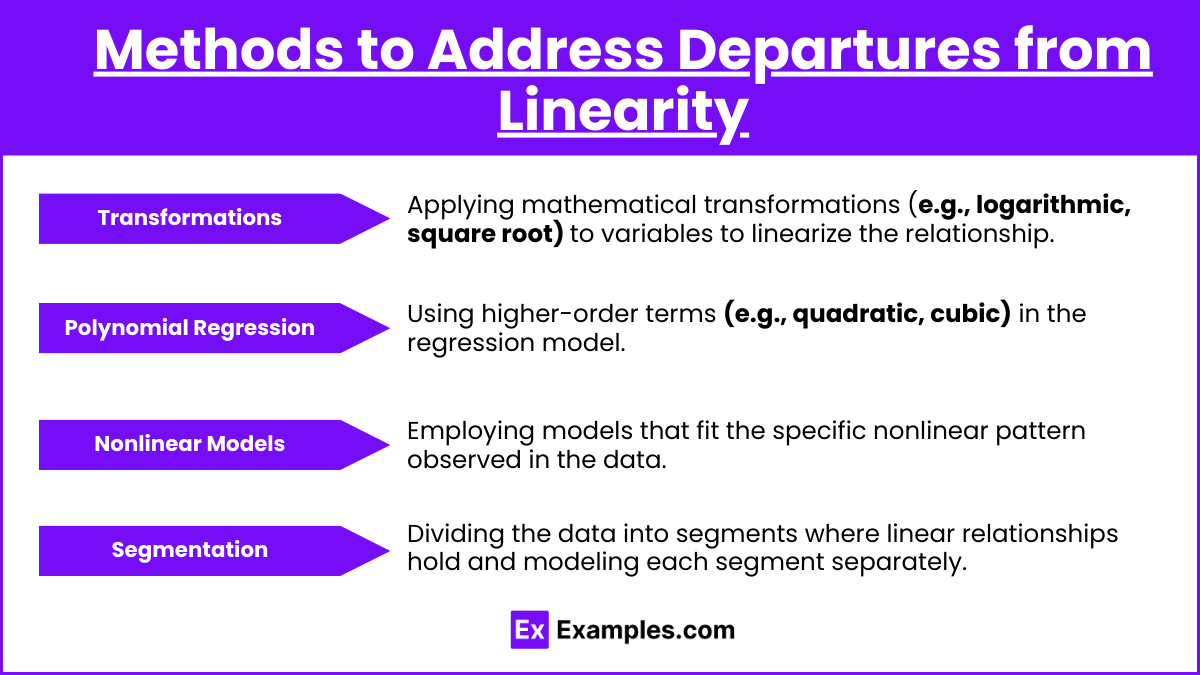
Transformations: Applying mathematical transformations (e.g., logarithmic, square root) to variables to linearize the relationship.
Polynomial Regression: Using higher-order terms (e.g., quadratic, cubic) in the regression model.
Nonlinear Models: Employing models that fit the specific nonlinear pattern observed in the data.
Segmentation: Dividing the data into segments where linear relationships hold and modeling each segment separately.
Examples
Example 1: Quadratic Relationship
Consider the dataset:
x = [1, 2, 3, 4, 5]
y = [2, 4, 9, 16, 25]
A linear model does not fit this data well, as the relationship is quadratic y = x^2
Example 2: Exponential Growth
Given the dataset:
x = [1, 2, 3, 4, 5]
y = [2, 4, 8, 16, 32]
This data shows an exponential growth pattern, where y = 2x
Example 3: Logarithmic Relationship
Consider the data:
x = [1, 2, 3, 4, 5]
y = [0.7, 1.0, 1.2, 1.4, 1.5]
A logarithmic transformation y = \log(x) fits the data better than a linear model.
Example 4: Heteroscedasticity
Given the dataset:
x = [1, 2, 3, 4, 5]
y = [1, 2, 3, 4, 10]
The residuals show increasing variance, indicating heteroscedasticity. A transformation might be needed to stabilize variance.
Example 5: Outliers
Consider the dataset:
x = [1, 2, 3, 4, 5, 6]
y = [2, 4, 6, 8, 10, 50]
The value (6,50)(6, 50)(6,50) is an outlier, significantly deviating from the linear trend.
Multiple Choice Questions
MCQ 1
Which pattern in a residual plot indicates a departure from linearity?
Random scatter
A horizontal line
A curved pattern
Residuals near zero
Answer: 3. A curved pattern
Explanation: A curved pattern in the residual plot suggests that the relationship between the variables is nonlinear.
MCQ 2
What should you consider if you notice heteroscedasticity in your residual plot?
Adding polynomial terms
Logarithmic transformation
Ignoring the residuals
Removing data points
Answer: 2. Logarithmic transformation
Explanation: Heteroscedasticity can often be addressed by applying transformations like the logarithmic transformation to stabilize the variance.
MCQ 3
Which method can help fit data that shows a nonlinear relationship?
Linear regression
Polynomial regression
Ignoring the nonlinearity
Using the same linear model
Answer: 2. Polynomial regression
Explanation: Polynomial regression can model nonlinear relationships by including higher-order terms in the regression equation.