
Describing Associations in Bivariate Data and Interpreting Correlation

In AP Statistics, understanding how to describe associations in bivariate data and interpret correlation is essential. This involves analyzing the relationship between two quantitative variables, determining the direction, form, and strength of their association. Students learn to calculate and interpret the correlation coefficient rrr, which quantifies the linear relationship between variables. Mastery of these concepts is crucial for effectively analyzing data and making informed statistical inferences
Learning Objectives
By studying associations in bivariate data and interpreting correlation in AP Statistics, I will learn to analyze the relationship between two quantitative variables. I will identify the direction, form, and strength of associations, and calculate the correlation coefficient rrr. I will understand how to interpret the value of rrr to assess the linear relationship between variables. Mastering these skills will enhance my ability to make informed conclusions based on bivariate data analysis.
Introduction to Bivariate Data
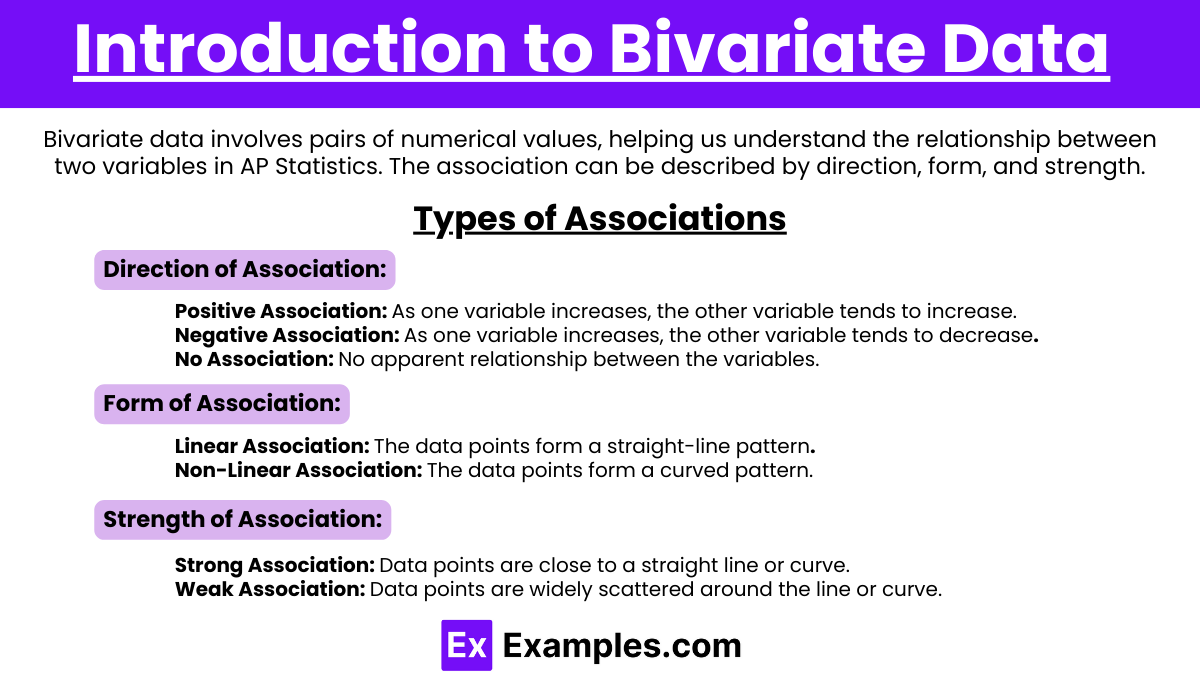
Bivariate data involves pairs of numerical values. In AP Statistics, analyzing bivariate data helps us understand the relationship between two variables. The association between these variables can be described in terms of direction, form, and strength.
Types of Associations
- Direction of Association:
- Positive Association: As one variable increases, the other variable tends to increase.
- Negative Association: As one variable increases, the other variable tends to decrease.
- No Association: No apparent relationship between the variables.
- Form of Association:
- Linear Association: The data points form a straight-line pattern.
- Non-Linear Association: The data points form a curved pattern.
- Strength of Association:
- Strong Association: Data points are close to a straight line or curve.
- Weak Association: Data points are widely scattered around the line or curve.
Interpreting Correlation
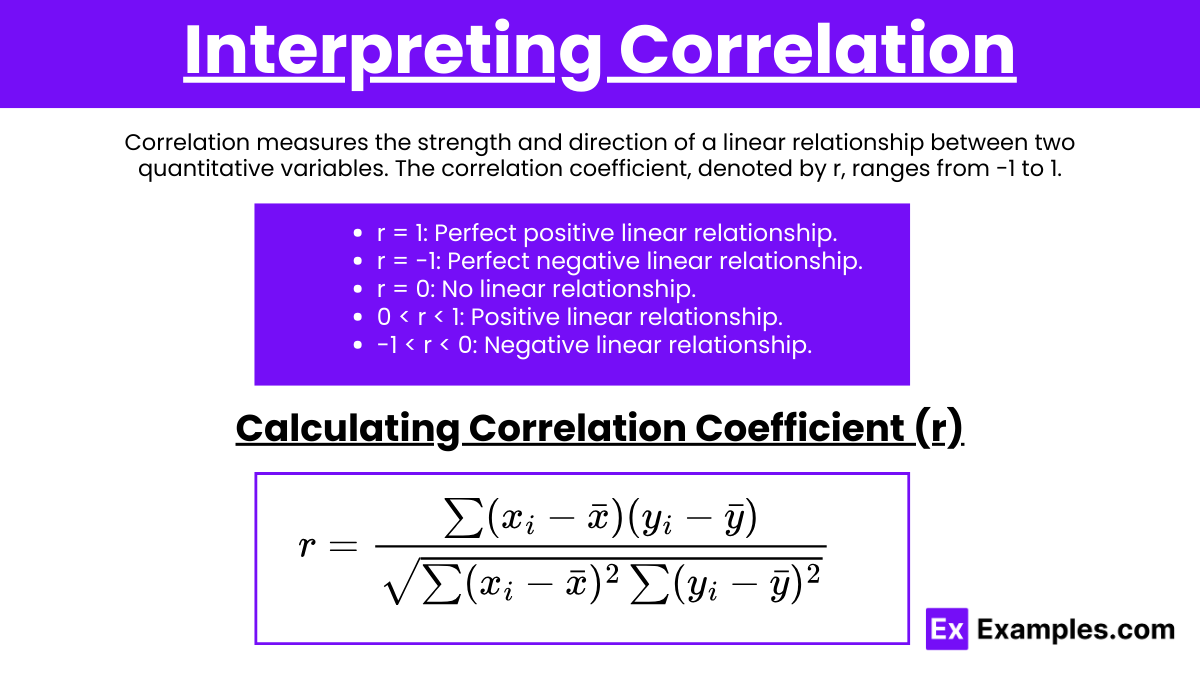
Correlation measures the strength and direction of a linear relationship between two quantitative variables. The correlation coefficient, denoted by r, ranges from -1 to 1.
- r = 1: Perfect positive linear relationship.
- r = -1: Perfect negative linear relationship.
- r = 0: No linear relationship.
- 0 < r < 1: Positive linear relationship.
- -1 < r < 0: Negative linear relationship.
Calculating Correlation Coefficient (r)
The formula for the correlation coefficient is:
![\[r = \frac{\sum (x_i - \bar{x})(y_i - \bar{y})}{\sqrt{\sum (x_i - \bar{x})^2 \sum (y_i - \bar{y})^2}}\]](https://www.examples.com/wp-content/ql-cache/quicklatex.com-9b6681e8827f0f373a5cf745610f0c0c_l3.png "Rendered by QuickLaTeX.com")
Where:
![\[\bullet \, x_i \, \text{and} \, y_i \, \text{are individual data points.} \\\bullet \, \bar{x} \, \text{and} \, \bar{y} \, \text{are the means of the} \, x \, \text{and} \, y \, \text{variables.}\]](https://www.examples.com/wp-content/ql-cache/quicklatex.com-e9359a738e85b13b15e1a4364a4d8daa_l3.png "Rendered by QuickLaTeX.com")
Examples
Example 1: Height and Weight
- Data: A sample of 10 individuals with their heights (in inches) and weights (in pounds).
- Description: Typically shows a positive linear association. Taller individuals tend to weigh more.
Example 2: Study Hours and Test Scores
- Data: A sample of 10 students with the number of hours studied and their test scores.
- Description: Generally shows a positive linear association. More study hours tend to result in higher test scores.
Example 3: Temperature and Ice Cream Sales
- Data: A sample of 10 days with daily temperature (in °F) and ice cream sales (in dollars).
- Description: Shows a positive linear association. Higher temperatures often lead to increased ice cream sales.
Example 4: Age and Reaction Time
- Data: A sample of 10 individuals with their ages and reaction times (in seconds).
- Description: Often shows a negative linear association. Older individuals tend to have slower reaction times.
Example 5: Advertising Expenditure and Sales Revenue
- Data: A sample of 10 companies with their advertising expenditures (in dollars) and sales revenues (in dollars).
- Description: Shows a positive linear association. Higher advertising expenditures typically result in higher sales revenues.
Multiple-Choice Questions
Question 1
Which of the following values of the correlation coefficient rrr indicates the strongest linear relationship? a) -0.85 b) 0.50 c) -0.95 d) 0.70
Answer: c) -0.95
Explanation: The closer the value of rrr is to -1 or 1, the stronger the linear relationship. -0.95 indicates a very strong negative linear relationship.
Question 2
If the scatter plot of two variables shows a downward trend from left to right, the correlation between the variables is likely: a) Positive b) Negative c) Zero d) Undefined
Answer: b) Negative
Explanation: A downward trend indicates that as one variable increases, the other variable decreases, which is characteristic of a negative correlation.
Question 3
A correlation coefficient of 0.00 indicates: a) A perfect positive linear relationship. b) A perfect negative linear relationship. c) No linear relationship. d) A weak positive relationship.
Answer: c) No linear relationship.
Explanation: A correlation coefficient of 0.00 suggests that there is no linear relationship between the two variables.