

Interpreting a p-value and Justifying a Claim About a Population Mean

In AP Statistics, interpreting a p-value is a fundamental concept used to make decisions about population means based on sample data. The p-value helps us determine whether the observed data provides sufficient evidence to reject the null hypothesis, which typically represents a default or no-effect assumption about the population. By comparing the p-value to a chosen significance level, we can justify whether a claim about the population mean is statistically significant. Understanding this process is crucial for making informed inferences and drawing conclusions in various real-world contexts.
Learning Objectives
In this lesson, you will be guided on how to interpret p-values and justify claims about population means. Mastery of this topic will enable you to correctly apply hypothesis testing, calculate p-values, and make informed decisions about rejecting or failing to reject null hypotheses. You will gain the ability to connect statistical outcomes to real-world scenarios, enhancing your understanding of statistical inference and decision-making processes in AP Statistics.
What is a p-value?
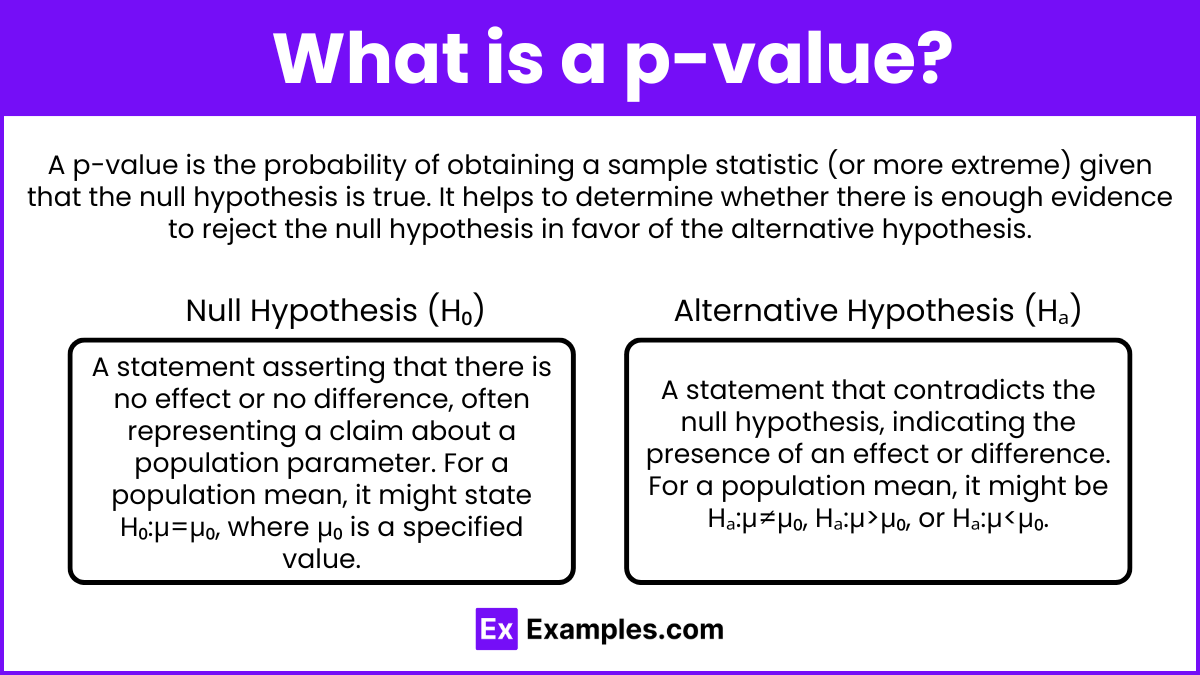
A p-value is the probability of obtaining a sample statistic (or more extreme) given that the null hypothesis is true. It helps to determine whether there is enough evidence to reject the null hypothesis in favor of the alternative hypothesis.
Null Hypothesis (H₀): A statement asserting that there is no effect or no difference, often representing a claim about a population parameter. For a population mean, it might state H₀:μ=μ₀, where μ₀ is a specified value.
Alternative Hypothesis (Hₐ): A statement that contradicts the null hypothesis, indicating the presence of an effect or difference. For a population mean, it might be Hₐ:μ≠μ₀, Hₐ:μ>μ₀, or Hₐ:μ<μ₀.
Interpreting the p-value
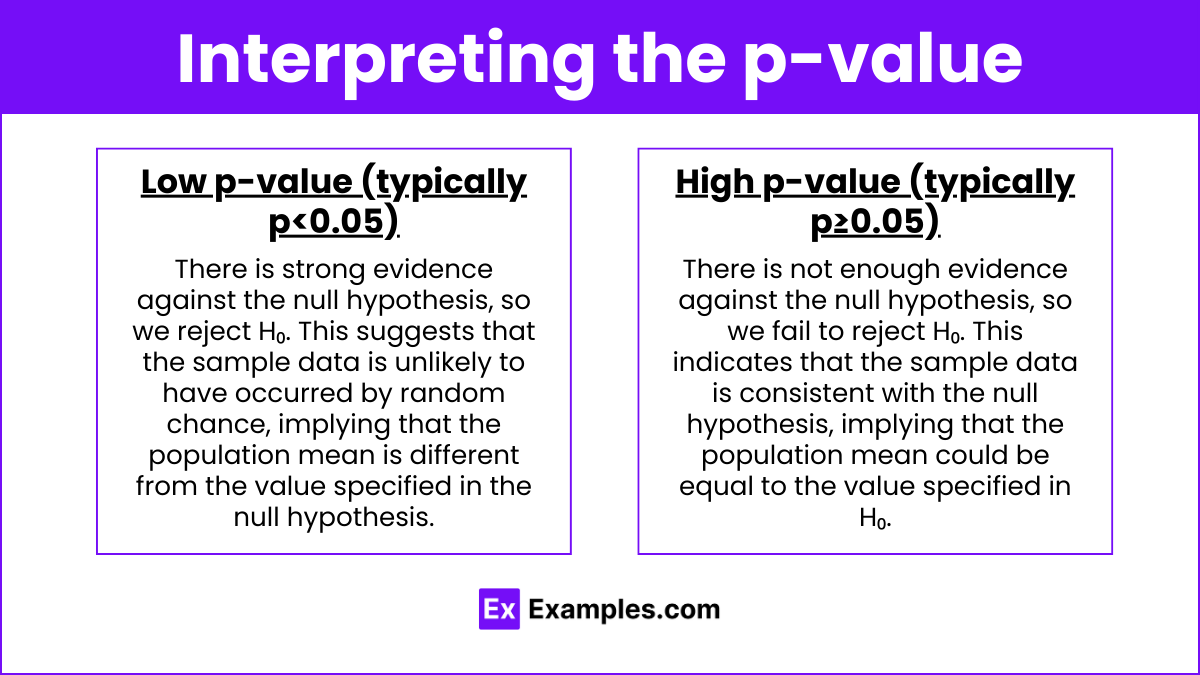
Low p-value (typically p<0.05): There is strong evidence against the null hypothesis, so we reject H₀. This suggests that the sample data is unlikely to have occurred by random chance, implying that the population mean is different from the value specified in the null hypothesis.
High p-value (typically p≥0.05): There is not enough evidence against the null hypothesis, so we fail to reject H₀. This indicates that the sample data is consistent with the null hypothesis, implying that the population mean could be equal to the value specified in H₀.
Justifying a Claim About a Population Mean
To justify a claim about a population mean, we follow these steps:
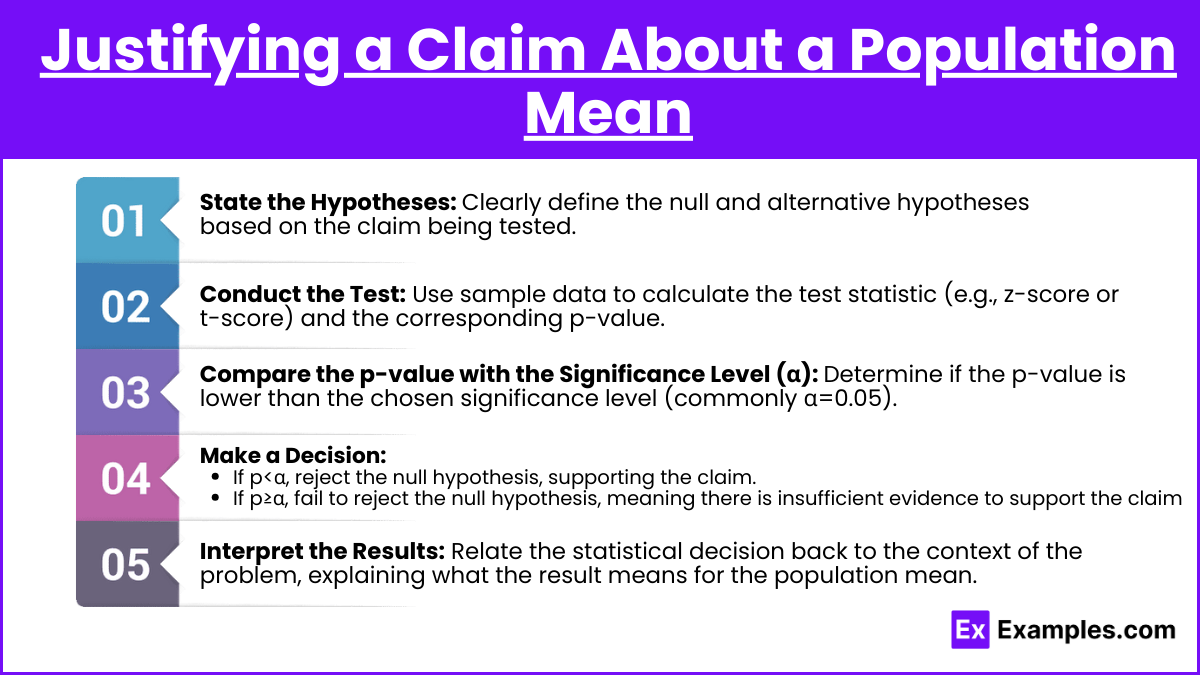
State the Hypotheses: Clearly define the null and alternative hypotheses based on the claim being tested.
Conduct the Test: Use sample data to calculate the test statistic (e.g., z-score or t-score) and the corresponding p-value.
Compare the p-value with the Significance Level (α): Determine if the p-value is lower than the chosen significance level (commonly α=0.05).
Make a Decision:
If p<α, reject the null hypothesis, supporting the claim.
If p≥α, fail to reject the null hypothesis, meaning there is insufficient evidence to support the claim.
Interpret the Results: Relate the statistical decision back to the context of the problem, explaining what the result means for the population mean.
Examples
Example 1
Claim: The average weight of apples in a farm is 150 grams.
Null Hypothesis: H₀:μ=150grams
Alternative Hypothesis: Hₐ:μ≠150grams
Test Result: p-value = 0.03
Interpretation: Since p=0.03<0.05, we reject the null hypothesis. There is strong evidence to suggest that the average weight of apples is different from 150 grams.
Example 2
Claim: The mean exam score of students is at least 75.
Null Hypothesis: H₀:μ=75
Alternative Hypothesis: Hₐ:μ<75
Test Result: p-value = 0.12
Interpretation: Since p=0.12≥0.05, we fail to reject the null hypothesis. There is insufficient evidence to support the claim that the mean exam score is less than 75.
Example 3
Claim: The mean annual income of employees in a company is greater than $50,000.
Null Hypothesis: H₀:μ=50,000
Alternative Hypothesis: Hₐ:μ>50,000
Test Result: p-value = 0.01
Interpretation: Since p=0.01<0.05, we reject the null hypothesis. There is strong evidence to support the claim that the mean annual income is greater than 50,000.
Example 4
Claim: The average time spent on a website is 8 minutes.
Null Hypothesis: H₀:μ=8 minutes
Alternative Hypothesis: Hₐ:μ≠8 minutes
Test Result: p-value = 0.47
Interpretation: Since p=0.47≥0.05, we fail to reject the null hypothesis. There is insufficient evidence to suggest that the average time spent on the website is different from 8 minutes.
Example 5
Claim: The mean lifetime of a battery is less than 1000 hours.
Null Hypothesis: H₀:μ=1000hours
Alternative Hypothesis: Hₐ:μ<1000 hours
Test Result: p-value = 0.04
Interpretation: Since p=0.04<0.05, we reject the null hypothesis. There is evidence to support the claim that the mean lifetime of the battery is less than 1000 hours.
Multiple-Choice Questions (MCQs)
MCQ 1
A researcher claims that the average height of a species of plant is 15 cm. A random sample of 40 plants is taken, and the test yields a p-value of 0.02. What should the researcher conclude at a 5% significance level?
A) Fail to reject the null hypothesis; there is no evidence to support the claim.
B) Reject the null hypothesis; there is evidence to support the claim.
C) Fail to reject the null hypothesis; there is insufficient evidence against the claim.
D) Reject the null hypothesis; there is no evidence to support the claim.
Answer: B
Explanation: Since p=0.02<0.05, we reject the null hypothesis, indicating that there is evidence to suggest that the average height is different from 15 cm.
MCQ 2
A factory manager claims that the mean production time per unit is 2 hours. A hypothesis test is conducted, resulting in a p-value of 0.09. What can be concluded at a 10% significance level?
A) Fail to reject the null hypothesis; there is no evidence to support the claim.
B) Reject the null hypothesis; there is evidence to support the claim.
C) Fail to reject the null hypothesis; there is insufficient evidence against the claim.
D) Reject the null hypothesis; there is insufficient evidence to support the claim.
Answer: B
Explanation: Since p=0.09<0.10, we reject the null hypothesis, meaning there is evidence to suggest that the mean production time per unit is different from 2 hours.
MCQ 3
A study tests the hypothesis that the average sleep time of adults is 7 hours. The calculated p-value is 0.45. At a 5% significance level, what should the researcher conclude?
A) Fail to reject the null hypothesis; the average sleep time is 7 hours.
B) Reject the null hypothesis; the average sleep time is not 7 hours.
C) Fail to reject the null hypothesis; there is insufficient evidence to say the average sleep time is different from 7 hours.
D) Reject the null hypothesis; the average sleep time is different from 7 hours.
Answer: C
Explanation: Since p=0.45≥0.05, we fail to reject the null hypothesis, indicating insufficient evidence to claim that the average sleep time is different from 7 hours.