Share :

Interpreting a P-value And Justifying a Claim About a Population Proportion

 indicates strong evidence against the null hypothesis, leading to its rejection.
 suggests weak evidence against the null hypothesis, so it is not rejected.
 .
. (two-tailed test),
  (right-tailed test), or
  (left-tailed test).


 . There is not enough evidence to support the claim.


 . The evidence is insufficient to refute the claim.


 . The evidence is not strong enough to support the researcher’s claim.


 , fail to reject


 , fail to reject
 AP Statistics emphasizes the critical understanding of interpreting a P-value, a key concept in hypothesis testing. A P-value measures the probability of obtaining results as extreme as those observed, assuming the null hypothesis is true. This concept is particularly important when justifying claims about a population proportion, where students must evaluate evidence to either support or refute a hypothesis. Mastery of P-value interpretation is essential for success in AP Statistics, ensuring accurate conclusions based on statistical data.
Learning Objectives
You will be able to interpret P-values effectively in the context of hypothesis testing by the end of this topic. A deeper understanding of how to justify or refute claims about population proportions will be developed. You will also be equipped to compare P-values with significance levels to make informed decisions in statistical analysis. The ability to apply these skills will be strengthened, enhancing your overall competence in AP Statistics.
What is a P-value?
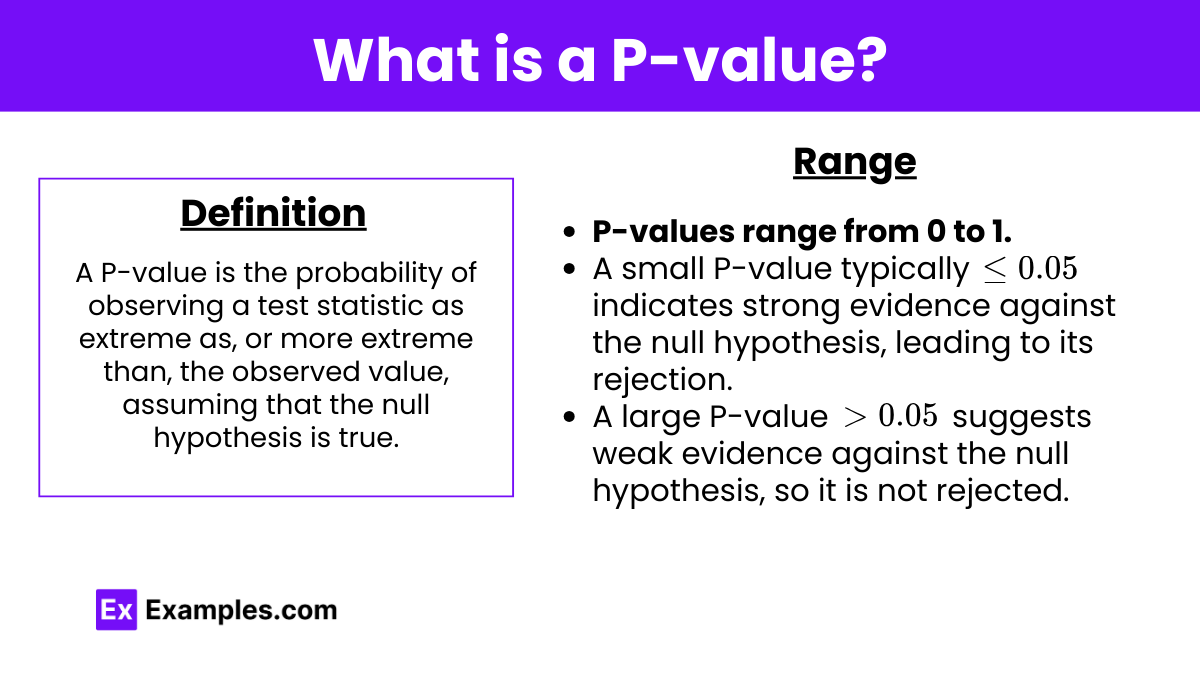
Definition: A P-value is the probability of observing a test statistic as extreme as, or more extreme than, the observed value, assuming that the null hypothesis is true.
Range: P-values range from 0 to 1.
A small P-value indicates strong evidence against the null hypothesis, leading to its rejection.
A large P-value suggests weak evidence against the null hypothesis, so it is not rejected.
Hypothesis Testing for a Population Proportion
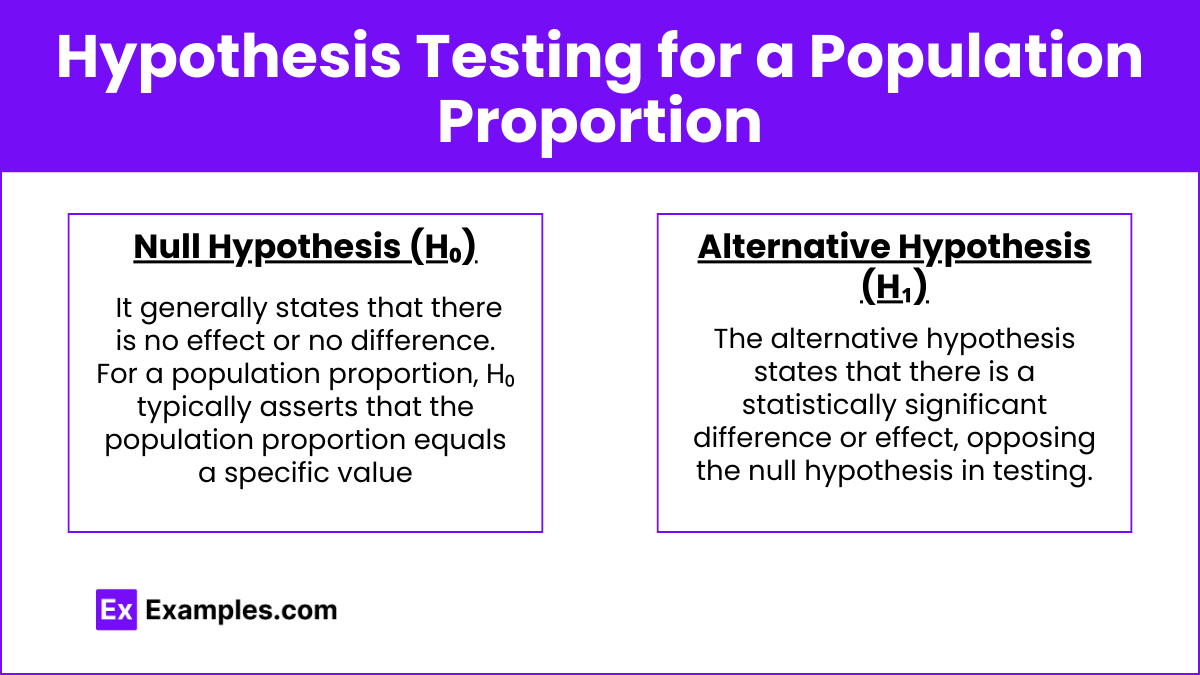
Null Hypothesis (H₀): It generally states that there is no effect or no difference. For a population proportion, H₀ typically asserts that the population proportion equals a specific value .
Alternative Hypothesis (H₁): It represents what you aim to support.
For example, (two-tailed test), (right-tailed test), or (left-tailed test).
Steps for Hypothesis Testing
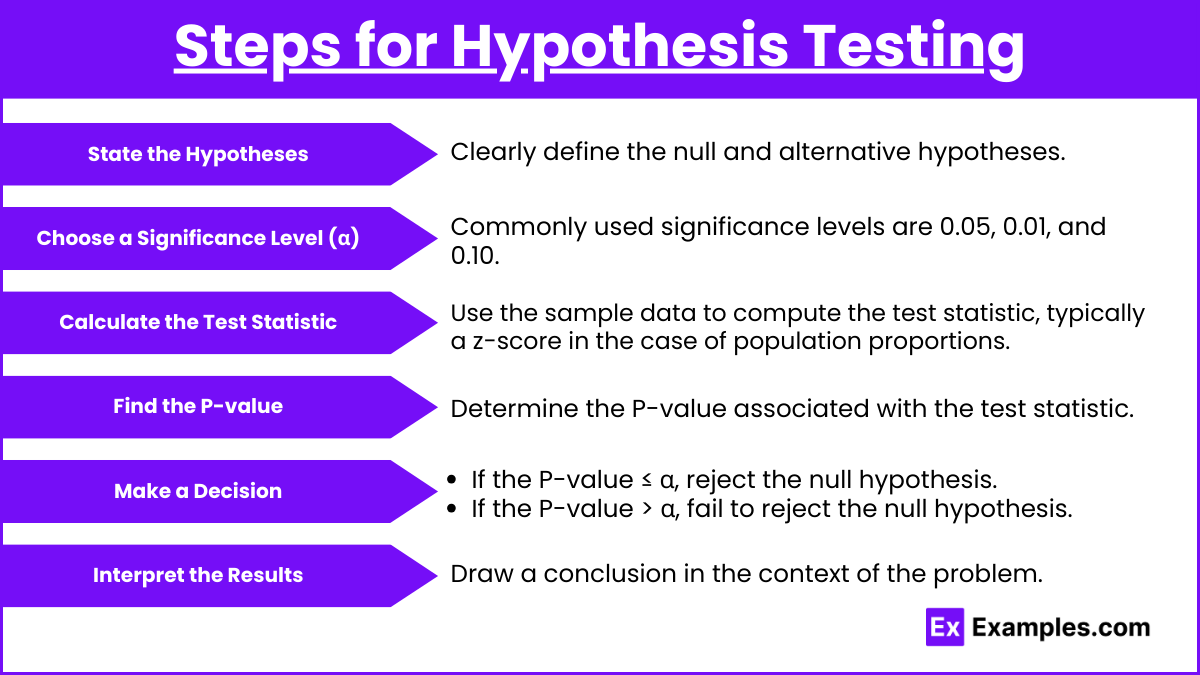
State the Hypotheses: Clearly define the null and alternative hypotheses.
Choose a Significance Level (α): Commonly used significance levels are 0.05, 0.01, and 0.10.
Calculate the Test Statistic: Use the sample data to compute the test statistic, typically a z-score in the case of population proportions.
Find the P-value: Determine the P-value associated with the test statistic.
Make a Decision:
If the P-value ≤ α, reject the null hypothesis.
If the P-value > α, fail to reject the null hypothesis.
Interpret the Results: Draw a conclusion in the context of the problem.
Interpreting the P-value
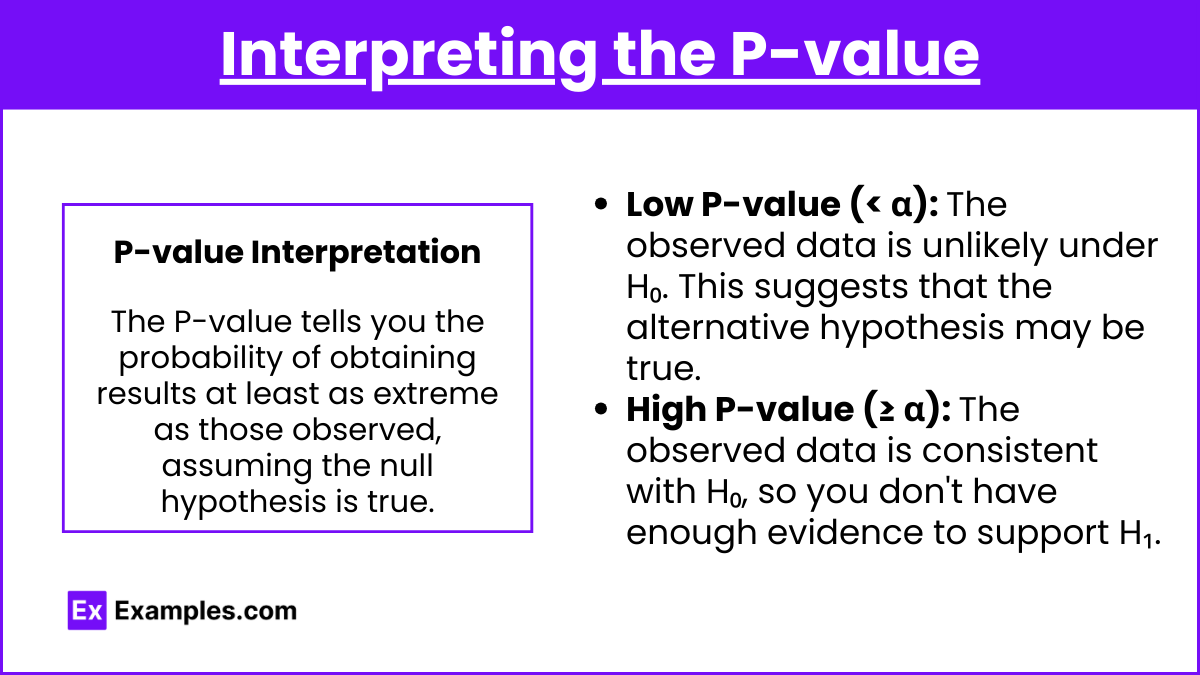
P-value Interpretation: The P-value tells you the probability of obtaining results at least as extreme as those observed, assuming the null hypothesis is true.
Low P-value (< α): The observed data is unlikely under H₀. This suggests that the alternative hypothesis may be true.
High P-value (≥ α): The observed data is consistent with H₀, so you don't have enough evidence to support H₁.
Justifying a Claim About a Population Proportion
To justify a claim about a population proportion using a P-value:
Compare the P-value to the significance level (α).
Reject or fail to reject the null hypothesis based on the comparison.
State the conclusion in the context of the problem. If you reject H₀, you are justifying the claim that the population proportion is different from the hypothesized value.
Examples
Example 1:
Problem: A company claims that 60% of its customers are satisfied with their service. A survey of 100 customers finds that 65% are satisfied. Is there enough evidence at the 0.05 significance level to support the claim that more than 60% of customers are satisfied?
Solution:
H_1: p > 0.60$
Test statistic:
> 0.05H_0$$. There is not enough evidence to support the claim.
Example 2:
Problem: A school administrator claims that 75% of students are in favor of the new school policy. A random sample of 150 students shows that 110 favor the policy. Test the claim at the 0.01 significance level.
Solution:
Test statistic:
P-value = 0.0433
, fail to reject $. The evidence is insufficient to refute the claim.
Example 3:
Problem: In a survey, 55 out of 200 people said they prefer tea over coffee. A researcher believes that the true proportion of tea lovers is less than 30%. Test this claim at the 0.05 level.
Solution:
H_0: p = 0.30$
$$H_1: p < 0.30$
Test statistic:
Since P-value , fail to reject . The evidence is not strong enough to support the researcher's claim.
Example 4:
Problem: A pharmaceutical company claims that the success rate of a new drug is 80%. A study involving 400 patients shows that 310 were successfully treated. Is the company’s claim valid at a 0.01 significance level?
Solution:
Test statistic:
Since P-value , fail to reject . There is not enough evidence to reject the company's claim.
Example 5:
Problem: A dietitian believes that only 15% of adults eat the recommended five servings of fruits and vegetables per day. A survey of 500 adults shows that 85 eat the recommended servings. Test the dietitian's belief at a 0.10 significance level.
Solution:
Test statistic:
Since P-value , fail to reject . The survey does not provide enough evidence to refute the dietitian's belief.
Multiple-Choice Questions (MCQs)
MCQ 1: A company claims that 40% of its products are made from recycled materials. A random sample of 200 products shows that 90 are made from recycled materials. What is the P-value if you test the company’s claim at the 0.05 significance level?
A) 0.0455
B) 0.0789
C) 0.0232
D) 0.0567
Answer: B) 0.0789
Explanation: The test statistic z is calculated, and the P-value corresponding to z is approximately 0.0789. Since the P-value > 0.05, there is insufficient evidence to reject the company’s claim.
MCQ 2: If a P-value is 0.02 and the significance level is 0.05, what conclusion can be drawn?
A) Reject the null hypothesis; there is strong evidence against it.
B) Fail to reject the null hypothesis; there is strong evidence for it.
C) Fail to reject the null hypothesis; there is weak evidence against it.
D) Reject the null hypothesis; there is weak evidence against it.
Answer: A) Reject the null hypothesis; there is strong evidence against it.
Explanation: Since the P-value is less than the significance level, you reject the null hypothesis, indicating strong evidence against it.
MCQ 3: Which of the following correctly interprets a P-value of 0.35 in a hypothesis test?
A) There is a 35% chance that the null hypothesis is true.
B) There is a 35% chance that the alternative hypothesis is true.
C) There is a 35% probability of obtaining the observed results, assuming the null hypothesis is true.
D) There is a 35% probability that the null hypothesis is false.
Answer: C) There is a 35% probability of obtaining the observed results, assuming the null hypothesis is true.
Explanation: The P-value represents the probability of observing the test results under the assumption that the null hypothesis is true.