
Linear Regression Models

![\[\hat{y} = a + bx\]](https://www.examples.com/wp-content/ql-cache/quicklatex.com-6ead12484d7200214d748b693028d4cb_l3.svg "Rendered by QuickLaTeX.com")
![\[{y} = a + bx\]](https://www.examples.com/wp-content/ql-cache/quicklatex.com-e92800b762a7937446f3d542cd37d066_l3.svg "Rendered by QuickLaTeX.com")
![\[<span class="ql-right-eqno"> (1) </span><span class="ql-left-eqno"> </span><img src="https://www.examples.com/wp-content/ql-cache/quicklatex.com-c950140161a8b376048ed6a9bc9d097e_l3.png" height="44" width="490" class="ql-img-displayed-equation quicklatex-auto-format" alt="\begin{align*} b &= \frac{n(\sum xy) - (\sum x)(\sum y)}{n(\sum x^2) - (\sum x)^2} \ a &= \frac{\sum y - b(\sum x)}{n} \ a &= \bar{y} - b\bar{x} \end{align*}" title="Rendered by QuickLaTeX.com"/>\]](https://www.examples.com/wp-content/ql-cache/quicklatex.com-dbf9e898d1f167a72ae2847d30c2e463_l3.svg "Rendered by QuickLaTeX.com")
![\[\hat{y} = a + b\]](https://www.examples.com/wp-content/ql-cache/quicklatex.com-526a49c81ac3670c486559b3004d637d_l3.svg "Rendered by QuickLaTeX.com")
In AP Statistics, linear regression models are essential for analyzing and predicting the relationship between two quantitative variables. These models use a regression line, or line of best fit, to represent this relationship on a scatter plot. By understanding the equation of the regression line, including the slope and y-intercept, students can make accurate predictions and analyze patterns in the data. Mastering linear regression models is crucial for interpreting data and making informed statistical conclusions.
Learning Objectives
By studying linear regression models in AP Statistics, I will learn to analyze and predict the relationship between two quantitative variables. I will understand how to construct and interpret the regression line, calculate the slope and y-intercept, and evaluate the strength of the relationship using the correlation coefficient and R2R^2R2. These skills will enable me to make accurate predictions and draw meaningful conclusions from data, enhancing my overall understanding of statistical analysis.
Key Concepts in Linear Regression
Regression Line (Line of Best Fit):
The regression line is a straight line that best represents the data on a scatter plot. It minimizes the sum of the squared differences (residuals) between observed values and predicted values.
Equation of the Regression Line
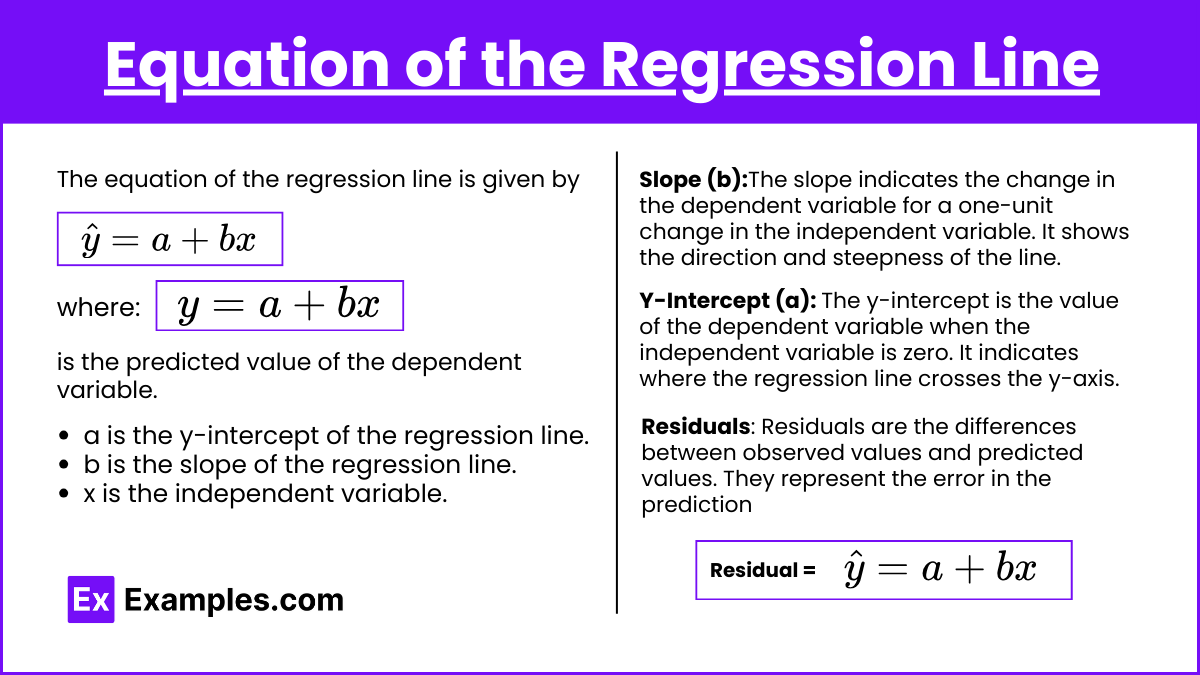
The equation of the regression line is given by:
\hat{y} = a + bx
where:
{y} = a + bx
is the predicted value of the dependent variable.a is the y-intercept of the regression line.
b is the slope of the regression line.
x is the independent variable.
Slope (b):
The slope indicates the change in the dependent variable for a one-unit change in the independent variable. It shows the direction and steepness of the line.
Y-Intercept (a):
The y-intercept is the value of the dependent variable when the independent variable is zero. It indicates where the regression line crosses the y-axis.
Residuals
Residuals are the differences between observed values and predicted values. They represent the error in the prediction. Residuals can be calculated using the formula:
Residual =
\hat{y} = a + bx
where y is the observed value and
\hat{y} = a + bx
is the predicted value.
Coefficient of Determination (R²)
The coefficient of determination indicates the proportion of the variance in the dependent variable that is predictable from the independent variable. It ranges from 0 to 1, with higher values indicating a better fit.
Calculating the Regression Line
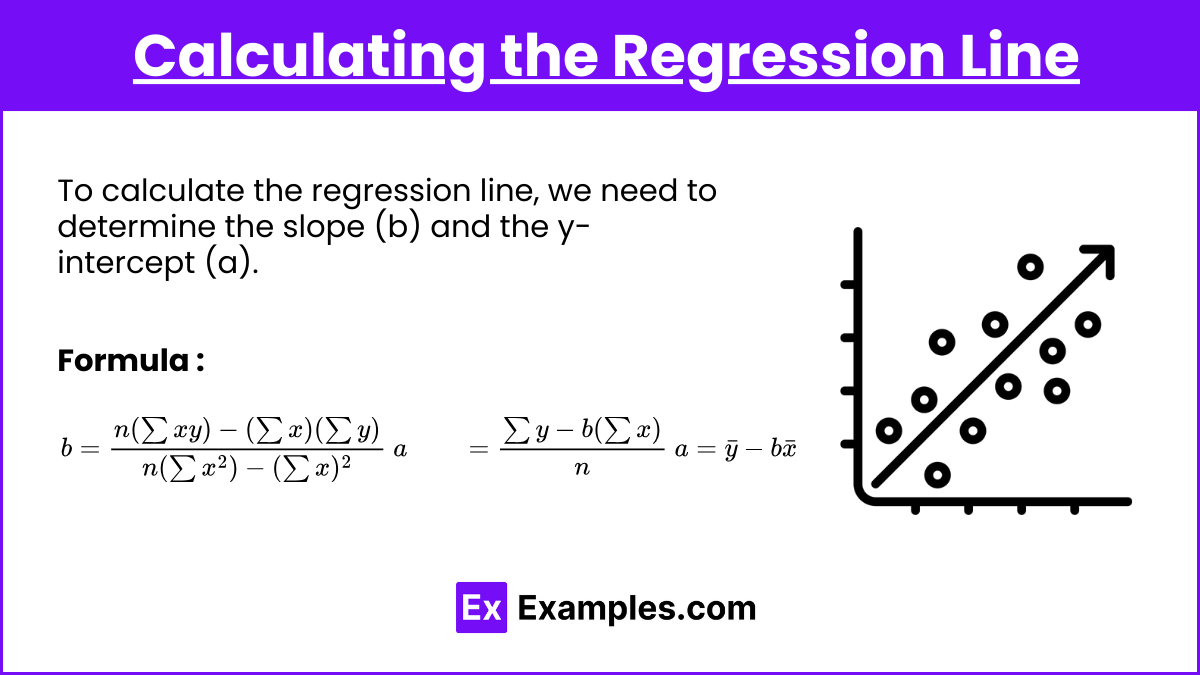
To calculate the regression line, we need to determine the slope (b) and the y-intercept (a).
Formulas:
\begin{align} b &= \frac{n(\sum xy) - (\sum x)(\sum y)}{n(\sum x^2) - (\sum x)^2} \ a &= \frac{\sum y - b(\sum x)}{n} \ a &= \bar{y} - b\bar{x} \end{align}
where:
n is the number of data points.
∑xy is the sum of the product of the independent and dependent variables.
∑x and ∑y are the sums of the independent and dependent variables, respectively.
∑x² is the sum of the squares of the independent variable.
Examples of Linear Regression
Example 1: Predicting Height from Shoe Size
Data: Sample of 10 individuals with their shoe sizes and heights.
Regression Line: Calculate the regression line to predict height based on shoe size.
Interpretation: Use the regression line to make predictions and analyze the relationship between shoe size and height.
Example 2: Predicting Exam Scores from Study Hours
Data: Sample of 10 students with the number of hours studied and their exam scores.
Regression Line: Calculate the regression line to predict exam scores based on study hours.
Interpretation: Use the regression line to make predictions and analyze the relationship between study hours and exam scores.
Example 3: Predicting Sales from Advertising Expenditure
Data: Sample of 10 companies with their advertising expenditures and sales revenues.
Regression Line: Calculate the regression line to predict sales based on advertising expenditure.
Interpretation: Use the regression line to make predictions and analyze the relationship between advertising expenditure and sales revenue.
Example 4: Predicting Temperature from Ice Cream Sales
Data: Sample of 10 days with ice cream sales and daily temperatures.
Regression Line: Calculate the regression line to predict temperature based on ice cream sales.
Interpretation: Use the regression line to make predictions and analyze the relationship between ice cream sales and temperature.
Example 5: Predicting Reaction Time from Age
Data: Sample of 10 individuals with their ages and reaction times.
Regression Line: Calculate the regression line to predict reaction time based on age.
Interpretation: Use the regression line to make predictions and analyze the relationship between age and reaction time.
Multiple-Choice Questions
Question 1
What does the slope (b) of the regression line represent in a linear regression model?
a) The predicted value of the dependent variable when the independent variable is zero.
b) The change in the dependent variable for a one-unit change in the independent variable.
c) The point where the regression line crosses the y-axis.
d) The difference between observed and predicted values.
Answer: b) The change in the dependent variable for a one-unit change in the independent variable.
Explanation: The slope (b) represents the rate of change in the dependent variable for each one-unit increase in the independent variable.
Question 2
In the regression equation
\hat{y} = a + b
, what does a represent?
a) The predicted value of the dependent variable when the independent variable is zero.
b) The change in the dependent variable for a one-unit change in the independent variable.
c) The sum of the squared residuals.
d) The proportion of variance in the dependent variable explained by the independent variable.
Answer: a) The predicted value of the dependent variable when the independent variable is zero.
Explanation: The y-intercept (a) represents the value of the dependent variable when the independent variable is zero, indicating where the regression line crosses the y-axis.
Question 3
Which of the following indicates a perfect linear relationship between two variables?
a) r = 0
b) r = 1
c) R² = 0.5
d) R² = 0
Answer: b)r = 1
Explanation: A correlation coefficient (r) of 1 indicates a perfect positive linear relationship, meaning all data points lie exactly on the regression line