

Planning a Study

In AP Statistics, planning a study is a fundamental skill that involves designing a research plan to systematically collect, analyze, and interpret data. This process includes defining the research question, selecting a sample, choosing a study design, collecting data, and analyzing results. Proper study planning ensures the data's validity and reliability, helping to draw accurate conclusions. Mastering these steps enables students to conduct robust statistical research and interpret findings effectively, which is essential for success in AP Statistics.
Learning Objectives
By studying planning a study, I will learn how to design and conduct research in AP Statistics. I will understand how to define research questions, select appropriate samples, choose study designs, and collect and analyze data. This knowledge will enable me to ensure the validity and reliability of my data, draw accurate conclusions, and effectively communicate my findings. Mastering these skills will enhance my ability to conduct robust statistical research and excel in AP Statistics.
Definition
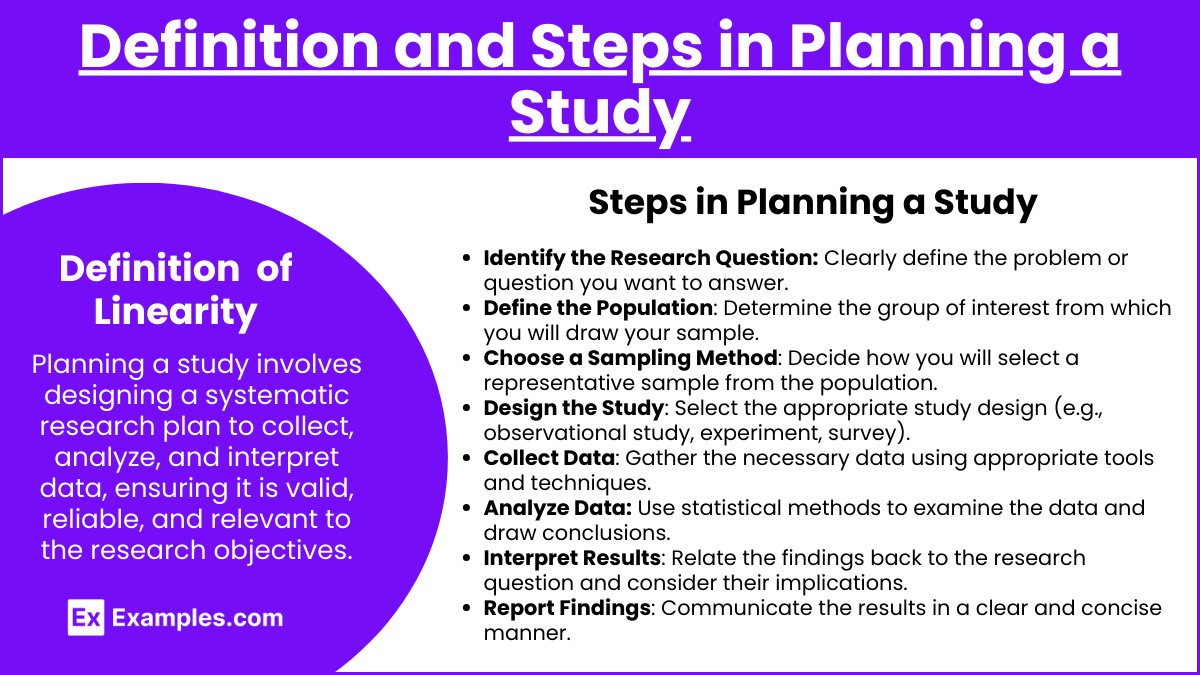
Planning a study involves designing a research plan to collect, analyze, and interpret data in a systematic way to answer specific questions or test hypotheses. This process ensures that the data collected is valid, reliable, and relevant to the research objectives.
Steps in Planning a Study
Identify the Research Question: Clearly define the problem or question you want to answer.
Define the Population: Determine the group of interest from which you will draw your sample.
Choose a Sampling Method: Decide how you will select a representative sample from the population.
Design the Study: Select the appropriate study design (e.g., observational study, experiment, survey).
Collect Data: Gather the necessary data using appropriate tools and techniques.
Analyze Data: Use statistical methods to examine the data and draw conclusions.
Interpret Results: Relate the findings back to the research question and consider their implications.
Report Findings: Communicate the results in a clear and concise manner.
Types of Studies
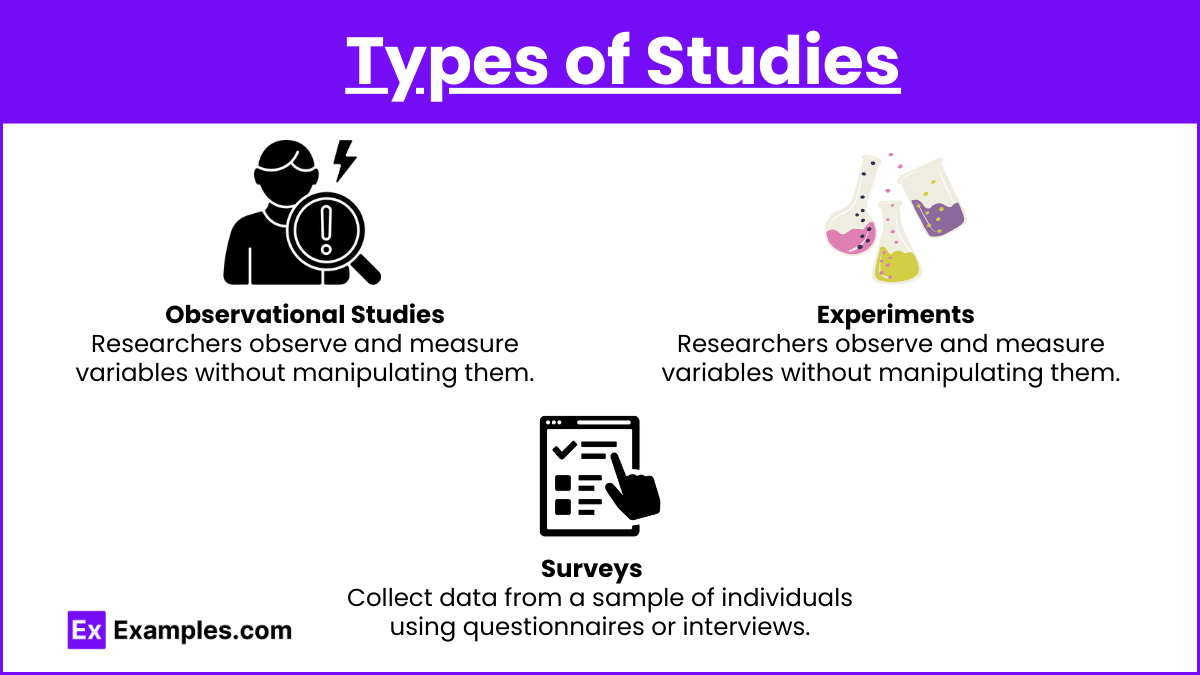
Observational Studies: Researchers observe and measure variables without manipulating them.
Experiments: Researchers manipulate one or more variables to observe the effect on another variable.
Surveys: Collect data from a sample of individuals using questionnaires or interviews.
Key Concepts in Study Design
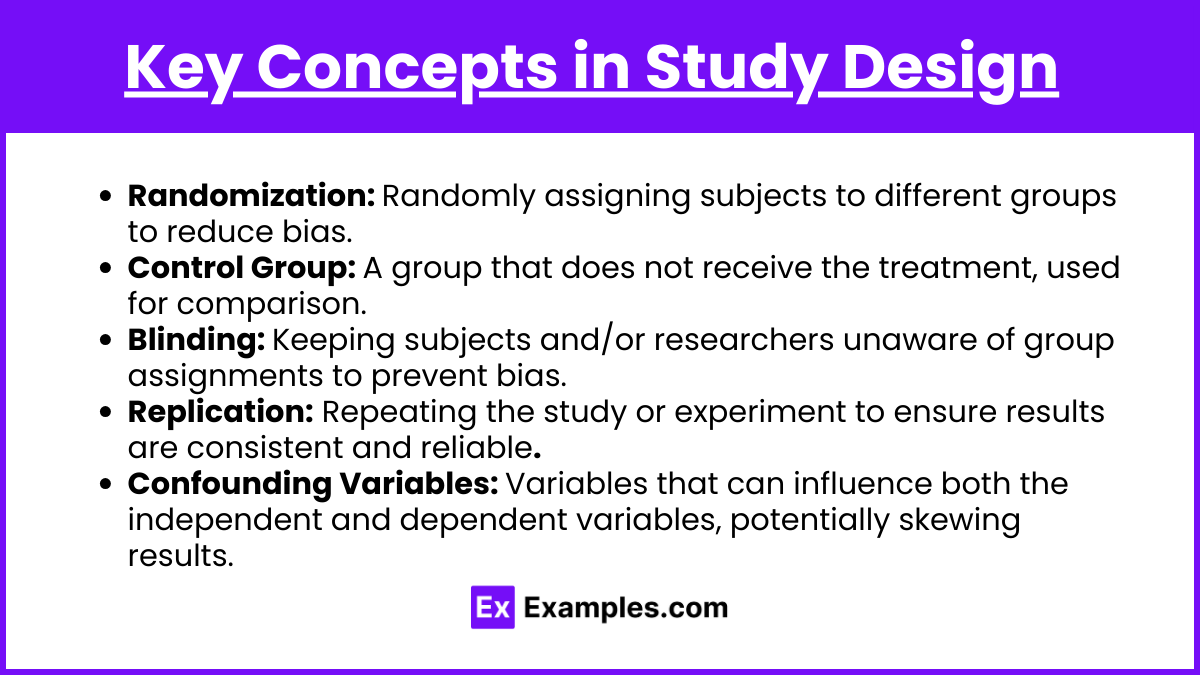
Randomization: Randomly assigning subjects to different groups to reduce bias.
Control Group: A group that does not receive the treatment, used for comparison.
Blinding: Keeping subjects and/or researchers unaware of group assignments to prevent bias.
Replication: Repeating the study or experiment to ensure results are consistent and reliable.
Confounding Variables: Variables that can influence both the independent and dependent variables, potentially skewing results.
Examples
Example 1: Observational Study
Research Question: Does smoking increase the risk of lung cancer?
Study Design: Track a cohort of smokers and non-smokers over time to compare the incidence of lung cancer between the two groups.
Example 2: Controlled Experiment
Research Question: Does a new drug reduce blood pressure more effectively than a placebo?
Study Design: Randomly assign participants to receive either the new drug or a placebo and measure their blood pressure over a specified period.
Example 3: Survey Study
Research Question: What is the average income of households in a city?
Study Design: Distribute a survey to a random sample of households asking about their income and analyze the responses.
Example 4: Cross-sectional Study
Research Question: What is the prevalence of diabetes in a population at a specific point in time?
Study Design: Collect data on diabetes status from a random sample of individuals at a single point in time.
Example 5: Longitudinal Study
Research Question: How does physical activity influence weight gain over 10 years?
Study Design: Follow a group of individuals over 10 years, regularly recording their physical activity levels and weight.
Multiple Choice Questions
MCQ 1
Which of the following is a key benefit of randomization in experimental design?
It ensures the sample is representative.
It reduces bias by equally distributing confounding variables.
It simplifies data analysis.
It guarantees the results will be significant.
Answer: 2. It reduces bias by equally distributing confounding variables.
Explanation: Randomization helps ensure that confounding variables are evenly distributed across treatment groups, reducing bias.
MCQ 2
In an observational study, researchers:
Manipulate variables to observe effects.
Randomly assign subjects to groups.
Observe and measure variables without intervention.
Use control groups to compare outcomes.
Answer: 3. Observe and measure variables without intervention.
Explanation: Observational studies involve observing and measuring variables without manipulating them or assigning subjects to groups.
MCQ 3
Which method can help prevent bias in a study by keeping participants unaware of their group assignments?
Randomization
Replication
Blinding
Stratification
Answer: 3. Blinding
Explanation: Blinding keeps participants (and sometimes researchers) unaware of group assignments, which helps prevent bias.