
Sampling Distributions for Sample Means

 :
: represents individual sample values and n is the sample size.
 , the mean of the sampling distribution
  is μ\muμ, and the standard deviation
  is
is 
 , the sampling distribution of the sample mean will be approximately normally distributed, regardless of the shape of the population distribution.


 .
.

 .
. .
.In AP Statistics, understanding sampling distributions for sample means is crucial. This concept involves the distribution of sample means from a population. Key principles include the Central Limit Theorem, which states that the sampling distribution of the sample mean approximates a normal distribution as the sample size grows. This knowledge is vital for making inferences about population parameters, conducting hypothesis tests, and estimating population means with accuracy.
Learning Objectives
You will be able to understand the concept of sampling distributions for sample means and how they are formed. The relationship between population parameters and sample statistics will be comprehended. The application of the Central Limit Theorem to approximate normal distributions will be recognized. You will be able to calculate the mean and standard deviation of sampling distributions. The importance of these distributions in making inferences about population parameters, conducting hypothesis tests, and estimating population means will be appreciated.
Definition
Sampling Distribution of the Sample Mean is the probability distribution of all possible sample means of a given size from a population.
Population vs. Sample:
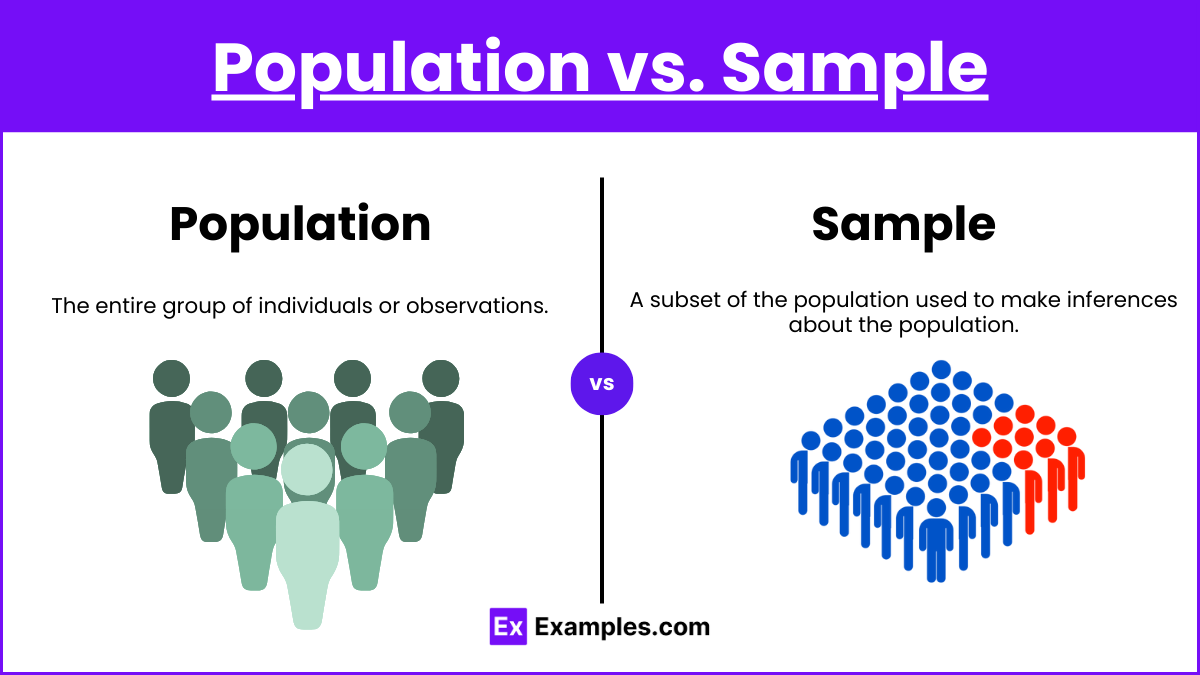
Population: The entire group of individuals or observations.
Sample: A subset of the population used to make inferences about the population.
Sample Mean :
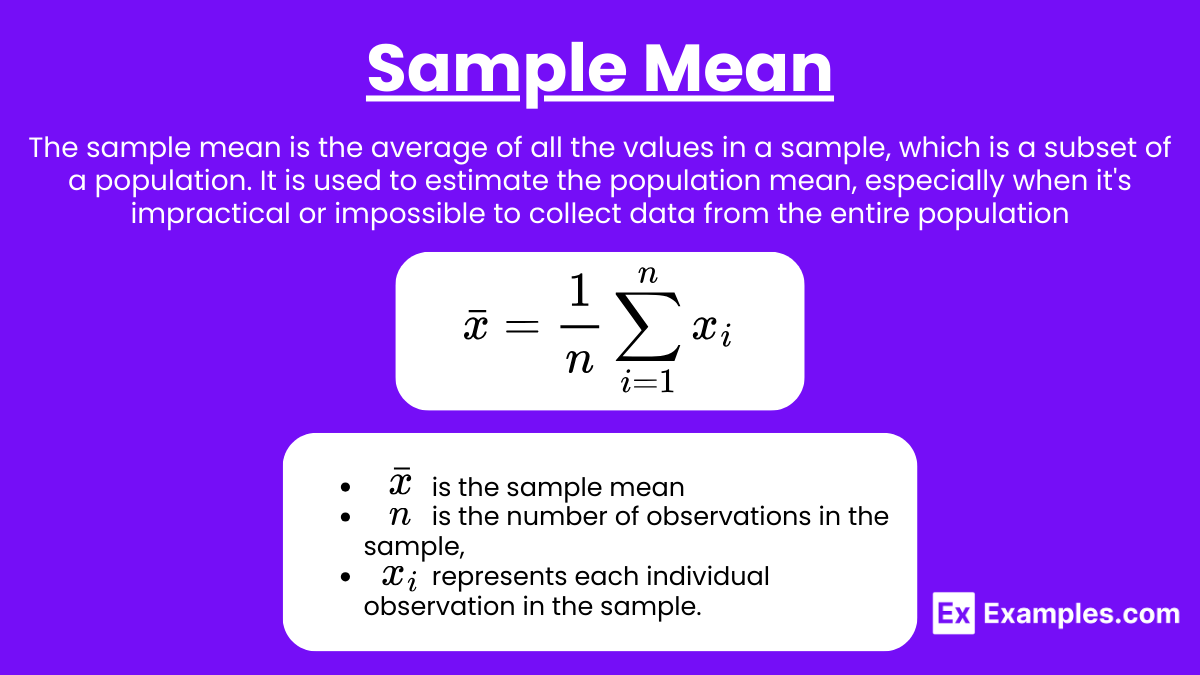
The average value of a sample.
Calculated as: represents individual sample values and n is the sample size.
Sampling Distribution
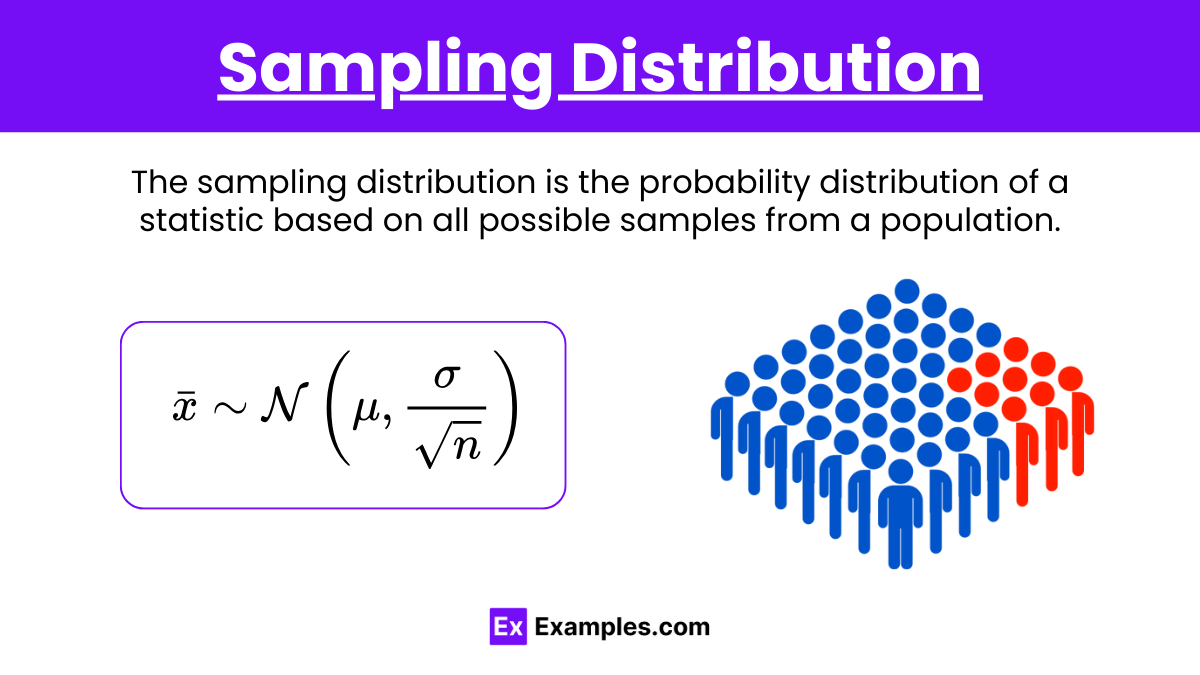
The distribution of sample means over repeated sampling from the same population.
If the population mean is μ\muμ and the population standard deviation is , the mean of the sampling distribution is μ\muμ, and the standard deviation is
Central Limit Theorem (CLT):
States that for a sufficiently large sample size , the sampling distribution of the sample mean will be approximately normally distributed, regardless of the shape of the population distribution.
Properties of Sampling Distributions
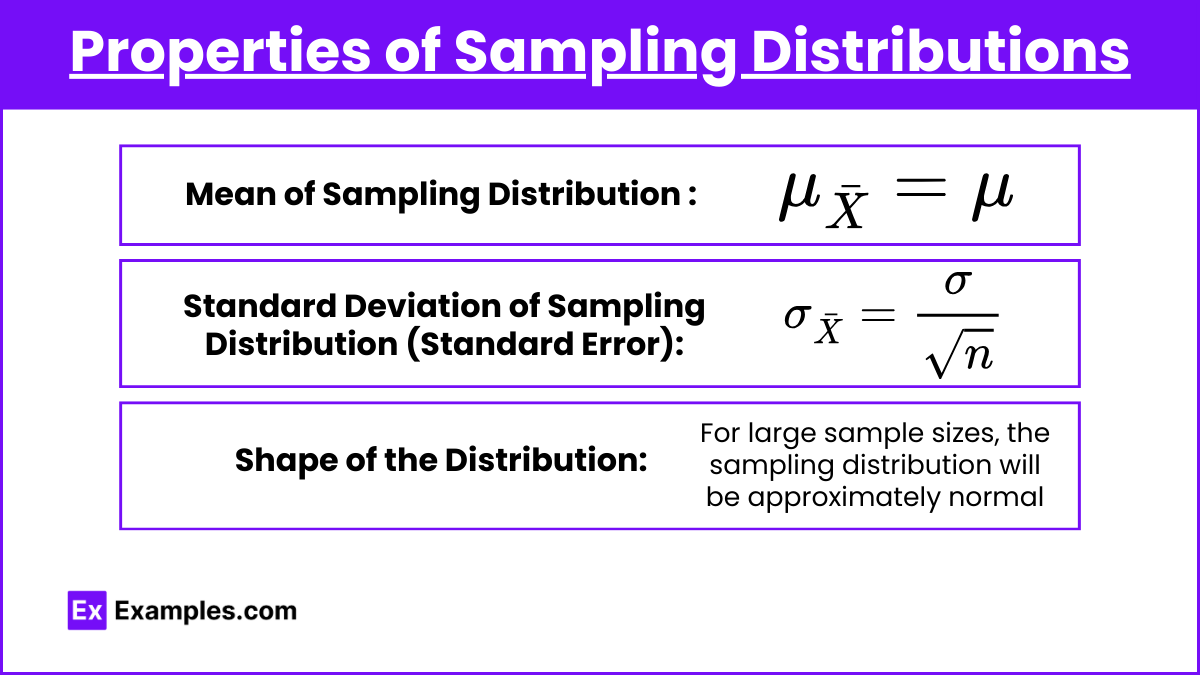
Mean of Sampling Distribution:
Standard Deviation of Sampling Distribution (Standard Error):
Shape of the Distribution:
For large sample sizes, the sampling distribution will be approximately normal.
Importance in Statistics
Estimation: Helps in estimating population parameters.
Hypothesis Testing: Used to determine the significance of sample statistics.
Examples
Example 1
Population Mean (μ): 50
Population Standard Deviation (σ): 10
Sample Size (n): 25
Calculate :
Example 2
A population has a mean of 100 and a standard deviation of 20. For samples of size 36, the standard deviation of the sample mean is:
Example 3
If the population distribution is not normal but has a mean (μ) of 70 and standard deviation (σ) of 15, with a sample size of 40, the distribution of the sample mean will still be approximately normal:
Example 4
For a population with mean 55 and standard deviation 5, and sample size 50, find the probability that the sample mean is greater than
$
\sigma_{\bar{X}} = \frac{5}{\sqrt{50}} = 0.71
$
$
Z = \frac{56 - 55}{0.71} = 1.41
$
Using Z-tables, .
Example 5
A population mean is 40 with a standard deviation of 8. For a sample size of 64, calculate the probability that the sample mean is less than 38.
$
\sigma_{\bar{X}} = \frac{8}{\sqrt{64}} = 1
$
$
Z = \frac{38 - 40}{1} = -2
$
Using Z-tables, .
Multiple Choice Questions
Question 1
The Central Limit Theorem states that the sampling distribution of the sample mean:
A. Is always normal regardless of the sample size.
B. Becomes approximately normal as the sample size increases.
C. Has a mean of zero.
D. Has a standard deviation equal to that of the population.
Answer: B. Becomes approximately normal as the sample size increases.
Explanation: The CLT indicates that as the sample size increases, the sampling distribution of the sample mean approaches a normal distribution, regardless of the population's shape.
Question 2
If a population has a mean of 75 and a standard deviation of 12, what is the standard deviation of the sample mean for samples of size 16?
A. 3
B. 6
C. 12
D. 48
Answer: A. 3
Explanation: The standard deviation of the sample mean is calculated by dividing the population standard deviation by the square root of the sample size: .
Question 3
Which of the following best describes the standard error of the mean?
A. It is the same as the population standard deviation.
B. It decreases as the sample size increases.
C. It increases as the sample size increases.
D. It is unrelated to the sample size.
Answer: B. It decreases as the sample size increases.
Explanation: The standard error of the mean is given by , which decreases as the sample size (n) increases.