
Sampling Distributions For Sample Proportions

 , the mean and standard deviation of its distribution, and conditions for normal approximation. Mastery of these principles is essential for making inferences about population proportions, enabling accurate hypothesis testing and confidence interval construction


 Using the standard normal distribution, you can calculate the probability that

 .
.
In AP Statistics, understanding sampling distributions for sample proportions is crucial. This concept involves the distribution of sample proportions from multiple samples of a given size from the same population. Key aspects include calculating the sample proportion , the mean and standard deviation of its distribution, and conditions for normal approximation. Mastery of these principles is essential for making inferences about population proportions, enabling accurate hypothesis testing and confidence interval construction
Learning Objective
You will be able to understand the concept of sampling distributions for sample proportions. You will learn to calculate sample proportions and comprehend the mean and standard deviation of their distributions. The conditions for normal approximation of the sampling distribution will be identified. Additionally, you will be able to apply these concepts to infer population proportions accurately, perform hypothesis testing, and construct confidence intervals, all essential skills for success in AP Statistics.
Key Concepts
Population Proportion (p)
The proportion of individuals in the population with a certain characteristic.
Sample Proportion
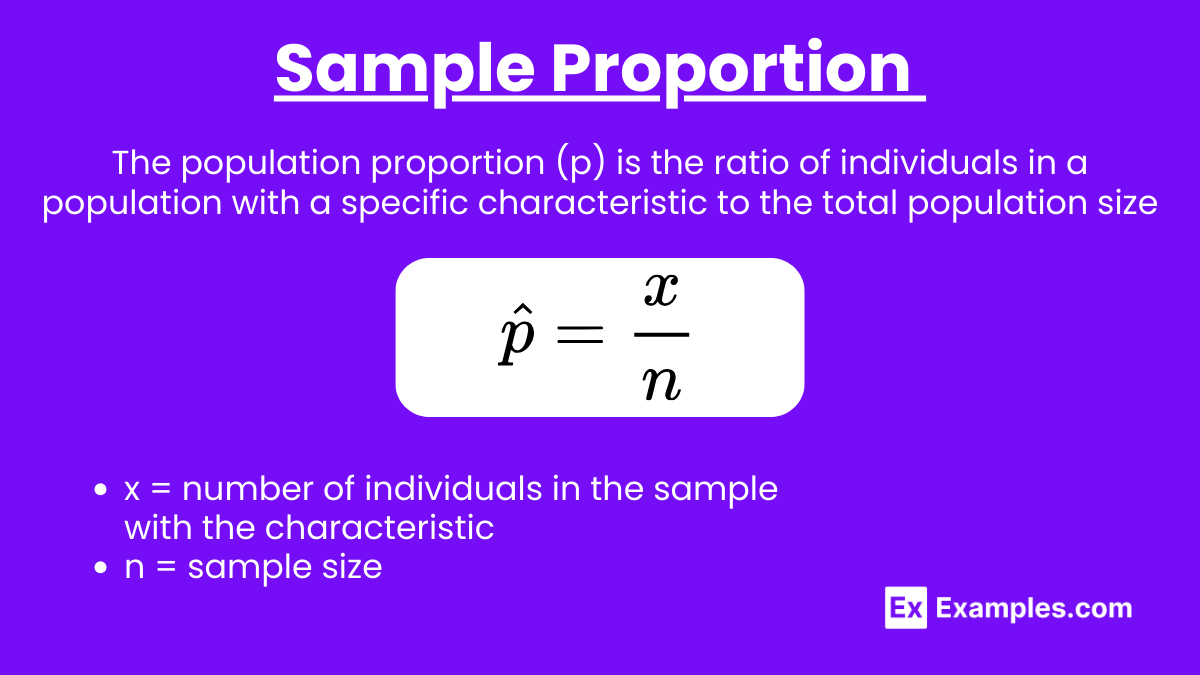
The proportion of individuals in a sample with a certain characteristic.
Calculated as:
x = number of individuals in the sample with the characteristic
n = sample size
Mean of the Sampling Distribution of
The mean of the sampling distribution of the sample proportion is equal to the population proportion p.
Standard Deviation of the Sampling Distribution of
The standard deviation (often called the standard error) of the sampling distribution of is given by:
p = population proportion
n = sample size
Conditions for Normal Approximation
For the sampling distribution of to be approximately normal, the following conditions must be met:
These conditions ensure that the sample size is large enough.
Central Limit Theorem
According to the Central Limit Theorem, as the sample size n increases, the sampling distribution of the sample proportion approaches a normal distribution, regardless of the shape of the population distribution.
Examples
Example 1: Calculating the Sample Proportion
Suppose a school has 1,000 students, and 200 of them are in the school's band. If you take a sample of 50 students and find that 12 of them are in the band, the sample proportion is:
Example 2: Mean of the Sampling Distribution
If the population proportion p of people who prefer chocolate ice cream is 0.6, then the mean of the sampling distribution of is:
Example 3: Standard Deviation of the Sampling Distribution
For a population proportion p=0.4 and a sample size n=100, the standard deviation of the sampling distribution of is:
Example 4: Normal Approximation Check
If p=0.7 and n=50: np=50×0.7=35 n(1−p)=50×0.3=15 Both values are greater than 10, so the sampling distribution of can be approximated by a normal distribution.
Example 5: Probability Calculation
If p=0.5 and n=200, and you want to find the probability that the sample proportion is between 0.45 and 0.55: Using the standard normal distribution, you can calculate the probability that falls within this range.
Multiple Choice Questions
Question 1
What is the mean of the sampling distribution of the sample proportion if the population proportion p is 0.3?
A. 0.3
B.
C.
D. 0.7
Answer: A. 0.3
Explanation: The mean of the sampling distribution of the sample proportion is equal to the population proportion p.
Question 2
For a population with proportion p=0.5 and a sample size n=100, what is the standard deviation of the sampling distribution of ?
A. 0.05
B. 0.1
C. 0.25
D. 0.5
Answer: A. 0.05
Explanation: The standard deviation (standard error) is given by .
Question 3
Which condition must be met to use the normal approximation for the sampling distribution of ?
A. The sample size must be less than 30.
B.
C. The population must be normally distributed.
D. The sample size must be at least 50.
Answer: B.
Explanation: These conditions ensure that the sample size is large enough for the sampling distribution of to be approximately normal.